

What The Hell Is That Ticking Sound In My Head! Household Wealth – The Real Story
by Lee Adler •
Yesterday the media got all bulled up over the Fed’s new data on household wealth showing that it hit a record in the fourth quarter of 2013. As usual with Wall Street’s chattering media class, this wasn’t quite the whole story, at least not the “real” story. The real story is deeply ominous.
The total net worth of households and non profits did reach a record in nominal terms. That is true. But that’s not the same thing as the wealth of individual households hitting a record in real, inflation adjusted terms. In addition, the calculation of the numbers is based on absurd assumptions which everyone takes for granted as being realistic. And if the net worth of the top 1% was lopped off, the picture would be far bleaker. But we need not even go there. By now it’s been well established that those in the upper income strata have gotten virtually all of the gains in wealth in recent years while the majority falls deeper into the economic mire.
For this analysis I just looked at the data as a whole, and did the simple exercises of dividing the total net worth of households and non-profits of $80.66 trillion by the census bureau’s estimate of the total year end population of the US of 317.44 million. Then I converted that to real terms by dividing the result by the Consumer Price Index. That’s conservative enough. It probably understates inflation by underweighting housing and doesn’t take into account asset inflation at all. But it’s a widely accepted means of converting nominal measures into real, inflation adjusted numbers. The same operation is then performed for every quarter going back in time as far as the data goes. The results are then plotted on this graph. It shows how the wealth of households has trended in real terms per capita.
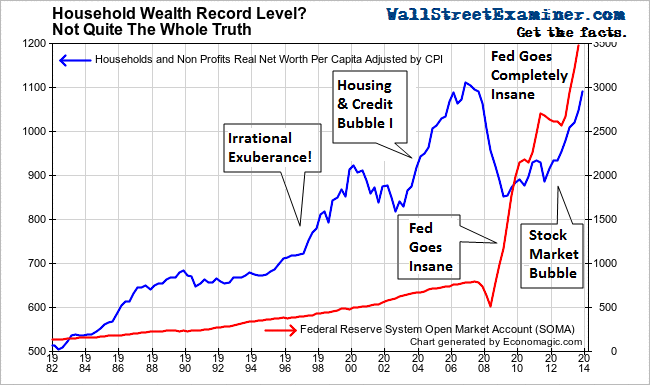
Real Household Net Worth Per Capita – Click to enlarge
I’ve also plotted alongside that line a graph of the Fed’s holdings in its System Open Market Account, which is all of the Fed’s paper holdings that it acquires in trades with Primary Dealers. Prior to 2007, the Fed had steadily grown its holdings at the rate of about 4-5% per year. Household wealth grew at almost double that rate beginning in 1994, prompting Alan Greenspan to proclaim “irrational exuberance” in 1996. Greenspan was particularly concerned that the prices of stocks were growing faster than the Fed’s balance sheet. That was something new. Historically they had grown at more or less the same rate.
The collapse of the internet/tech bubble in 2000-2003 took some of the bloom off the rose as household wealth fell back to the long term trend. Panicked, the Fed sharply lowered interest rates while keeping its asset growth in the 4-5% range. That was sufficient to trigger Housing Bubble I which led to record levels of household wealth per capita in real terms beginning in 2004. That tide peaked in 2006, when the housing bubble crested.
As the Fed scrambled in the early stages of the credit crisis it kept rates low, but withdrew cash from the Primary Dealer system and shrunk its SOMA to fund emergency lending programs in 2007 and most of 2008. The housing bubble crashed and stocks had a big bear market. Household wealth in real terms plunged back to trend. That’s where, like Greenspan before him, Bernanke hit the panic button, opening the floodgates on a massive surge of Fed credit into the financial markets via the Primary Dealers. That initially was followed by a slow recovery in household net worth as the stock market turned sharply and housing prices bottomed in 2009-2011. By late in 2012, both markets were trending sharply higher.
The Fed had a brief return of sanity as it paused QE through most of 2011 and 2012. The housing and stock market recoveries were actually picking up steam during that period. But that was only a temporary remission of the craziness.
Late in 2012 the Fed’s went completely mad. In spite of the fact that both house prices and stocks were in raging bull markets by that point, it opened the money printing floodgates again. This caused extreme distortions in the housing market where prices rose to bubble levels while sales activity remained near record lows. The majority of households were and are in no position to be able to afford buying a house. But prices skyrocketed because there was no supply and absurdly low mortgage rates were subsidizing buyers and inflating prices. It also caused the bubble conditions we see today to develop in stock prices.
The funny thing is that even though few houses are on the market, and even fewer are sold, the Fed and everybody else thinks that we can simply extrapolate the value of all housing based on this tiny sample of sale prices. The media, Wall Street, and the economic establishment all buy in to this ridiculous charade.
Has anyone bothered to stop and think what would happen to prices if a few more people had to sell their houses in the face of the current near record low buyer demand. These prices are fictitious in that regard. By extrapolating those few sale prices to the entire US housing inventory, the Fed creates the illusion of massive amounts of wealth and capital, backed by massive amounts of mortgage debt. It’s imaginary. It’s pure fiction. This is the essence of the fictitious capital nightmare we face. And nobody is paying attention because of the way we think about this data. It’s irrational and insane, but everybody looks at it the same way, just like they did a decade ago.
Don’t think that another collapse can’t happen, because it can. We’re making all the same mistakes, only worse because we should know better by now.
Despite what the headlines say, there’s no new high in net worth per capita, and by extension per household, in spite of all the insane central bank money creation that we’ve seen over the past 5 years. Net worth per capita was still below the 2006 peak level in real terms in the fourth quarter. No doubt that when the first quarter data is in it will be at a record, most likely by a substantial margin given what has already transpired this year. But the questions we must ask are who benefitted, and is it real?
If most people don’t own stocks, or houses in areas that have seen strong appreciation, and if house prices would fall in the presence of an increase in homes for sale to historic norms, then this new high in net worth is an illusion. Increasing wealth at the top of the household wealth strata cannot carry an economy to growth indefinitely. “Wealth” based on a tiny sample of inflated sales prices at record low financing costs cannot be actually liquidated. It isn’t real. If the majority do not experience economic gains and therefore provide a strong and broad base of real demand that can sustain active markets with normal levels of inventory, then the growth of asset prices will once again eventually slam back to trend, and probably worse.
We have seen that three prior surges in household net worth driven by cheap and easy central bank credit have crashed back to earth after about 5 years of extreme bubble gains . The current surge is now in its fifth year. What’s that ticking sound I hear?
Keep track of the insanity of the Fed, Primary Dealers, the US Treasury, other central banks and a whole cast of nefarious characters as they drive markets, in the Wall Street Examiner Professional Edition Fed Report and Treasury update. Try the Professional Edition risk free for 30 days!
Via The Wall Street Examiner » Wall Street Examiner Exclusives. To see the original Click here.
Get the facts. Follow Lee Adler’s chronicling of the insanity of the Fed, Primary Dealers, the US Treasury, other central banks, and a whole cast of market movers in their nefarious market manipulations and interference, in Wall Street Examiner Professional Edition Fed and Treasury reports.
You can check out the Wall Street Examiner Professional Edition service risk free for 30 days.


Once again, right on the money regarding housing. I work in real estate on a daily basis in four ways:
Standard seller (people who are not underwater. Few and far between, many of them mom and dad’s house now that they have passed. No updates, crap house. Minimal money)
Short sale seller (underwater sellers that need to sell due to job loss, income reduction, death, divorce, or illness. These are many and most people)
REO seller (These are the banks selling their foreclosures. Most of them are out of touch with reality when pricing their homes, especially with damaged goods and unknown factors like septic systems that affect pricing. And, thanks to the Dodd-Frank act, reverse mortgage foreclosures CANNOT accept below list price because this is the appraised value and that changes in 180 day increments!)
BPOs. These are Broker Price Opinions (not every state allows them for a fee, mine does). These are done on homes where the owner is in the process of a loan modification (better chance of seeing your maker), deed-in-lieu of foreclosure (only works if you have one loan and no other liens like taxes/water/sewer/mechanics), short sale, or foreclosure.
Folks, I do BPO’s on the same homes several times over the course of about 2 years. It starts out as a loan mod (people living there, mowing the grass, etc) moves into a short sale (listed in MLS, less stuff gets done, sold “as is”) to vacant with notices in the windows and now the auction date is looming. I find that most people, unless they have a loan with a small town community bank, generally can stay, for free, in their home for up to 24-36 months before the sheriff shows up to evict them. And even that sometimes doesn’t happen. They hang on, and the bank offers them “relocation” assistance in the form of 1000 to (I have personally witnessed this) 10,000 to move out in a certain period of time, generally 14-30 days.
Almost every single person I talk to who bought their house even 2 years ago is under water. How, you say, can that be if the market had already started to recover? Well…..
I live in a mostly rural area. I would say that 95% of the buyers use some form of loan that is either 100% financing (USDA rural and VA are the only 2) or FHA with 3.5% down or conventional non-conforming with 5% down.
If you bought your house in 2009-2010 and used these types of financing, you have zero equity, as you have paid nothing towards the principal. How can you sell and pay closing costs, attorney fees, and commissions? You can’t. There is ZERO room for negotiation.
So, yes, in some areas in some property types there was “appreciation” but is was not real as was explained in the article. It was dumb buyers doing the same dumb things they always do when there is a perceived shortage of homes they go nuts and buy on impulse! How crazy is that?
Also, banks that have foreclosed on home months, or even YEARS ago are not putting these vacant homes back on the market. They are dribbling them on to prevent further price depreciation. This is backfiring, because here we experience all the seasons which lead to freeze damage, ice damage, water damage, and then mold. Vandals break in and steal copper, appliances, AC condensers, light fixtures, boilers, hot water tanks, etc. So how much is a cape, let’s say built in 1985 with an original roof, siding, and windows (economic life of a roof here is about 20 years, heating system about 15, hot water tank, about 5-7) now worth when some of the stuff is GONE and there is trash everywhere, mold, spray paint, beer cans, and glass? Do the math. The buyer who purchased this home in 2008 for 239K with “creative” lending of 70/30 or 80/20 mortgage (basically 100% financing) and probably refinanced just before the SHTF to squeeze out another 10K to pay credit cards or car, moved out, owes 250K on a home that dropped 30% AT LEAST to 175K and now vandalized is worth 80K.
I see this every day. EVERY DAY folks, this is NO exaggeration.
So, once again I would say to the buyers out there:
If you find yourself barely qualifying for an FHA loan, stop. The mortgage broker and the agent you are working with may want you to buy this home, but you are doing yourself NO favors. Especially if your job security is questionable, you plan on starting a family, your mom and or dad are older and possibly in bad health. These factors, with no equity in your home, will impact your ability to pay comfortably for your home. One defunct hot water heater, one bad clothes washer, and you are done.
I council all of my first time buyers to purchase a 2 or 3 unit home first. The rent(s) you will get will buffer you in times of economic strain, and there are plenty of tenants out there.
Think of this:
In my area, you can buy a “triple decker” in a rural market for about 150-170K. Three bedroom each unit, about 1000 square feet a unit, one bath each. You live on the first floor and rent the second floor for 800 and the third floor for 750. Your mortgage (FHA with PMI and taxes included is about $1200 a month. HELLLOOOO this is a no brainer! Your 2 rents will cover your nut! Yes, yes, maybe you want “privacy” and don’t want to deal with tenants. WAH WAH. Buy the multi-family, live there for 3 years, save your money, and then KEEP the multi and buy a SF home!
DO NOT buy a condo for heaven’s sake unless it’s in a price-stable market like waterfront (Miami, Boston, NYC, Cape Cod, etc. Although you probably won’t be able to afford them anyway).
Buy because you plan on staying there for a while (at least 7 years) not because all your friends own you want to be like them.
Don’t buy into the hype of a housing “shortage”. I don’t know what alternate universe this is, but’s it’s not mine.
Miami is that last place in the world I’d buy a condo, or any property, as much as I love the place.
First of all, the market in that place is a roller-coaster. I’ve lived long enough to witness insane booms and busts in south Florida, and just 6 years ago, 2008, you could have bought almost anything you wanted in Miami Beach for whatever you felt like paying if you had cash, because you could get almost nothing financed. There was at that time a “black list” of 190 condo developments, including new, glossy, high end towers, that were blacklisted for financing, meaning you couldn’t get a mortgage.
Now the place is running hot again and prices are at 2006 levels or higher. Bad idea to buy anything at the peak, especially after a run like the past 5 years.
It may or may not be from “global warming’, but the bald fact is that sea levels ARE RISING, and the Biggs Waters bill means no more subsidized insurance for coastal properties. Miami, which is right at sea level, is already experiencing non-seasonal salt water flooding, and that will probably get worse over time. The city is already consulting with a Dutch engineering firm to see what it needs to do to stave off the rising waters over the next 20 years, and what will have to be done is hellishly expensive and no way guaranteed to work. What will it mean for property prices when the insurance that used to cost you $4000 a year (!!!) when it was heavily subsidized by the taxpayers, now costs more like $30,000 a year?
Chicago:
You are correct on a lot of this regarding Miami. I only mention it because of ocean front being limited to what there is an no more. And, as you point out, probably shrinking even more in supply.
Condos elsewhere would not hold their value as much as an ocean front unit just due to scarcity of it and the perceived prestige of it as well.
All the inflation of the Feds money printing has gone into asset bubbles and not CPI. The rise in net worth is INFLATION.
As for household wealth not hitting a record high in “real, inflation-adjusted terms,” I say that Doubting Thomas (aka Administrator) is right.
I’m not one for charts, graphs, and long gray analysis but memory and personal anecdotal evidence is something I can get my teeth into. Thirty-five cent hamburgers in the mid-sixties, 23 cent gas in 1970, and nickel newspapers in the mid-seventies are some of my memories.
All in all, I’d say consumers are paying 15 to 20 times more for most items than we paid 45 years ago. Sure, some stuff’s not quite so dear (mass produced items), but other costs are higher (personal services.)