WHAT ARE THESE PEOPLE DOING?

The two charts below may explain why, despite the propaganda about low unemployment, tremendous job growth and the retirement of Boomers explaining the lower participation rate, the economy is in recession, the middle class is pissed off, and the smell of revolution is in the air. When one in four Americans in the prime working years of 25 to 54 are not working, you’ve got a problem. What are 28.9 million people in the prime of their lives doing, if they are not working for a living. Sure some women are staying home to raise their kids, but how many two parent families can afford to get by on one income these days?

Just based on the historical record of employment to population ratios, the country is short by 3 million to 5 million jobs in this key demographic category. This has nothing to do with Boomers or retirement. Any man between the ages of 25 and 54 years old who is not truly disabled should be working. If they are not, they are either a good for nothing lazy free shitter, or the complete destruction of our blue collar industries by politicians, bankers, and corporate CEOs has left men with no remaining options.

In 1970, 96% of males between the ages of 25 and 54 were participating in the workforce and 93% were employed. Today, only 88% of males between the ages of 25 and 54 are participating in the workforce and only 83% are employed. What are the 12% of males in their prime working years doing, if they’re not working? Even the female participation rate for 25 to 54 year olds is the lowest in almost a quarter century.

I believe this data is at the gist of Trump’s growing popularity. You have a portion of the 25 to 54 population not working because they choose to not work. They are essentially members of the free shit army and expect the producers to pay their way. They will vote Clinton or Sanders. Then there are middle class 25 to 54 year olds who have been laid off because their companies shipped the jobs overseas or the overwhelming tax and regulatory burdens imposed by Obama and his minions have put companies out of business resulting in more layoffs.

Men and women in the prime of their life not working get very angry and frustrated. That anger is bubbling over and the MSM and establishment politicians are shocked because their luxurious secluded lives are unaffected. They will be flabbergasted when Trump wins the presidency on this wave of anger and frustration.


BACK TO SCHOOL FOR THE FREE SHIT ARMY

Of course they need free school supplies before starting their free breakfasts and free lunches next week. Of course, there is no need for them to learn English in our government run schools. I bet every woman and child in that free shit line has a smart phone.

Meanwhile, working Americans are busy buying their kids’ school supplies this week and getting ready to pay for their lunches starting next week. We’re working harder so the free shitters don’t have to. Welcome to Obama’s American paradise of free shit.

“The community” = the children of illegal migrants.

Via Goodbye America (in a photo)


HOW ABOUT SOME OBAMAINTERNET TO GO ALONG WITH YOUR OBAMAPHONE

This article sells this idea as if it is no big deal. They try to convince you that the Obamaphone meme is false. They declare it was a program started during the Reagan years. It’s the usual progressive liberal bullshit about the poor not having access to cell phones.

Here are the facts:

  • This program cost $800 million per year before Obama entered office.
  • This program now costs over $2.2 BILLION per year after Obama and his minions advertised the availability of these Obamaphones and begged their voters to get one.
  • You, the working taxpayer, pays $2.50 per month on your cell phone bill so the free shit army can call in their drug deals for free.
  • Obama and his minions also thought it was a good idea to give out these subsidies without making anyone prove they were eligible. Easy peasy. The corrupt phone sellers were thrilled. And the free shit army’s eyes lit up.
  • After the blogosphere began revealing the massive fraud and cost to the American taxpayer, the FCC was forced to make people prove they met the eligibility requirements.
  • In a shocking development 41% of the Obamaphone recipients could not or would not prove their eligibility. That puts the annual fraud amount at around $900 million.

As you can see, this is another highly successful government program. So what do you do with a program racked with 41% fraud? If you are Obama, you expand it to cover internet service for the free shit army. You have to hand it to the liberals, they know how to solidify their core voting base. Just keep doling out more free shit.


FCC proposal would extend Lifeline voice subsidy to broadband

The U.S. Federal Communications Commission will consider including broadband within a controversial program that subsidizes telephone or mobile service for poor people.Recipients of the FCC’s Lifeline program, which provides a US$9.25 monthly subsidy for voice service, could use that money to purchase broadband service instead under a proposal from FCC Chairman Tom Wheeler. Eligible households would continue to receive one $9.25 monthly subsidy, and they could choose whether to apply the money to traditional telephone service, mobile service or broadband, FCC officials said Thursday.Conservative critics of Lifeline call the program Obamaphone, and they portray it as an attempt to give poor people free mobile phones in exchange for votes for President Barack Obama in past presidential elections. A single YouTube video from the 2012 election season drove part of the misconception about the program.

Continue reading “HOW ABOUT SOME OBAMAINTERNET TO GO ALONG WITH YOUR OBAMAPHONE”

13 EASY STEPS TO $75,000 OF FREE SHIT

1. Don’t get married to her
2. Use your mom’s address to get mail sent to
3. Guy buys a house
4. Guy rents out house to his girlfriend who has two of his kids
5. Section 8 will pay $900 a month for a three-bedroom home
6. Girlfriend signs up for Obamacare so guy doesn’t have to pay out the butt for family insurance
7. Girlfriend gets to go to college free for being a single mother
8. Girlfriend gets $600 a month for food stamps
9. Girlfriend gets free cellphone
10. Girlfriend gets free utilities
11. Guy moves into home but uses mom’s house to get mail sent to
12. Girlfriend claims one kid and guy claims one kid on taxes… now you both get to claim head of household at $1,800 credit
13. Girlfriend gets disability for being “bipolar” or having a “bad back” at $1,800 a month and never has to work again

This plan is perfectly legal and is being executed now by millions of people.

A married couple with a stay-at-home mom yields $0.00 dollars.

An unmarried couple with stay-at-home mom nets:

$21,600 disability +
$10,800 free housing +
$6,000 free Obamacare +
$6,000 free food +
$4,800 free utilities +
$6,000 Pell grant money to spend +
$12,000 a year in college tuition free from Pell grant +
$8,800 tax benefit for being a single mother

= $75,000 a year in benefits

Via Acting Man


60% Of Households Get More Benefits Than They Pay In Taxes

Keep working hard. Remember. The Free Shit Army is depending upon you.


Authored by Mark Perry at AEI via Contra Corner blog,

The Congressional Budget Office (CBO) just released its annual report on “The Distribution of Household Income and Federal Taxes” analyzing data through 2011 on American household’s: a) average “market income” (a comprehensive measure that includes labor income, business income, and income from capital gains), b) average household transfer payments (payments and benefits from federal, state and local governments including Social Security, Medicare and unemployment insurance), and c) average federal taxes paid by households (including income, payroll, corporate, and excise taxes).

Some additional analysis and commentary will be provided here that reveal a yet-to-be discussed major implication of the CBO report – almost the entire burden: a) of all transfer payments made to American households and b) of all non-financed government spending, falls on just one group of Americans – the top one-fifth of US households by income.

That’s correct, the CBO study shows that the bottom three income quintiles representing 60% of US households are “net recipients” (they receive more in transfer payments than they pay in federal taxes), the second-highest income quintile pays just slightly more in federal taxes ($14,800) than it receives in government transfer payments ($14,100), while the top 20% of American “net payer” households finance 100% of the transfer payments to the bottom 60%, as well as almost 100% of the tax revenue collected to run the federal government. Here are the details of that analysis.

cbo1

The figures in  the graph above show the amount of federal taxes paid by the average household in each income quintile minus the average amount of government transfers received by those households in 2011. For each of the three lower income quintiles, their average government transfer payments exceeded their federal taxes paid by $8,600, $12,500, and $9,100 respectively, and therefore the entire bottom 60% of US households are “net recipients” of government transfer payments. Averaged across all three lower income quintiles, we could say that the lowest 60% of American households by income received an average transfer payment of about $10,000 in 2011. And because the government has no money of its own, where did those transfer payments come from to finance the “net recipient” households? Where else, but from the top two income quintiles, and realistically almost exclusively from Americans in the highest quintile.

Specifically, the average household in the fourth quintile paid slightly more in federal taxes ($14,800) than it received in transfer payments ($14,100) in 2011, making the average household in the second-highest income quintile a “net payer” household in the amount of $700 in 2011. Basically, households in the fourth income quintile paid enough in taxes to cover their transfer payments, and then made a minor contribution of $700 on average to help cover the transfer payments of the “net recipient” households in the bottom 60% and make a small contribution to the federal government’s other expenditures.

But the major finding of the CBO report is that the households in the top income quintile are the real “net payers” of the US economy. The average household in the top one-fifth of American households by income paid $57,500 in federal taxes in 2011, received $11,000 in government transfers, and therefore made a net positive contribution of $46,500. The second-highest income quintile basically just barely covers its transfer payments, so it’s really the top 20% of “net payer” households that are financing transfer payments to the entire bottom 60% AND financing the non-financed operations of the entire federal government.

Here’s another way to think about the burden of the “net payer” top income quintile. The average household in that income quintile made a contribution net of transfers in 2011 in the amount of $46,500. That would be equivalent to the average household in the top quintile writing four checks: 1) one check in the amount of $8,600 that would cover the average net transfer payments of a household in the bottom quintile, 2) another check for $12,500 to cover the average net transfers of a household in the second lowest quintile, 3) a third check in the amount of $9,100 to cover the average net transfer payments to a household in the middle income quintile, and 4) then finally writing a check for the balance of $16,300 that would go directly to the federal government, which for the households in the quintile as a whole would have covered almost 100% of the non-financed federal government spending in 2011.

So except for a small contribution net of transfers in the amount of $700 from the average household in the fourth quintile, the highest income quintile is basically financing the entire system of transfer payments to the bottom 60% AND the entire operation of the federal government. And yet don’t we hear all the time that “the rich” aren’t paying their fair share of taxes and that they need to shoulder a greater share of the federal tax burden?

Hey, they (the top 20%) are already shouldering almost the entire federal tax burden along with almost the entire system of entitlements and transfer payments! And that’s not “fair” enough already?

cbo2

The chart above shows another way that the CBO data reveal an extremely unequal distribution of government transfer payments and federal taxes by displaying the ratio of “dollars received in government transfers per dollar paid in federal tax revenues” by income quintile in 2011 (these data are from row 8 in the table above). The average household in the lowest quintile received $9,100 in government transfer payments in 2011 and paid only $500 in federal taxes, for a ratio of $18.20 in transfer payments for every $1.00 paid in federal taxes that year.

In contrast, the average household in the top income quintile received $11,000 in government transfers in 2011, but paid $57,500 in federal taxes, for a ratio of 19 cents in government transfer payments per dollar paid in federal taxes. This analysis is a further illustration that the bottom three quintiles are “net recipient” households that received more than $1 in government transfer payments for every $1 paid in federal taxes in 2011, while households in the fourth quintile were minor “net payers” in 2011 and received slightly less than a dollar in transfer payments on average ($0.95) for every $1 paid in federal taxes. “Net payers” in the top quintile received only $0.19 in government transfer payments per $1 paid in federal taxes in 2011.

cbo3

This final chart shows average tax rates by quintile in 2011, both before and after government transfer payments. The blue bars in the chart show the average tax rates by income quintile from the CBO report (Table 4) and are also displayed in the top table above in row 5, calculated by dividing federal taxes paid (row 4) into “Before Tax Income” (row 3, Market Income + Government Transfers).

Adjusting for government transfers received, the brown bars in the chart are calculated by dividing “federal taxes paid minus government transfers received” (row 6 in the table) into Before-Tax Income (row 3), and show average tax rates by income quintile after government transfers. For example, the average “net recipient” household in the lowest income quintile received a “negative tax” payment of $8,600 in 2011, had an average before-tax income of $24,600, for a negative tax rate of 35%.

Reflecting their “net recipient” status, all three lower income quintiles had negative average tax rates in 2011, and only the “net payer” households in the top two income quintiles had positive after-transfer tax rates of 0.7% for the second-highest quintile and 18.9% for the top quintile. This further demonstrates that after transfer payments, households in the bottom 60% are “net recipients” with negative income tax rates, while only the top two “net payer” income quintiles had positive tax rates after transfers in 2011…….

Gratitude

Hat tip to flash. No commentary necessary. It speaks for itself.

Via The Lonely Libertarian

I have mixed feelings about this post. But I’m just going to report the facts as I observed them.

Every year, the local Kiwanis Clubs team together with the Salvation Army and Walmart to host a Back to School fair for underprivileged kids in the area. There’s snacks and bouncy houses, a vaccination booth (don’t get me started here), and each child receives a backpack, lunch box (don’t know why since they all get free lunches), and all the recommended supplies. This year, they prepared 5000 backpacks. 5000. Backpacks. Full of stuff. Free. And they ran out with a considerable number of kids still left. So they issued vouchers to Walmart for the same items that were being offered at the fair. One $10 backpack, one $5 lunch box, paper, pens, pencils, RoseArt markers and crayons, binders and notebooks. Probably about $70 total. Not a bad deal, especially when you consider most of the recipient families have two or more (many more) kids. Take my next door neighbors, four kids all anchor babies, mom and dad don’t speak English, would have received $280 worth of free school supplies.

Now, I’m extremely charitable, I’ll give the shirt off my back and the last buck in my pocket to someone who really needs it. And I don’t expect drippy gratitude, a “Hey, thanks!” is good enough. But when I give someone something, the last thing I expect is hostility. And that’s just a small fraction of what I witnessed at Walmart this morning.

First, I’ve never seen anything like this in my life. You know how they have the school supplies all together in 4 or 5 very organized aisles? You couldn’t get down them. They were packed with carts pushed by adult women tapping away on iPhones with ghetto nails while their unsupervised young’uns battled it out over the supplies. Grabbing, shoving, pushing, rude, snotty little turds. It looked like a plague of locusts had descended on those aisles and nothing was left but some broken boxes of Crayons and scattered sheets of notebook paper. I’d been there about 5 minutes when three Walmart workers finally showed up to stop the three kids who were opening packages of notebook paper and throwing them at each other. I decided the girls could take their old lunch boxes for the first day, and I’d get new ones Monday in the peace and calm.

Moving away from that section towards the food half of the store, I went by the registers. First, I’ve NEVER seen more than 5 registers open at a time. There were 9 lanes open and devoted to vouchers, 9 to 10 carts deep. And I’m telling you, these carts were overflowing with shit. There were two normal lanes open for non-voucher shoppers and of course the self-checkout lanes. I’ll get back to this in a bit, still trying to process. I made it to the back of the store for a quick pit stop before getting the grocery items and getting the hell out of dodge. Walking into the bathroom was one of the saddest and most disgusting things I’ve ever seen. It was trashed, stank, and there were feminine products and feces clogging all the toilets. There was one woman standing at the sinks, crying, dressed in Salvation Army gear. She wasn’t talking to me, but I could hear her saying, “It wasn’t supposed to be like this, they’re so ugly, it’s just so wrong.” I gave her an apologetic smile and left. Got my groceries in record time, practically no one on that side of the store, and scored two lunch boxes from a lonely little display in the seasonal aisle.

I got in one of the two regular lanes, about 5 or 6 back, and started observing the circus. And that’s all I could think, “Not my monkeys, not my circus.” Let’s go back to the beginning of this post, remember the list of items? $10 backpack and $5 lunchbox? These people were trying to ram through $25-35 backpacks and $10-15 Igloo lunch boxes, tennis shoes, pushup bras and thongs, meat items, and one very belligerent woman had 4 12-packs of Bud Light. “Ma’am, only school items on the list.” “But my chirrins need them for they lunches.” “What?!” “My chirrins, they be needing them for they lunches! Bitch didn’t you hear me?” “Ma’am, beer is not allowed in schools…” “Not these chirrin, my older chirrin! They needs these for they lunches!” “Manager to Register 3…” The Hispanic mamas didn’t speak English and were relying on kids to translate. Try telling an 8-year-old they can’t have the $12 Frozen lunch box because it isn’t on the list. Then the whole RoseArt versus Crayola battle. The kids at the Salvation Army fair got RoseArt, almost half the cost of Crayola, and that’s what the vouchers covered. But the RoseArt supplies were hardly touched and the Crayola was wiped out. At the registers, the fights started over, “My kids don’t want none of that RoseArt shit, are you saying they ain’t good enough for the good stuff? Only white kids get the good stuff?”

I was in line for 45 minutes. I got to see and hear more than I ever wanted. The “shoppers” were rude, angry, smug, and beyond ungracious. They attacked the cashiers, the managers, the poor old guy greeting at the door, and any shopper who didn’t look like them. My fellow non-voucher shoppers were looking grimmer, angrier, and a little sick. I watched one brave/stupid older woman approach a very large woman with six kids hanging off her cart ($420+ of free stuff), and tell her “I know gratitude is beyond you, the least you could do is be polite.” The oldest of the boys, about 12ish, menaced her, got in her face and said, “Fuck you, bitch! You owe us!”, while momma smirked in approval. Two gentleman took her and her cart, hopefully all the way out to her car. I finally got checked out, and like all the non-voucher shoppers before me, exited the store by the doors closest to avoid having to walk the gauntlet. It hadn’t taken long for the voucher shoppers to hone in on us. By the time I left, security guards had been placed in the alleyway between the registers and the little businesses (bank, eyeglasses, customer service,etc.)

So this was probably the first time I truly got a taste of how bad it’s gotten, how far society has slipped, how poisoned the populace has become with entitlements. Some people, out of the goodness of their hearts, tried to do something nice for some people who didn’t appreciate it in the least. Things are rapidly getting worse, but I’m ready.

WHY SAN BERNARDINO IS BANKRUPT

Nothing like spending 99% of your career siting around a firehouse playing cards and eating lobster and steak on the taxpayer, while getting paid $190,000 per year, retiring at 50 years old at full salary, and acting like you deserve it. This is the kind of shit that will not continue. There will be no tears shed when greedy government union drones lose their sweet salaries, benefits and pensions. The unsustainable will not be sustainable.

Via Public Sector Inc.

Firefighter pay shows why San Bernardino is bankrupt

San Bernardino is a poor city about 50 miles east of Los Angeles in the Inland Empire — a place where a $50,000 salary would be typical and where home prices are nowhere near what they are in fancier areas of coastal Southern California. Yet the bankrupt city is trying desperately to unload some of its outlandish contracts with public employees, especially with the firefighters’ union. “San Bernardino, California, said that to exit bankruptcy it must terminate a union contract that pays an average annual salary of $190,000 to each of its top 40 firefighters,” according to an article in Bloomberg. That’s just salary. Firefighters receive the generous “3 percent at 50″ retirement package that allows them to retire with 90 percent of their final years’ pay at age 50. And there are lots of pension-spiking gimmicks and other benefits on top of that.

As the article notes, because of a voter initiative it may not be legal to dump those contracts. And I’ve looked at a city salary schedule, and the salaries are almost unbelievable throughout the city. City officials blame the economic downturn and the popping real-estate bubble for their financial plight. But that’s like saying that a salary cutback is the cause of an individual’s personal bankruptcy — never mind the Maserati in the garage, the trips to Hawaii, the diamond rings and the $200 nightly bottles of wine.

San Bernardino is in a financial fix that other California cities have mostly avoided, but the level of public-employee enrichment there is typical. These cities are run for the benefit of those who work there. Public services are a side matter at best. Two-thirds of the nation’s firefighters do this job for free, as volunteers. In what world is making them millionaires (when you add in their retirement benefits) a sensible idea? As usual, the city’s residents will pay the price in the form of reduced services. In Stockton and Vallejo, where similar salaries are common, residents also got hit with increased taxes. There’s something vulgar about hitting poor residents with higher taxes to pay for the city’s wealthy elite. And I hear no progressive voices complaining.

About Steven Greenhut

Steven Greenhut is the California columnist for U-T San Diego. Greenhut formerly was vice president of journalism at the Franklin Center for Government and Public Integrity, where he managed a team of 35 investigative reporters and editors who covered state capitols across the country. He founded CalWatchdog in 2009, which provided Sacramento-based investigative news coverage and he writes regularly for publications including Reason, Human Events, Bloomberg and City Journal. He is author of the 2009 book, “Plunder! How Public Employee Unions Are Raiding Treasuries, Controlling Our Lives And Bankrupting the Nation” and the 2005 book, “Abuse of Power: How the Government Misuses Eminent Domain.” View all posts by Steven Greenhut

IT’S RELAXING BEING IN THE FREE SHIT ARMY

Hat tip to Boston Bob for pissing me off and ruining my day.

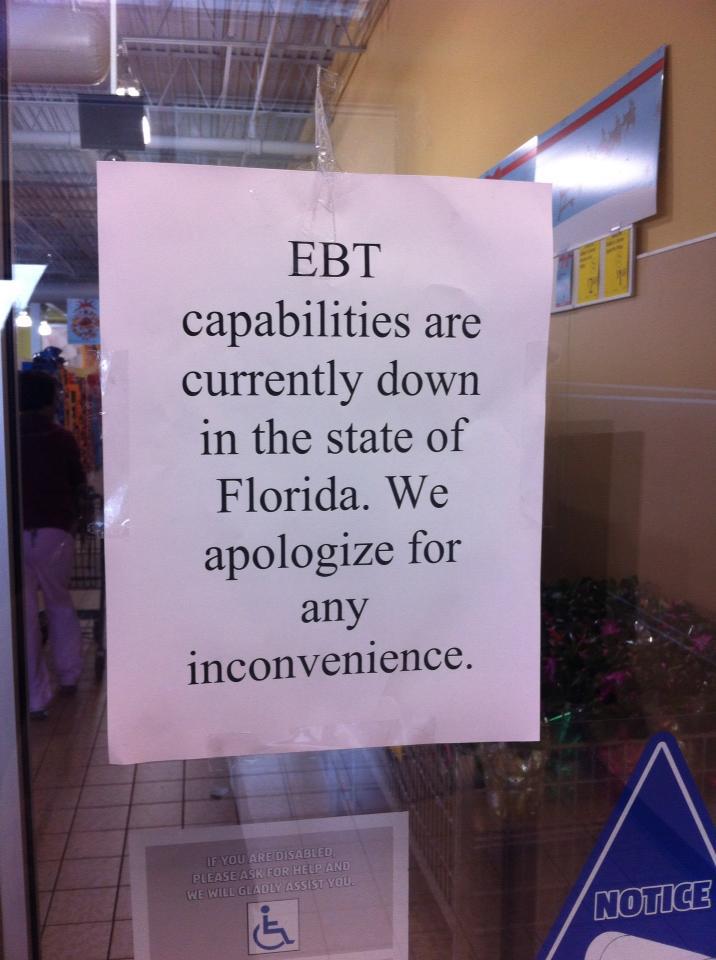
It seems my life would be much more relaxing and leisurely if I had dropped out of high school, managed to not be employed, and joined the legion of 102 million working age Americans who are not working. I’d have more time to sleep and spend quality time doing sports and leisure activities. According to the infuriating article below, the Average American is sleeping 8.6 hours per day, while working a whole 4.1 hours per day. These are averages because 42% of Americans are in free shit army and the 145 million actual working people have a slightly different distribution of their hours. Here’s my average day:

Fitful sleep – 6.5 hours

Working – 9.0 hours

Cursing at assholes during my horrible daily commute – 2.5 hours

Eating while doing something else – 1.0 hour

Reading stuff that pisses me off – 1.0 hour

Writing about stuff that pisses me off – 2.0 hours

Mindless shit like paying bills, mowing lawns, watering plants, grocery shopping, laundry – 1.8 hours

Satisfying Avalon – 0.1 hours

Relaxing time for myself – 0.1 hours

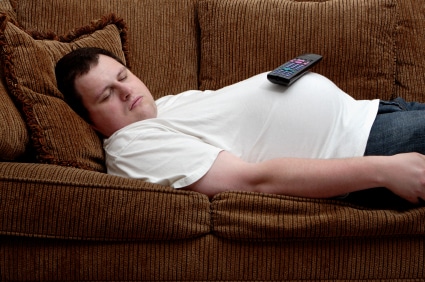
I don’t think I’ve slept for 8.6 hours straight since I was 19 years old. Now I understand why I never see anyone on the streets of West Philly at 7:15 am every morning on my way to work. They are all sleeping off the exhaustion from all that sports and leisure activity. Someone should paint a mural of these people doing what they do best – sleep.

BLS: Americans–on Average–Sleep Twice as Many Hours as They Work

June 18, 2014 – 4:28 PM

(CNSNews.com) – On average, Americans spent about twice as many hours sleeping on weekdays in 2013 as they did working, according to the annual “American Time Use Survey” released today by the Bureau of Labor Statistics. However, the sleeping and working hours were not evenly distributed among the population.

Among Americans who do work on weekdays–which is approximately half the civilian population that is 15 and older–hours of sleep and work are approximately equal.

During the 24 hours in a weekday, according to the survey, the total American civilian population 15 years and over slept, on average, 8.48 hours and worked, on average, 4.01 hours. By that measure, Americans, on average, slept 2.1 times as many hours per weekday as they worked.

But Americans, on average, also spent 0.40 hours per weekday on “work-related” activities, which BLS says “include activities that are not obviously work but are done as part of one’s job, such as having a business lunch or playing golf with clients.”


How Americans--on Average--Spend a Weekday


If the 0.40 hours spent on “work-related” activities is added to the 4.01 hours spent actually “working,” the 8.48 hours that Americans spent, on average, sleeping on weekdays was only 1.9 times as much as the 4.41 hours they spent working and on work-related activities.

Among the civilian population 18 years and over, as reported in Table 8 of the survey, Americans slept, on an annual average in 2013, 8.60 hours per day. These Americans, 18 and over, reported working, on average, 3.82 hours per day, and spending a combined total of 4.20 hours per day on work and work-related activities.

After sleeping and working, the next most-time-consuming weekday activity for Americans 15 or older was watching television. On average, Americans did that for 2.57 hours per weekday.

On weekends and holidays, Americans pulled back the average working hours to 1.14 per day (plus 0.13 hours on “work-related” activities)–and cranked up the television watching to 3.24 hours per day.

When all days during both the work week and weekend were combined, Americans, on average, slept 8.74 hours per day, worked 3.14 hours per day (spent another 0.32 hours on “work-related” activities), and watched 2.77 hours of television.

The overall combined average of 8.74 hour per day of sleep was 2.5 times the 3.46 hours of combined average work and work-related activities.

On weekdays, Americans spent, on average, 0.07 hours per day on religious and spiritual activities. On weekends and holidays, they increased that to 0.31 hours per day.

The BLS survey indicates that the average number of hours the American civilian population 15 and older worked was reduced by the large percentage who did not work.

On weekdays, according to the survey, 50.6 percent participated in work. This 50.6 percent who did work, worked an average of 7.92 hours per weekday and engaged in another 0.54 hours of work-related activities, bringing their combined work and work-related activities to an average of 8.46 per weekday. At the same time, these working Americans slept an average of 8.49 hours. Thus, those who typically worked on weekdays, slept and worked, on average, approximately the same number of hours each day.

On weekends and holidays, 20.7 percent of American civilians 15 and older worked, averaging 5.48 hours per day.

On weekdays, 7.1 percent of Americans 15 and older attended class, averaging 5.16 hours per day in the classroom. A somewhat smaller percentage—6.3 percent–did homework and research, consuming an average of 2.99 hours per day doing so.

Those who were not employed or who were 25 years and older and had dropped out of school before earning a high school degree were the Americans who managed to devote the most time, on average, to what the BLS calls “sports and leisure activities.”


American Who Aren't Employed Spent More Time on Leisure and Sports Activities


“The leisure and sports category includes sports, exercise, and recreation; socializing and communicating; and other leisure activities, says BLS. “Sports, exercise, and recreation activities include participating in–as well as attending or watching–sports, exercise, and recreational activities. Recreational activities are leisure activities that are active in nature, such as yard games like croquet or horseshoes.

“Socializing and communicating includes face-to-face social communication and hosting or attending social functions,” says BLS. “Leisure activities include watching television; reading; relaxing or thinking; playing computer, board, or card games; using a computer or the Internet for personal interest; playing or listening to music; and other activities, such as attending arts, cultural, and entertainment events.”

People who were not employed spent an average of 6.87 hours per day in these activities, according to the survey. That was about 71 percent more than the 4.02 hours that Americans employed full-time could spend on leisure and sports activities.


Dropouts Spend More Time on Leisure and Sports Activities


Among these Americans who were not employed, the “leisure and sports” activity they engaged in least was actually “participating in sports, exercise and recreation.” They dedicated an average of 0.31 hours to this on weekdays and 0.33 hours on weekends and holidays. The “leisure and sports” activity Americans who were not employed engaged in most was “watching TV.” On average, they devoted 3.70 hours to this activity on weekdays and 4.02 on weekends and holidays.

The survey also discovered that the longer someone had spent in school earning academic degrees, the less likely they were to devote time to leisure and sports activities. High school dropouts spent an average of 6.29 hours per day on these activities. That was about 38 percent more than the average of 4.57 hours per day that college graduates spent on leisure and sports activities.

The BLS survey was based on interviews with 11,400 individuals 15 and older conducted by the U.S. Census Bureau during 2013.

WHAT’S $148 BILLION AMONG FRIENDS?

The extreme liberal re-distributors and Keynesian nutjobs probably see this slight oversight by the IRS as beneficial to the economy. The $148 billion of fraudulent payments to the free shit armies in the Democratic run urban ghetto kill zones were pumped into the economy for drugs, KFC, malt liquor, abortions, Cadillac Escallades, iPhones, and Air Jordans. 

I’m sure some Democrat shrew Congresswoman with an IQ of 75 will hold a press conference to declare that every dollar of fraudulent Earned Income Credit leads to $1.60 of economic prosperity. These fraudulent distributions of taxpayer dollars has surely created 1 million jobs.

If these government bozos can fuck up such an easy program, imagine what they can do for your healthcare. I can’t wait to see how it all turns out.

Hat tip Boston Bob.

IRS Paid Out Billions In Tax Credits To Ineligible People

by Caroline May

The Internal Revenue Service issued up to $15.6 billion in tax credits to people who weren’t eligible for them, about a quarter of the total credits they issued of that type, according to a new inspectors general report.

According to the Treasury Inspector General for Tax Administration (TIGTA), in FY 2013 the IRS improperly paid out between $13.3 billion and $15.6 billion worth of EITC, or between 22 to 26 percent of total EITC payments.

Earned Income Tax Credits are benefits available to low to moderate income earners, which can reduce the amount a taxpayer may owe the IRS and may also provide a refund.

The IRS and TIGTA considers an improper ETIC payment to be one that should not have been made, was made in an incorrect amount, or provided to an ineligible recipient.

The level of improper payments has been a perennial problem for the IRS. Since 2003 the percentage of improper payments has not dipped below 21 percent. In that timeframe the IRS has paid out a total of more than $148 billion in improper EITC payments.

Indeed the Office of Management and Budget considers the EITC to be a high-risk program for these types of problems. It is IRS’ only such high-risk revenue program. And this year still, TIGTA concluded that the IRS has not made much progress in reducing improper payments of this kind.

The findings came in a review of the IRS compliance with the Improper Payments Elimination and Recovery Act of 2010 (IPERA), which requires federal agencies to estimate improper payments if they are “significant.”

“The intent of this law is to help ensure that the Government serves as a responsible steward for the tax dollars it collects. As noted in previous TIGTA reports, the IRS can and must do more to protect taxpayer dollars from waste, fraud, and abuse,” J. Russell George, the Treasury Inspector General for Tax Administration, said in a statement.

TIGTA did not make any recommendations in its report, but noted that the IRS has indicated that it is working with the Treasury Department and OMB to develop more ways to come in compliance with the IPERA.

FREE SH*T ARMIES MARCH ON

The Free Shit Armies are storming the castle. They reproduce faster than we can fight them off. You might even be part of the Free Shit Army. If you are receiving money from any of the programs listed below, you are a private in the Free Shit Army.

EBT SYSTEM DOWN – FREE SHIT ARMY GETTING HUNGRY

Nothing like having a dry run for the coming shitstorm. With 50 million free-shitters piling into Wal-Marts across the land stocking up on Cheetos, Twizzlers, Mountain Dew, pork rinds, Slim Jims, ice cream, and cheese whiz on a daily basis, a little computer glitch with the old JP Morgan EBT system threatens to put the obese masses on a forced diet.

There are already reports coming in from across the country about angry free shitters demanding their free shit.

I’m surprised Obama hasn’t already mobilized the military to give out free food in our urban kill zones. I sure hope they get the system operating by Monday morning when I have to venture through West Philly. They might eat my Honda Insight. One week without EBTs functioning and every Democrat controlled shithole in the country would look like this:

Foodstamp Nation In Turmoil: EBT System Goes Dark, “Glitch” Blamed

Tyler Durden's picture

Submitted by Tyler Durden on 10/12/2013 17:03 -0400

In the past five years it has become apparent that America can survive a near-fatal financial system collapse, an economy teetering on the edge and kept ticking only thanks to the Fed’s now perpetual QE, a collapsing standard of living for everyone but the wealthiest 0.1%, declining wages, zero interest rates, surging food, energy, rent, tuition and welfare costs, and pretty much everything else, as long as the welfare state keeps humming along. Any be welfare state we mostly mean providing the daily bread to the nearly 50 million Americans living in poverty and surviving only thanks to the only thing to have exploded to epic record highs under Obama (in addition to the Fed’s balance sheet of course): foodstamp usage. However, the true stability of the US may be tested very soon following reports that due to a “possible computer glitch” the Electronic Benefits Transfer System, aka EBT, ala Foodstamps, is offline. Cue mass panic among the best-weaponized population in the world. Naturally, this latest fiasco involving a country that has grown accustomed to sucking on the government’s teat was immediately blamed on a “glitch” – just like everything else that is slowly but surely breaking in the New Normal.

CBS reports:

Reports from around the country began pouring in around 9 a.m. on Saturday that customers’ EBT cards were not working in stores. The glitch, however, did not appear to be part of the government shutdown. At 2 p.m., an EBT customer service representative told CBS Boston that the system was currently down for a computer system upgrade.


The representative said the glitch is affecting people nationwide. She could not say when officials expected the system to be restored.


People calling the customer service line were being told to call back later.


State officials said they were preparing a statement to further explain the issue.


The federal EBT website was unavailable due to the government shutdown.

AP adds:

People in Ohio, Michigan and several other states found themselves unable to use their food stamp debit cards on Saturday, after a routine check by vendor Xerox Corp. resulted in a system failure. Shoppers from Maine to Oklahoma had to abandon baskets of groceries because they couldn’t access their benefits.


Ohio’s cash and food assistance card payment systems went down at 11 a.m., said Benjamin Johnson, a spokesman for the Ohio Department of Job and Family Services. Ohio’s cash system has been fixed, however its electronic benefits transfer card system is still down. All states that use Xerox systems are affected by the outage.


Xerox spokeswoman Karen Arena confirmed via email Saturday afternoon that some EBT systems are experiencing temporary connectivity issues. She said technical staff is addressing the issue and expects the system to be restored soon.

As a reminder, this is how many Americans and households were on foodstamps as of the most recent monthly update (hint: a record).


And now, it’s time for the sequel to @MrEBT’s hit masterpiece: “My EBT… has been rejected.”


Xerox Statement on Temporary EBT Systems Outage

During a routine test of our back-up systems Saturday morning, Xerox’s Electronic Benefits Transfer (EBT) system experienced a temporary shutdown. While the system is now up and running, beneficiaries in the 17 affected states continue to experience connectivity issues to access their benefits. This disruption impacts EBT beneficiaries who rely on the system for SNAP and WIC. Technical staff is addressing the issue and expect the system to be restored soon. Beneficiaries requiring access to their benefits can work with their local retailers who can activate an emergency voucher system where available. We appreciate our clients’ patience while we work through this outage as quickly as possible.


In short: Cue panic, because while the Nasdaq may be down for 3 hours and only a few vacuum tubes would notice, take down EBT, and you will have a full-fledged revolution in no time.


FREE SH*T ARMY LINES UP FOR FREE SHIT

As I travelled my usual route into work this morning through the badlands of West Philly, I witnessed the usual Thursday morning phenomenon. I usually make my way down 36th Street between 7:00 am and 7:30 am every day. I never get stuck in traffic on this route as no one in this community is rushing off to work in the morning. I rarely see any human beings in Mantua in the morning. Bustling is not a word that describes this section of West Philly. They are snug in their government issued posturepedic beds, in their government subsidized low income luxury townhouses, watching their government subsidized Direct TV, and munching on pork rinds and cheetos bought with their EBT card.

Thursday mornings are different. There is a large non-descript building on the corner of 36th & Haverford Ave. housing the Grace Lutheran Evangelical Church. Below is a partial picture of the building.

On Thursday’s there is a long line of folks with their grocery carts in tow lined up in front of this building. They even bring their own chairs to stake out their position in line. By my estimation they are lined up two hours before they open the doors. It is sort of a Black Friday in Squalorville. This morning there was even a dude in his government subsidized Hoveround in line. Did you know those hoverounds are practically free? I couldn’t help noticing that 80% of the people waiting for the free food were obese. I thought the point of distributing food to poor people was to prevent them from starving. It sure is working, because there were no famished people in that line. 

I’m a big fan of those who are well off, donating food and money to foodbanks to help those less fortunate. But I have a sneaking suspicion that the “free” food being distributed to the fine folks in West Philly has been donated at gunpoint by your tax dollars. The government has taken over deciding how charity should function. It’s almost as if the Savior himself was handing out the food to his people. I wonder if I would get any funny looks if I parked my car, got out and joined the ranks of the Free Shit Army in the line. It would probably make for a humourous post if I lived to tell it.

I wonder how many people would line up if they were distributing brooms, trash bags, paint brushes and hammers and requesting that these people clean up their neighborhood? What a silly question. That’s the government’s responsibility.

The Free Shit Army marches onward to its rendevous with destiny.


Here is a link to google maps. If you click Grace Evangelical Lutheran Church and then go to Street View, you can experience my morning commute firsthand. If you cruise down 36th street, you can see some beautiful murals of black people doing great things. You may see a few $25,000 hovels with a few $60,000 Escalades parked nearby.

http://maps.google.com/maps?um=1&hl=en&q=36th%20%26%20Haverford%20ave%20west%20phila%20grace%20evangelical%20lutheran%20church&bav=on.2,or.r_gc.r_pw.r_qf.&biw=1600&bih=695&wrapid=tlif134514162532911&ie=UTF-8&sa=N&tab=il

You know who will be showing up at the food bank sometime today.

ADMINISTRATOR ENLISTS IN THE FREE SH*T ARMY

I finally finished my tax return today. I’ve done my own taxes for 25 years. I’ve used Turbo Tax for 20 years. I’m able to upload all of my Quicken data directly into Turbo Tax. And still I felt like this guy this morning as I worked on my complicated return.

We have W-2 income, I sold a bunch of stocks and mutual funds, dividends, capital gains, option losses, K-1 for my money losing Wildwood condo, and a Schedule C for this huge money making machine of a website. There are so many pieces of paper to labor through. Turbo Tax asks you questions about passive income, alternative minimum tax, deductions, and credits. I can understand why most people pay someone else to do their taxes.

When it was all said and done, we are getting a refund. My effective tax rate for 2010 was 7%. I have Obama and the Congressional redistributors of wealth to thank for my relatively low tax burden. As I noted back in the Fall, my house is 16 years old and the builder put cheap windows in the house. The seals were breaking on multiple windows allowing moisture in, with some cracking when the temperature would change. I needed to replace my windows. It just so happened that Obama was implementing another useless economic stimulation tax credit with your money in 2010. Anyone who did a home improvement that saved energy could get a $1,500 tax credit. I took advantage of Obama’s generosity with your money today. I got a $1,500 tax credit for my window purchase. I’m now a corporal in the Free Shit Army.

The government already rewards me for having three kids, with exemptions and tax credits. It rewards me for owning a house with deductions for mortgage interest and property taxes. These facts prove how worthless our tax code has become.

I would have bought windows this year whether there was a credit or not. I bought a house in 1995 because I wanted a place to live. The mortgage interest and property tax deductions had no impact on my buying decision. I didn;t decide to have kids because I would get a credit. My marginal rate of 7% on a fairly high level of income seems low. It is low unless you compare me to General Electric.

General Electric made $14.2 billion in 2010. Their effective tax rate was -22.5%. They not only paid no taxes, but received a $3.2 billion tax refund. When middle class working Americans pay more in taxes than one of the biggest corporations in the world, then the system is broken and corrupt. GE spent $200 million in the last decade on lobbying. It looks like they got a nice return on their bribes (investment).

The corporate share of the nation’s tax receipts went from 30% in the 1950s to 6.6% in 2009. Crony capitalism is alive and well. This needs to change before it is too late.

If the politicians in this country could ever do the right thing and put the country ahead of their own interests, we could fix the revenue side of the budget. I would gladly give up my mortgage deduction, property tax deduction and credits for having kids if I knew that the wealthy and corporations were also paying their fair share. Eliminate all deductions, all loopholes, and all credits, for everyone. I’m not tied to a flat tax or fair tax or a particular rate.

As a country we need to decide what we really want. How big of a military are we willing to fund? If we want Medicare, Medicaid, Social Security, SNAP, Unemployment Compensation, Welfare, and an oil based society, then we have to pay for it. The borrowing has to end. If we want something, we have to pay for it. If we want all of the social programs that exist today, then taxes will have to go up dramatically. If we don’t want taxes to go up dramatically, then we need to cut spending across the board.

The fools in Washington DC think they can borrow and spend to infinity. Sadly, they are wrong. I see no chance that the corrupt politicians will change our path. The Free Shit Army (we are all members) will keep marching until it meets its Waterloo.

DISGUSTING CHART OF THE DAY

When you hear some dim bulb on CNBC talking about a recovery in personal income, keep this chart in mind. Over 20% of all personal income is coming from the government, I mean you. You can’t look at this chart and not conclude that we are becoming a socialist country. The Obamanistas are taxing the productive (You and I) and redistributing it to the 49% in West Philly who prefer to not work for a living. We (the middle class) are caught between the Ruling Elite Army on Wall Street and the Free Shit Army in West Philly. We are slowly and methodically being crushed by these two armies.

Is it time to form a Middle Class Army and fight back?