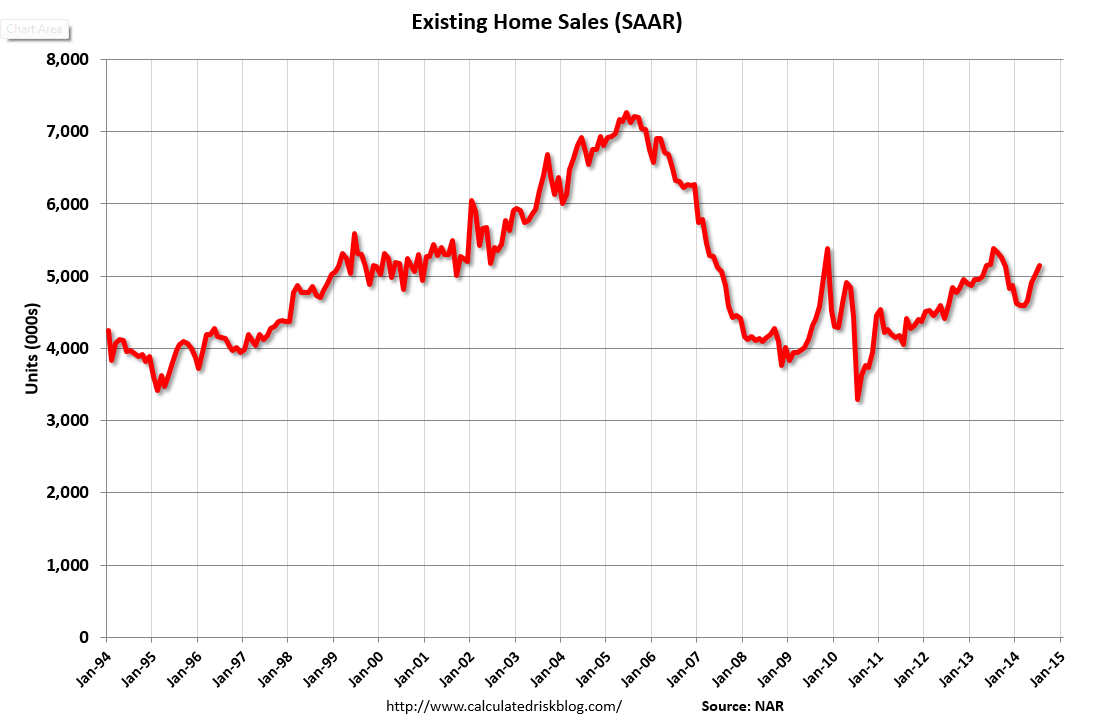
Having exuberantly reached its highest level since September 2013 last month (despite the total collapse in mortgage applications), it appears the ugly reality of the housing market has peeked its head out once again. As prices rose, existing home sales plunged 6.1% – the most since July 2010 (against an expected 1.1% drop) to 4.93mm SAAR (the lowest in 6 months).


So what was it this time: the polar vortex, the crude collapse, the crude vortex? Neither: According to the NAR’s endlessly amusing Larry Yun, this time it was the stock market:
“The stock market swings in October may have impacted some consumers’ psyche and therefore led to fewer November closings. Furthermore, rising home values are causing more investors to retreat from the market.”
Supposedly he is referring to the tumble, not the resulting Bullard “QE4” mega-explosion in stocks that pushed everyhting to new all time highs.
In other words, according to the NAR, even the tiniest downtick in stocks, and the housing market gets it.
Sure enough, it is time to boost confidence in a rigged, manipulated ponzi scheme:
- DROP IN NOVEMBER COULD BE ONE-MONTH ‘ABERRATION,” YUN SAYS
Unless, of course, stocks drop again, in which case all bets are off.
Meanwhile, it appears investors have left the building…

Every part of America saw a collapse:
November existing-home sales in the Northeast declined 4.2 percent to an annual rate of 680,000, but are still 4.6 percent above a year ago. The median price in the Northeast was $246,100, which is 1.3 percent above a year ago.
In the Midwest, existing-home sales fell 8.9 percent to an annual level of 1.13 million in November, and are now 1.7 percent below November 2013. The median price in the Midwest was $160,500, up 7.0 percent from a year ago.
Existing-home sales in the South decreased 3.2 percent to an annual rate of 2.09 million in November, but remain 5.0 percent above November 2013. The median price in the South was $176,500, up 5.2 percent from a year ago.
Existing-home sales in the West dropped 9.6 percent to an annual rate of 1.03 million in November, and remain 1.0 percent below a year ago. The median price in the West was $292,700, which is 3.5 percent above November 2013.
Some more amusing details from the report:
The median existing-home price2 for all housing types in November was $205,300, which is 5.0 percent above November 2013. This marks the 33rd consecutive month of year-over-year price gains.
Total housing inventory3 at the end of November fell 6.7 percent to 2.09 million existing homes available for sale, which represents a 5.1-month supply at the current sales pace – unchanged from last month. Despite the tightening in supply, unsold inventory remains 2.0 percent higher than a year ago, when there were 2.05 million existing homes available for sale.
“Lagging homebuilding activity continues to hamstring overall housing supply and is still too low in relation to this year’s promising job growth,” says Yun. “Much faster price and rent appreciation – easily exceeding wage growth – will occur next year unless new construction picks up measurably.”
All-cash sales were 25 percent of transactions in November, down from 27 percent in October and 32 percent in November of last year.
Individual investors, who account for many cash sales, purchased 15 percent of homes in November, unchanged from last month and below November 2013 (19 percent). Sixty-one percent of investors paid cash in November.
The percent share of first-time buyers in November climbed to 31 percent, up from October (29 percent) and is the highest share since October 2012 (also 31 percent). First-time buyers have represented an average of 29 percent of buyers through November of this year.
Distressed sales – foreclosures and short sales – were unchanged in November from October (9 percent) and remained in the single digits for the fourth month this year; they were 14 percent a year ago. Six percent of November sales were foreclosures and 3 percent were short sales. Foreclosures sold for an average discount of 17 percent below market value in November (15 percent in October), while short sales were discounted 13 percent (10 percent in October).
Properties typically stayed on the market in November longer (65 days) than last month (63 days) and a year ago (56 days). Short sales were on the market the longest at a median of 116 days in November, while foreclosures sold in 65 days and non-distressed homes took 63 days. Thirty-two percent of homes sold in November were on the market for less than a month.
But don’t worry about all that: the NAR couldn’t be happier that just like in the last housing bubble, so too now Fannie and Freddie’s new 3% down payment initiative, means the bubble is about to get bigger than ever:
NAR President Chris Polychron, executive broker with 1st Choice Realty in Hot Springs, Ark., says Fannie Mae and Freddie Mac’s new low downpayment program should improve access to credit for responsible buyers. “NAR applauds Fannie and Freddie’s commitment to homeownership by serving creditworthy borrowers who lack the resources for substantial downpayments plus closing costs with its new downpayment program,” he said. “The new program mitigates risk with strong underwriting and ensures that responsible buyers have access to safe and affordable mortgage credit. Furthermore, NAR believes lenders must do their part to ensure loans are prudently underwritten and are made available to qualified borrowers.”
And since the taxpayers will be left to bail out the excesses of this latest incipient housing bubble, what’s not to like?
But the punchline: the median price of existing homes dropped to $205,300…

… because, well, there is a “lack of supply.”
Nov existing home sales fell 6.1% to 4.93M-the lowest level since last May (4.91M). Lack of supply continues to weigh on the #housing market
yep – that must be it…


 American citizens already have a hard enough time affording a home. Squeezed out by financial oligarchs buying tens of thousands of properties for rental income, and faced with real wages that haven’t budged since the mid-1970s, the demographic of U.S. citizens that historically dominated the new home market has been forced to live in their parents’ basements. Just to kick em’ when they’re down, Americans now face the impossible task of competing with laundered Chinese money.