EPIC FAIL – PART ONE

 “Facts are to the mind what food is to the body.” – Edmund Burke

No wonder one third of Americans are obese. The crap we are shoveling into our bodies is on par with the misinformation, propaganda and lies that are being programmed into our minds by government bureaucrats, corrupt politicians, corporate media gurus, and central banker puppets. Chief Clinton propaganda mouthpiece, James Carville, famously remarked during the 1992 presidential campaign that, “It’s the economy, stupid”. Clinton was able to successfully convince the American voters that George Bush’s handling of the economy caused the 1991 recession. In retrospect, it was revealed the economy had been recovering for months prior to the election. No one could ever accuse the American people of being perceptive, realistic or critical thinking when it comes to economics, math, history or distinguishing between truth or lies. Our government controlled public school system has successfully dumbed down the populace to a level where they enjoy their slavery and prefer conscious ignorance to critical thought.

The next six months leading up to the November elections will surely provide a shining example of the degraded society we’ve become. Both parties and their propaganda machines, SuperPacs, and corporate media sponsors will treat the igadget distracted masses to hundreds of hours of lies, spin, and vitriol, designed to divert the public from the fact that both parties act on behalf of the same masters and have no intention of changing course of the U.S. Titanic to avert the iceberg dead ahead. We will be treated to storylines about race, gun control, the war on women, energy independence, global warming, the war on terror, the imminent threat of Iran and North Korea, Obamacare, Romneycare, and of course the economy, stupid.

There are 240 million voting age Americans. About 130 million will likely vote in the 2012 election based upon recent voter participation results. This means that 110 million Americans don’t give a crap about who runs this country or they’ve come to their senses and realize our votes don’t matter. Between 1840 and 1900 voter participation ranged between 70% and 82% as Americans took their civic duty seriously and believed their vote counted. Since 1913, when the politicians relinquished control of our currency to a private bank controlled by a small group of powerful men, voter participation for President has ranged between 49% and 62%. It hasn’t surpassed 57% since 1968. Now that corporations are people and our candidates are selected by a few rich men, the transformation from a republic to a corporate fascist state is almost complete. During the coming interminable political campaign you will hear about jobs until your ears bleed. I can guarantee that 98% of the rhetoric will be false. Neither party wants the American people to understand the truth about what happened to our economy and jobs over the last 100 years. It has been a bipartisan screw job and ignoring the facts doesn’t change them.

The first fact that can’t be ignored is how many Americans are actually unemployed today. Here is some truth you won’t get from a politician or media talking head:

  • There are 243 million working age Americans.
  • There are 142 million employed Americans.
  • Only 101 million of the employed Americans are working more than 35 hours per week. This means that only 41.6% of all working age Americans have a full-time job.
  • According to the government drones at the BLS, 88 million Americans have “chosen” to not be in the labor force – the highest level in U.S. history.
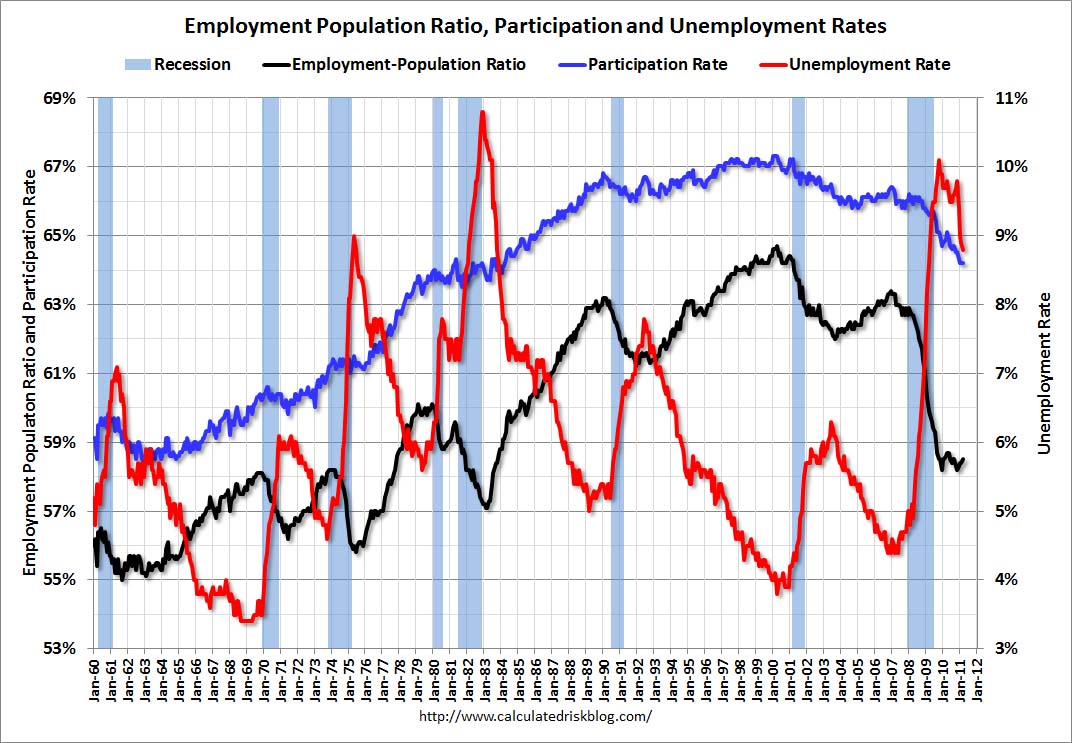
  • The percentage of Americans in the workforce at 63.8% is the lowest since 1980 and down from a peak of 67.1% in 2000. The difference between these two percentages is 8 million Americans.
  • The BLS reports there are only 12.7 million unemployed Americans in the country, down from 15.3 million in 2009.
  • The BLS reports the unemployment rate has dropped from 10% in late 2009 to 8.3% today. Over this time frame the working age population grew by 5.7 million, while the number of employed Americans grew by 3.6 million. Only a government drone could interpret this data and report a dramatic decline in the unemployment rate.


Any critical thinking human being would examine the data being reported as fact by our government and regurgitated without question by the corporate mainstream media and conclude it is false, misleading and manipulated. The economy was booming in 2000 and 67.1% of the working age population were in the labor force. Today the economy is in much worse shape. More people NEED to work in order to just make ends meet, but according to the government, 8 million Americans have chosen to not work. Only an Ivy League economist or CNBC bimbo pundit would believe such a blatant distortion of reality. A comparison to prior decades provides all the evidence you need:

  • In 1980 the working age population was 168 million and the labor force totaled 107 million.
  • By 1990 the working age population grew by 21 million and the labor force grew by 19 million.
  • By 2000 the working age population grew by another 23 million and the labor force advanced by 17 million.
  • Since 2000 the working age population has grown by 30 million, but shockingly the labor force has supposedly grown by only 12 million.


This data is so twisted that there is absolutely no doubt the Federal Government is purposely manipulating the numbers to make the economic situation appear better than the reality. During the Great Depression propaganda and spin had not been perfected. There weren’t multiple definitions of unemployment designed to confuse and mislead the public. The peak level of unemployment in the 1930s was 25%. The current reported level is 8.3%. On a comparable basis to the 1930s, including short-term discouraged workers, those forced to work part-time, and the long-term discouraged workers which were defined out of existence in 1994 by the BLS, the real unemployment rate is 22% today. It feels like a depression for millions of Americans because it is a depression.


The rhetoric from the Obama administration about a jobs recovery is laughable. Full time employment peaked in July 2007 at 122.4 million. Today there are 113.9 million people classified as full-time, with only 101.3 million working more than 35 hours. There are 8.5 million fewer people with full time jobs today than there were in 2007. That fact is even more disheartening considering the working age population has grown by 10.5 million over the same time span. Taking an even longer term view provides the perspective needed to assess our true economic state.  Total nonfarm employment hasn’t grown in twelve years, while the working age population has grown by 30 million people.


Obama will tout the fact that we’ve added 3.6 million jobs since the bottom of this recession. What he won’t tout is that hiring of temporary workers surged by 37% and accounted for 25% of all the jobs added since 2009. I’m sure these temporary workers, with no health or retirement benefits, are confident about their future.  The facts about jobs and employment are consistent with the 47 million Americans on food stamps (up from 35 million when the recession supposedly ended). It’s a sure sign of recovery when spending on food stamps doubles in the last two years. No depression here, just move along.  


Record numbers of Americans being added to the SSDI rolls for depression and other illusory disabilities is surely a positive development pointing to a strong economic recovery. In just the first four months of this year, 539,000 joined the disability rolls and more than 725,000 put in applications. “We see a lot of people applying for disability once their unemployment insurance expires,” said Matthew Rutledge, a research economist at Boston College’s Center for Retirement Research. The number of applications last year was up 24% compared with 2008, Social Security Administration data show. Why participate in the labor market when you can collect a government check for life because you are obese or depressed. These are the people no longer in the labor force. Once they go on SSDI, they rarely go back to work again.   


The government reported figure of 12.7 million unemployed Americans is an utter falsehood. There are in excess of 30 million Americans that are either unemployed or working part-time that want full-time jobs. Government propaganda doesn’t change the facts.

 “Facts don’t cease to exist because they are ignored.” – Aldous Huxley

Would You Like a Side Order of Facts with That Propaganda?

When you watch the Wall Street scam artists paraded on CNBC declaring the number of people not in the labor force is going up due to Baby Boomers retiring, you should understand they are propagating a falsehood. They are either intellectually dishonest or too lazy to do the most basic of research. They are paid millions to impart false storylines to anyone dumb enough to watch CNBC expecting facts or a smattering of truth. If you want some truth, turn to John Mauldin and John Hussman. CNBC doesn’t invite these outstanding honest analysts on their station when they can roll out a shill like Abbey Joseph Cohen or James Paulson. They wouldn’t want some factual analysis when they can have Becky Quick do one of her frequent handjob interviews with that doddering old status quo fool Warren Buffet.

A critical thinker might wonder how could real disposable income be dropping over the last three months and only have risen by 0.3% in the last year if we’ve had the strong job growth touted by Obama. Could it be the jobs being created are extraordinarily low-paying? There are signs of desperation everywhere you look. The two charts below, from one of John Mauldin’s recent articles, reveal the truth about the Baby Boomers retiring storyline. The first chart shows the employment level for those over the age of 55 since 2007. There were 25.3 million people over the age of 55 working in 2007 and there are 30.1 million working today. People over 55 have seen their total employment level rise by 4.8 million jobs since the beginning of the recession, and over 3 million jobs since the 3rd quarter of 2009. Total employment is down by 4 million since 2007, while employment among those over 55 is up 19%. John Hussman described the reality about employment in his recent weekly article:

“If you dig into the payroll data, the picture that emerges is breathtaking. Since the recession “ended” in June 2009, total non-farm payrolls in the U.S. have grown by 2.32 million jobs. However, if we look at workers 55 years of age and over, we find that employment in that group has increased by 3.04 million jobs. In contrast, employment among workers under age 55 has actually contracted by nearly one million jobs, regardless of which survey you use. Even over the past year, the vast majority of job creation has been in the 55-and-over group, while employment has been sluggish for all other workers, and has already turned down.”

I wonder how Larry Kudlow will spin this.


Now for the really eye opening facts. While the labor participation rate has been plunging, the Boomer participation rate has been skyrocketing. The participation rate for the over 65 age group is now at an all-time high. Do you think this has anything to do with home values dropping 36% since 2005, gasoline prices doubling since early 2009, food prices surging by 25%, the 1.4% annual return of stocks since 1999, or the .15% senior citizens can earn on their money today versus the 5% they could earn in 2007?


Intellectually dishonest ultra-liberal Ivy League defender of the Federal Reserve – Paul Krugman had this to say about Ben Bernanke’s zero interest rate policy on senior citizens:

“Finally, how is expansionary monetary policy supposed to hurt the 99 percent? Think of all the people living on fixed incomes, we’re told. But who are these people? I know the picture: retirees living on the interest on their bank account and their fixed pension check — and there are no doubt some people fitting that description. But there aren’t many of them.”

It must be comforting living in an ivory tower or penthouse suite and looking down upon the ignorant masses while caressing your Nobel Prize. The millions of senior citizens with $100,000 of savings could earn $5,000 of interest income in 2007 to supplement their $18,000 of Social Security income. Today, they can earn $150 while the Wall Street banks receive the benefits of ZIRP by borrowing for free from the Federal Reserve and earning billions risk free. Paulie doesn’t think the $4,850 reduction in income and the 15% increase in inflation since 2007 had a negative impact on senior citizens. They must be pouring into the work force because they are just bored, after working for the last 45 years. John Hussman has a slightly different viewpoint, based upon facts rather than a false disproven ideology:    

“Beginning first with Alan Greenspan, and then with Ben Bernanke, the Fed has increasingly pursued policies of suppressing interest rates, even driving real interest rates to negative levels after inflation. Combine this with the bursting of two Fed-enabled (if not Fed-induced) bubbles – one in stocks and one in housing, and the over-55 cohort has suffered an assault on its financial security: a difficult trifecta that includes the loss of interest income, the loss of portfolio value, and the loss of home equity. All of these have combined to provoke a delay in retirement plans and a need for these individuals to re-enter the labor force.

In short, what we’ve observed in the employment figures is not recovery, but desperation. Having starved savers of interest income, and having repeatedly subjected investors to Fed-induced financial bubbles that create volatility without durable returns, the Fed has successfully provoked job growth of the obligatory, low-wage variety. Over the past year, the majority of this growth has been in the 55-and-over cohort, while growth has turned down among other workers. Meanwhile, broad labor force participation continues to fall as discouraged workers leave the labor force entirely, which is the primary reason the unemployment rate has declined. All of this reflects not health, but despair, and helps to explain why real disposable income has grown by only 0.3% over the past year.”

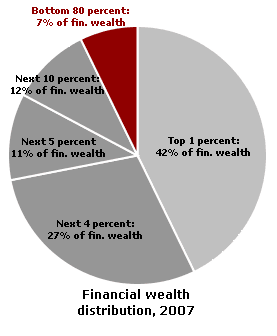
Do you believe Krugman or Hussman? The key takeaway from the data is the desperation exhibited by average Americans, while the political governing elite and Wall Street pigs continue to gorge themselves at the trough of free money provided by the Federal Reserve, while paying themselves obscene bonuses for a job well done buying the corrupt Washington politicians.


Over the next six months we will hear unceasing rhetoric from Obama and Romney about how they are going to create jobs. Neither of these government apparatchiks have a clue about jobs or desire to change the course that was set one hundred years ago with the creation of the Federal Reserve. Obama never worked at a real job in his entire life, while Romney has spent his life firing people and spinning off heavily indebted companies to unsuspecting investors. The current deteriorating jobs picture has been decades in the making and a truly bipartisan effort. The rhetoric about America being an engine of growth and the world leader in innovation and entrepreneurship is laughable when examined with a critical eye. We are an aging empire living in the past as the facts portray an entirely different reality. Our fastest growing industries include:

  • Solar panel manufacturing (subsidized by your tax dollars)
  • For-profit universities (diploma mills subsidized by your tax dollars)
  • Pilates and yoga studios
  • Self-tanning product manufacturing
  • Social network game development
  • Hot sauce production

The “surge” in jobs in the last three months is being driven by these industries:

  • Food services and drinking places
  • Administrative and support services
  • Ambulatory health care services
  • Credit intermediation
  • Hospitals

Is this the picture of a world leading jobs machine or a delusional, paper pushing, self-involved, obese, sickly, overly indebted crumbling empire? The job openings in industries that actually produce something are barely identifiable on the chart below. Maybe the University of Phoenix can successfully retrain construction and manufacturing workers to be waiters, waitresses, and Wal-Mart greeters if the Federal government can funnel more of our tax dollars into student loans.    


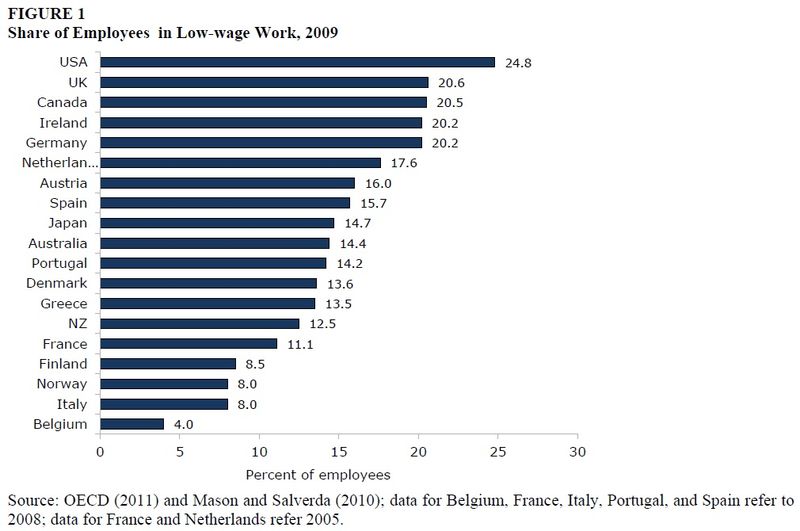
If you thought low wage work was only for Chinese, Indians, and Vietnamese, you haven’t been paying attention. The United States is a world leader. We are by far the world leader among developed countries in percentage of low wage workers at 24.8%. I find it hysterical that the dysfunctional insolvent countries of Greece, Spain, Portugal, and Italy have a much smaller percentage of low wage workers than the great American empire. We have 142 million employed Americans and 35 million are slaving away in low paying thankless jobs. This explains why the half the workers in the country make less than $25,000 per year.  


The top three employment occupations in the country are:

  • Office and administrative support work
  • Sales & Related
  • Food preparation and serving related


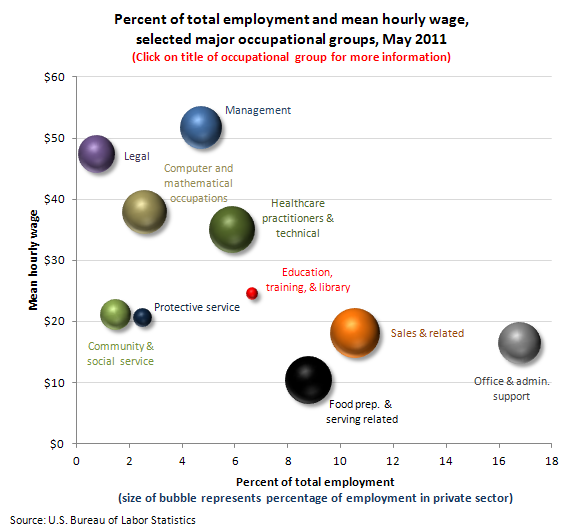
There are high paying good jobs in America, but there aren’t many and on-line college graduates from the University of Phoenix aren’t going to get them. The highest paying jobs today require a high level of specialization and education, especially in the healthcare and technology industries. This disqualifies the vast majority of government run public school graduates. High paying manufacturing jobs which were the backbone of the country during the 1950s and 1960s are gone forever. The reasons for this transformation are multifaceted and will be addressed in Part Two of this article. It didn’t happen by accident and there are culprits to blame. The conversion of our country from making high quality things other countries needed to a debt driven service economy of paper pushers, hash slingers, and retail “specialists” has slowly but surely destroyed the middle class. The masses are distracted by the latest technological marvel that allows them to waste another two hours per day posting how they feel about the latest episode of America’s Got Something or America’s Top Whatever. We have become a country that glories in our materialism and shallow culture while acting like a thug around the world with our unparalleled military machine.  

This result is not an accident. It was set in motion by the actions of a handful of rapacious, wealthy powerful men that have been calling the shots in this country for the last hundred years. It wasn’t a planned conspiracy but the logical result of man-made inflation, a fiat currency not backed by gold, the craving of rich men to become richer, a willfully ignorant populace, and a slow devolution of our society into a corporate fascist state. We praise and honor psychopathic criminals while scorning and ridiculing the middle class workers that built this country. The American dream has become a nightmare for the millions of unemployed and underemployed. The acceleration of debt accumulation and money printing guarantees this rotting carcass of a country will go belly up in the foreseeable future.     

“Thus did a handful of rapacious citizens come to control all that was worth controlling in America. Thus was the savage and stupid and entirely inappropriate and unnecessary and humorless American class system created. Honest, industrious, peaceful citizens were classed as bloodsuckers, if they asked to be paid a living wage. And they saw that praise was reserved henceforth for those who devised means of getting paid enormously for committing crimes against which no laws had been passed. Thus the American dream turned belly up, turned green, bobbed to the scummy surface of cupidity unlimited, filled with gas, went bang in the noonday sun.” – Kurt Vonnegut

In Part Two of this article I will examine how we got to this point and what is likely to happen next.


TAKE THIS JOB AND SHOVE IT

Barack Obama and his minions were out in force on Friday declaring that the 216,000 jobs added in February are proof of a recovering economy. The unemployment rate fell to 8.8%, down from 9.8% in April 2010. All it took was 2.8 million Americans to leave the labor force to achieve this fabulous reduction in the unemployment rate. The percentage of Americans in the labor force of 64.2% is the lowest since 1983. The employment to population ratio of 58.5% is also the lowest since 1983. These atrocious figures are after a supposed economic recovery that has been underway for the last 18 months.

There are now 1.8 million more people employed than at the depths of this Greater Depression. The working age population has grown by 3.2 million people since 2009. Inexplicably, the civilian workforce has actually declined by 736,000 over this same time frame. The government drones at the BLS want us to believe these people voluntarily left the workforce. Obama apologists declare this is because Baby Boomers are leaving the workforce as they retire into the sunset. That is laughable, as all studies show Boomers have not saved enough to retire and will be forced to work into their 70’s.

The manipulation of data in order to spin the economic situation in this country in the best light possible has become so blatant that only the most ignorant could possibly believe it. The corporate mainstream media dutifully reports the propaganda, without ever critically assessing what is being distributed by the government. The percentage of the American working population in the workforce consistently ranged between 66% and 67% from 1998 through 2008. Then, suddenly in 2008, after the economy went in the tank, a couple million Americans found better things to do with their spare time and left the workforce. Anyone with an ounce of brains knows these people gave up and are really unemployed. The percentage of people in the labor force should be 66.5%. Using this 20 year average would add 5.5 million people to the civilian labor force and the unemployment rolls. This exercise in reality gives a real unemployment rate of 12%.

It is interesting that Obama and his top economic propagandist Austin Goolsbee were out in full force on Friday, taking credit for the “tremendous” job gains, but had nothing to say earlier in the week with a much more revealing government report. There is now an all-time high of 44.2 million Americans and 20.7 million households in the food stamp program. This is 14.3% of the American population and 18% of all the households.

I’d like to hear the Administration spin for the SNAP program. Since the supposed end of this economic recession in late 2009, the number of people added to the food stamp rolls has increased by 8 million. The annual cost for this program will reach $70 billion this year, up from $33 billion in 2007. If the economy is recovering and people are voluntarily leaving the workforce, why have the number of people on food stamps increased by 22% since the official start of the recovery? Why does the number of people going on food stamps go up every month? The answer is that there has been no economic recovery for the average American. Wall Street bankers and the ultra-wealthy elite are the only people who have experienced a recovery.

SUPPLEMENTAL NUTRITION ASSISTANCE PROGRAM
( Data as of March 31, 2011)
Fiscal PARTICIPATION BENEFIT AVERAGE MONTHLY BENEFIT
Year Persons Households COSTS Per Person Per Household
FY 2011 43,766,713 20,501,213 23,348,337,586 133.37 284.73
FY 2010 40,301,666 18,618,363 64,704,748,421 133.79 289.61
FY 2009 33,489,975 15,232,115 50,359,917,015 125.31 275.51

The true picture of the American economy is that in 2007 there were 146 million Americans employed, or 63% of the working age population. Today, there are 139.9 million Americans employed, or 58.5% of the working age population. Over this time frame, an additional 7.1 million Americans entered the working age population. In 2007 there were 26.3 million Americans on food stamps, or 8.6% of the US population. Today there are 44.2 million Americans on food stamps, or 14.3% of the US population. To call the current economic disaster a recovery is to practice the art of the Big Lie.

Real Median Household Income, which is calculated using the dodgy government CPI, has not grown in 14 years. Using a true, non-manipulated inflation figure and real median household income is no higher than it was in 1987. The mainstream media reports the headline figures like the good lapdogs they are. The BLS Establishment data going back to 1965 is a treasure trove of interesting data. The average hourly wages have declined for the last three months and are essentially flat in the last year.

real median household income

Decades of Decay

The current state of disarray in the job market did not occur overnight. It took decades of bad choices, willful ignorance and delusion. By charting BLS data over the last five decades, a picture of an empire in decay appears before your very eyes. We aren’t the first empire to experience this decay and won’t be the last. It is only in retrospect that it becomes clear that all empires gravitate from producing and creating to finance, debt and lending. The hubris of great empires leads them to believe they have been chosen by God as a special nation destined for eternal wealth and success. The seventeenth century Spanish empire thought so. The Dutch and their glorious maritime empire thought so. The all-powerful British Empire thought so. Do you hear much about these empires anymore? They all sacrificed productive activities and embraced the glories of a debt based society. Kevin Phillips details these declines in his brilliant book American Theocracy :

“Understandable as this cockiness might be, history teaches a crucial distinction: nations could marshal the necessary debt-defying high wire walks and comebacks during their youth and early middle age, when their industries, exports, capitalizations, and animal spirits were vital and expansive, but they became less resilient in later years. During these periods, as their societies polarized and their arteries clogged with rentier and debt buildups, wars and financial crises stopped being manageable. Of course, clarity about this develops only in retrospect. However, even though war related debt seems to have been part of each fatal endgame, the past leading world economic powers seem to have made another error en route. They did not pay enough attention to establishing or maintaining a vital manufacturing sector, thereby keeping a better international balance and a broader internal income distribution than financialization allowed.”

The chart below paints a clear picture of decay, debt and delusion. In 1961 the population of the United States was 184 million. There were 54 million employed Americans, with 15 million of them manufacturing goods for America and the rest of the world. Today the population of the United States is 310 million. There are 11.7 million people manufacturing goods, mostly weapons for export to our favorite despots. The population has grown by 68%, while manufacturing jobs have declined by 22%. Consumer spending accounted for 62.8% of GDP in 1961. Investments totaled 14.3% of GDP and we ran a trade surplus of $4.9 billion. Today, consumer spending accounts for 71.1% of GDP. Investments total 12.5% of GDP and we are running a $500 billion trade deficit. Over the course of 50 years, we’ve devolved from a production and exporting society into a consuming and borrowing society.


1961 1970 1980 1990 2000 2007 2010 Mar-11
Total Employment 54,106 71,005 90,530 109,487 131,786 137,599 129,819 130,738
Mining 728 677 1,077 765 599 724 705 758
Construction 2,908 3,654 4,454 5,263 6,787 7,630 5,526 5,514
Manufacturing 15,011 17,848 18,733 17,695 17,263 13,879 11,524 11,667
 Total Goods Producing 18,647 22,179 24,264 23,723 24,649 22,233 17,755 17,939
Trade, Transport, Utilities 11,040 14,144 18,413 22,666 26,225 26,630 24,605 24,797
Information 1,693 2,041 2,361 2,688 3,630 3,032 2,711 2,681
Finance 2,590 3,532 5,025 6,614 7,687 8,301 7,630 7,610
Professional & Business Services 3,744 5,267 7,544 10,848 16,666 17,942 16,688 17,075
Education & Health Serv. 3,030 4,577 7,072 10,984 15,109 18,322 19,564 19,875
Leisure & Hospitality 3,468 4,789 6,721 9,288 11,862 13,427 13,020 13,156
Other Services 1,188 1,789 2,755 4,261 5,168 5,494 5,364 5,439
Government 8,706 12,687 16,375 18,415 20,790 22,218 22,482 22,166
   Total Service Producing 35,459 48,826 66,266 85,764 107,137 115,366 112,064 112,799

A perusal of the chart shows the dramatic downturn has really occurred since 1980. Goods producing jobs have declined by 6.3 million in the last 30 years, while service jobs have grown by 46.5 million. Who would want to get their hands dirty on an assembly line when they could shuffle papers, invent CDOs, MBOs, and CDSs, create financial models to destroy the world, bribe rating agencies, file frivolous lawsuits, teach Keynesianism, or use the 60,000 page IRS code to help GE pay no taxes on their $14 billion of income. Alan Greenspan and many other “thought leaders” declared that America could succeed through its ingenuity and creative thought process. The rest of the world could handle the messy business of building things. So goes the hubris of an empire that has peaked. To get a clearer view of the conversion from a productive society to a consumption society, converting the above chart to a percentage basis is useful.

1961 1970 1980 1990 2000 2007 2010 Mar-11
Total Employment 100.0% 100.0% 100.0% 100.0% 100.0% 100.0% 100.0% 100.0%
Mining 1.3% 1.0% 1.2% 0.7% 0.5% 0.5% 0.5% 0.6%
Construction 5.4% 5.1% 4.9% 4.8% 5.2% 5.5% 4.3% 4.2%
Manufacturing 27.7% 25.1% 20.7% 16.2% 13.1% 10.1% 8.9% 8.9%
   Total Goods Producing 34.5% 31.2% 26.8% 21.7% 18.7% 16.2% 13.7% 13.7%
Trade, Transport, Utilities 20.4% 19.9% 20.3% 20.7% 19.9% 19.4% 19.0% 19.0%
Information 3.1% 2.9% 2.6% 2.5% 2.8% 2.2% 2.1% 2.1%
Finance 4.8% 5.0% 5.6% 6.0% 5.8% 6.0% 5.9% 5.8%
Professional & Business Services 6.9% 7.4% 8.3% 9.9% 12.6% 13.0% 12.9% 13.1%
Education & Health Serv. 5.6% 6.4% 7.8% 10.0% 11.5% 13.3% 15.1% 15.2%
Leisure & Hospitality 6.4% 6.7% 7.4% 8.5% 9.0% 9.8% 10.0% 10.1%
Other Services 2.2% 2.5% 3.0% 3.9% 3.9% 4.0% 4.1% 4.2%
Government 16.1% 17.9% 18.1% 16.8% 15.8% 16.1% 17.3% 17.0%
   Total Service Producing 65.5% 68.8% 73.2% 78.3% 81.3% 83.8% 86.3% 86.3%

In 1961 America was a well balanced economic powerhouse. Goods production accounted for 34.5% of all jobs, with manufacturing making up 27.7% of all jobs. Goods production now accounts for a pitiful 13.7% of all jobs in the country. The slack was picked up by financial analysts, accountants, lawyers, tax specialists, and bankers. They surged from supporting roles in a production society with 11.7% of the jobs in 1961 to the dominant big dogs today, with 18.9% of the jobs. The rest of the slack was taken up by teachers, school administrators, nurses, cabana boys and waitresses as they surged from 12% in 1961 to 25.3% of all jobs today. There is one problem with this shift. We have millions more educators, but our school systems churn out millions of functionally illiterate non-critical thinking drones. We have millions more healthcare professionals and are the most obese, unhealthy nation on earth even though we spend more per person than any other country. A country that employs one quarter of their workers in jobs that do not increase the wealth of the country is a country in decline. This shift has also pushed people into lower paying jobs.

1965 1970 1980 1990 2000 2007 2010 Mar-11
Total Private Industry $2.63 $3.40 $6.85 $10.20 $14.02 $17.43 $19.07 $19.30
Mining $2.87 $3.77 $8.97 $13.40 $16.55 $20.97 $23.83 $24.68
Construction $3.23 $4.74 $9.37 $13.42 $17.48 $20.95 $23.22 $23.36
Manufacturing $2.49 $3.23 $7.15 $10.78 $13.55 $17.26 $18.61 $18.90
   Total Goods Producing $2.63 $3.52 $7.66 $11.46 $15.27 $18.67 $20.28 $20.48
Trade, Transport, Utilities $2.94 $3.65 $7.04 $9.83 $13.31 $15.78 $16.83 $16.99
Information $4.47 $5.25 $9.47 $13.40 $19.07 $23.96 $25.86 $25.99
Finance $2.38 $3.07 $5.82 $9.99 $14.98 $19.64 $21.49 $21.63
Professional & Business Serv. $3.28 $4.04 $7.22 $11.14 $15.52 $20.15 $22.78 $23.10
Education & Health Services $2.12 $2.88 $5.93 $10.00 $13.95 $18.11 $20.12 $20.45
Leisure & Hospitality $1.17 $1.82 $3.98 $6.02 $8.32 $10.41 $11.31 $11.38
Other Services $1.25 $2.01 $5.05 $9.08 $12.73 $15.42 $17.08 $17.23
   Total Service Producing $2.63 $3.34 $6.43 $9.72 $13.62 $17.11 $18.81 $19.05
Consumer Price Index 31.50 38.80 82.40 130.70 172.20 207.34 218.06 221.31

The insidious effects of Federal Reserve generated inflation can be seen in the above chart. The BLS Establishment data going back to 1965 reveals much about the hidden impact of inflation over time. In 1965 the average hourly wage was $2.65. Back then, Americans put in a full work week, averaging 38.6 hours per week. The average American was making $101.52 per week. This was enough for a family to live comfortably on with only one spouse working. Fast forward to today and we have an average wage of $19.30 per hour and work week of 33.4 hours. This yields an average weekly pay of $644.62. It is also necessary for most households to have two working spouses to make ends meet. I added the government reported CPI at the bottom of the chart to provide some perspective on our 50 years of middle class wage compression. Applying the change in CPI since 1965 to the change in average weekly earnings provides the clearest view of what has been done to our country by the Federal Reserve and the government/corporate oligarchy. It would have taken weekly wages of $713.25 to have kept up with inflation since 1965. The average worker today is making 10% less than they did in 1965, on an inflation adjusted basis.

Wages in the service industries fell behind by even more, with the exception of bankers, doctors and teachers. The finance sector wages and the healthcare/education sector wages are 25% higher than their inflation adjusted wages in 1965. You reap what you sow. The country has decided that bankers, doctors, and teachers are relatively more important to our economy than people who make products, create wealth, and increase the productive capacity of the country. Any impartial outcome based assessment of these choices would conclude these choices have been an unmitigated failure.

The financial/ banking sector has peddled debt to the masses that didn’t realize their standard of living has been declining for 50 years, and blew up the worldwide financial system through their greed and fraudulent business practices. We spend more per child on education than any country in the world and test scores are lower than they were 40 years ago. Our children graduate high school with no critical thinking skills and the inability to decipher propaganda from truth. We spend more per person on healthcare than any other country, but obesity, diabetes, and heart disease are rampant. Administrative bureaucracy and vast amounts of rules and regulations consume billions in these sectors of our economy. The simple art of creating and producing things that other people need or want has been cast aside by a country who thought they could borrow and spend their way to long-term prosperity.

So, here we find ourselves 18 months into a “recovery” and the country has added 1.3 million jobs in the last year. We’ve added 529,000 lawyers, accountants, consultants and tax specialists. We’ve added 420,000 teachers, nurses and administrators. We’ve added 193,000 waitresses and hotel busboys. And we’ve added 238,000 Wal-Mart clerks. Our well balanced economy is back in gear. What could go wrong?

The truth is that the country remains in a 50 year death spiral of bad choices, delusion and fraud, created to benefit the few at the expense of the many. The average American wallows in a reality of low wages and high debt. Some of this reality has been self inflicted. Willful ignorance is a choice. Educating yourself to the truth is available to every American. Spending less than you make is something everyone can do. But, at the end of the day, the 1% at the top of the food chain controls the levers in this country. While the average American has fallen behind over the last 50 years, the ultra-wealthy elite have prospered.   The top 1% takes home 25% of the national income and control 40% of the financial wealth in the country. Their lives have improved considerably. Twenty-five years ago, the ruling elite “earned” 12% of the national income and controlled 33% of the financial wealth. These are the people who control the message. They own the mainstream media. They run the Wall Street banks. They control the Federal Reserve. They write the laws and the tax code. They control the politicians like puppets on a string. An economic system based upon debt and Federal Reserve generated inflation benefits these chosen few, while destroying the middle class of America. We’ve chosen this path and are destined to experience the same fate as Spain, the Dutch, and Britain.

DUDE, WHERE’S MY JOB? (Featured Article)

The storyline being sold to the American public by the White House and the corporate mainstream media is that the economy is growing, jobs are being created, corporations are generating record profits, consumers are spending and all will be well in 2011. The 2% payroll tax cut, stolen from future generations to be spent in 2011, will jumpstart a sound economic recovery. Joseph Goebbels would be proud.

It was another wise old man named Ben Franklin who captured the essence of what those in control are peddling:

“Half a truth is often a great lie.”

The economy is growing due to unprecedented deficit spending by the government, fraudulent accounting by the Wall Street banks, the Federal Reserve buying $1.5 trillion of toxic mortgage “assets” from their Wall Street owners, various home buyer and auto tax credits and gimmick programs, and Fannie, Freddie, and the FHA accumulating taxpayer loses so morons can continue to purchase houses. Jobs are being created. According to the BLS, we’ve added 951,000 jobs since December 2009, an average of 79,000 per month. Of course, the population of the US is growing at 175,000 per month. It seems that there are millions of jobs being created, just not here as shown on these graphs from the NYT.

The storyline of corporate profits is true. As a percentage of national income, corporate profits are 9.5%. They have only topped 9% twice in history – in 2006 and 1929. When you see the paid Wall Street shills parade on CNBC every day proclaiming the huge corporate profit growth ahead, keep these data points in mind. Do profits generally rise dramatically from all time peaks?

You might ask yourself, if corporations are doing so well how come real unemployment exceeds 20%? The answer lies in who is generating the profits and how they are doing it. It seems that the fantastic profits are not being generated by domestic non-financial companies employing middle class Americans producing goods. Pre-tax domestic nonfinancial corporate profits are not close to record levels as a share of national income. They exceeded 15% of national income once in the late 1940s, and repeatedly topped 12% in the 1950s and 1960s; in the third quarter of this year, they were 7.03% of national income. I wonder who is making the profits.

According to BEA data, financial industry profits and “rest of world” profits — that is, the money U.S.-based corporations make overseas — are relatively much higher now than they were in the 1950s or 1960s. And the taxes paid by corporations are much lower now than they were then, as a share of national income. The reason that corporate profits are near their all-time highs is that Wall Street corporations and mega multinational corporations are making gobs of loot and paying less of it out in taxes. Isn’t that delightful for the CEOs and top executives of these companies?

The profits are being generated on Wall Street through collusion with the Federal Reserve, as the insolvent Wall Street banks accept free money from the Federal Reserve to generate speculative profits at the expense of senior citizens earning .20% on their CDs. The mega-multinationals are “earning” their profits by continuing to ship American jobs overseas at a record pace. The Economic Policy Institute, a Washington think tank, says American companies have created 1.4 million jobs overseas this year. The additional 1.4 million jobs would have lowered the U.S. unemployment rate to 8.9 percent, says Robert Scott, the institute’s senior international economist. “There’s a huge difference between what is good for American companies versus what is good for the American economy,” says Scott. The hollowing out of the American economy has been going on for decades and despite the usual rhetoric out of Washington DC, it continues unabated today.

But consumer spending has surged, so the recovery must be solid and self-sustaining say the brainless twits on CNBC. Consumer spending is rising because the top 1% wealthiest Americans are doing splendidly as they are now reaping 20% of the income in the country, levels last seen in 1929. The Haves have more, the Have Nots have less. The top 10% wealthiest Americans own 98.5% of all the stocks in the country. They feel richer because Ben Bernanke has propped up the stock market with trillions of borrowed money from future generations. The other 90% of Americans have stagnant or non-existent wages, rising costs for fuel and food, falling home prices, rising debt levels and little hope for the future. They have been thrown a bone of extended unemployment bennies, a temporary payroll tax cut, and extended tax cuts. Any spending they are doing is on credit cards as the austerity deleveraging storyline is another big lie by the MSM.

Greater Depression

The figure of 15 million unemployed reported by the government and regurgitated by the corporate media is one of the biggest lies in the history of lies. The real figure is 30 million and I will prove it using the government’s own data. I created the chart below from BLS data (ftp://ftp.bls.gov/pub/suppl/empsit.ceseeb1.txt) to prove that we are in the midst of a Greater Depression and no amount of spin by politicians and the media can wish it away. When we look at jobs in America across the decades, a picture of a country in decline, captured by financial elites, reveals itself. In 1970, America still produced goods, ran trade surpluses, and paid wages that allowed families to thrive with only one parent working. Only 34.6% of the population was employed, with a third of these workers producing goods.

(Millions Employed) 1970 1980 1990 2000 2007 Dec-09 Nov-10
Mining & Logging 677 1,077 765 599 724 676 763
Construction 3,654 4,454 5,263 6,787 7,630 5,696 5,615
Manufacturing 17,848 18,733 17,695 17,263 13,879 11,534 11,648
Trade, Transport. & Utilities 14,144 18,413 22,666 26,225 26,630 24,653 24,806
Information 2,041 2,361 2,688 3,630 3,032 2,748 2,717
Financial Activities 3,532 5,025 6,614 7,687 8,301 7,657 7,573
Professional & Business Serv. 5,267 7,544 10,848 16,666 17,942 16,488 16,861
Education & Health Services 4,577 7,072 10,984 15,109 18,322 19,350 19,719
Leisure & Hospitality 4,789 6,721 9,288 11,862 13,427 12,991 13,174
Other Serices 1,789 2,755 4,261 5,168 5,494 5,314 5,402
Government 12,687 16,375 18,415 20,790 22,218 22,481 22,261
TOTAL EMPLOYED 71,005 90,530 109,487 131,786 137,599 129,588 130,539
US Population 205,052 227,225 249,439 281,422 299,398 308,200 310,300
% of US Population Employed 34.6% 39.8% 43.9% 46.8% 46.0% 42.0% 42.1%
Source: BLS Establishment Data


Whether it was due to the woman’s movement of the 1970s or due to financial necessity, the percentage of the population employed grew relentlessly until it reached 46.8% in the year 2000. The level of 46.8% meant that when the opportunity to be employed was available, this percentage of Americans wanted a job. Since 2000 the population of the U.S. has grown by 28.9 million people. The labor force between the ages of 18 and 64 has grown by 26.1 million people since 2000. The government insists that millions of Americans have chosen to “leave the workforce” and should not be considered unemployed. This is laughable. Why would people choose to leave the workforce when wages are stagnant, retirement looms, prices relentlessly rise, and they are drowning in debt? The truth is that at least 46.8% of the population wants to be employed. That means that 145.2 million Americans would be working if they had the chance. Only 130.5 million are currently employed. This means that there are really 30 million Americans unemployed versus the 15 million reported by the government and MSM.

Not only is the country short 30 million jobs, but the type of jobs reveal a country of paper pushers, consultants, temp workers, government drones, waitresses, and clerks. The chart below shows the distribution of jobs through the decades.

(% of Employed) 1970 1980 1990 2000 2007 Dec-09 Nov-10
Mining & Logging 1.0% 1.2% 0.7% 0.5% 0.5% 0.5% 0.6%
Construction 5.1% 4.9% 4.8% 5.2% 5.5% 4.4% 4.3%
Manufacturing 25.1% 20.7% 16.2% 13.1% 10.1% 8.9% 8.9%
Trade, Transport. & Utilities 19.9% 20.3% 20.7% 19.9% 19.4% 19.0% 19.0%
Information 2.9% 2.6% 2.5% 2.8% 2.2% 2.1% 2.1%
Financial Activities 5.0% 5.6% 6.0% 5.8% 6.0% 5.9% 5.8%
Professional & Business Serv. 7.4% 8.3% 9.9% 12.6% 13.0% 12.7% 12.9%
Education & Health Services 6.4% 7.8% 10.0% 11.5% 13.3% 14.9% 15.1%
Leisure & Hospitality 6.7% 7.4% 8.5% 9.0% 9.8% 10.0% 10.1%
Other Serices 2.5% 3.0% 3.9% 3.9% 4.0% 4.1% 4.1%
Government 17.9% 18.1% 16.8% 15.8% 16.1% 17.3% 17.1%
TOTAL EMPLOYED 100.0% 100.0% 100.0% 100.0% 100.0% 100.0% 100.0%
 Source: BLS


In 1970, jobs in the goods producing industries made up 31.2% of all jobs. Today, they account for 13.8% of all jobs. The apologists will proclaim that corporate America just got phenomenally more efficient and productive. That is another falsehood. In 1970, we were a net exporter, consumer expenditures accounted for 62.4% of GDP, and private investment accounted for 14.7% of GDP. Today, we consistently run $500 billion to $700 billion annual trade deficits, consumer expenditures account for 71% of GDP, and private fixed investment is a pitiful 11.5% of GDP. We’ve degenerated from a productive goods producing society to a consumption based, debt fueled society. This is a classic late stage trait of declining empires. Rome and Britain before us experienced similar declines.

The most damning facts that can be garnered from the BLS data relate to how we’ve become a nation of bankers, real estate agents, accountants, lawyers, tax specialists, and fast food fry cooks. Manufacturing jobs have dropped from 25% of all jobs in 1970 to less than 9% today. Jobs in the spreadsheet generating, credit default swap creating, subprime mortgage pushing, frivolous lawsuit filing, tax evasion sector of the economy went from 12% in 1970 to 19% today.

The misinformation and lies will continue. The MSM keeps repeating that jobs are coming back. You don’t hear which jobs. Hysterically, the four fastest growing job categories according to the BLS are:

  1. Administrative and support services
  2. Food services and drinking places
  3. Couriers and messengers
  4. Performing arts and spectator sports

The well paying goods producing jobs are never coming back. American manufacturing jobs have been shifted overseas for more than two decades by corporate America. Now those jobs have become more sophisticated, like semiconductors, software and even medical and finance.  The American middle class is relegated to being McDonalds fry cooks, Wal-Mart greeters, and temp workers. What has happened to the American middle class was not an accident. The wealth of the country has been pillaged by an elite group at the very top of the economic food chain, who were able to reap the rewards of globalization (outsourcing American jobs), manipulate the debt based financial system through synthetic fraud products, and avoid taxes by hiring thousands of lawyers, accountants and tax consultants. When you hear that the rich need lower taxes, corporate taxes are too high and increased productivity is great for America, remember what they have done to the country since 1970. If corporate America and its leaders continue to reap obscene profits while the middle class falls further into the abyss, societal unrest will beckon.