

The madness of the Fed’s pending 81 month run of zero interest rates comes down to an inflation subterfuge that has no logical or empirical grounding in real world economics. Essentially, the Keynesians who currently inhabit the Eccles Building have turned all of central banking’s anti-inflation history on its head, saying, instead, that there is not enough of it to create optimum economic growth and wealth; and, besides, the CPI is running below the 2% target—so prolonging the free money gravy train can’t do much harm.
Every part of that proposition is dead wrong. To wit, free money does immense harm by fueling rampant carry trade speculation; there is zero evidence that 2% inflation results in any more growth than 1% or even 0% inflation; and, as an empirical matter, there is plenty of inflation in the US economy and has been during the entire past 15 years of rampant money printing designed to stimulate more growth.
Still, real final sales in the US economy have grown at only a 1.8% rate since the year 2000, or by just half of the 3.5% rate recorded for the prior 46 years. But that downshift is not in any way attributable to inflation missing the allegedly optimum 2% target. In fact, during the last 15 years the CPI has increased at an average rate of exactly 2.18%.
So where’s the beef or rather the allegedly missing beef? Well, the monetary high priests hold that the PCE deflator, not the CPI, is the correct measure of inflation because it takes better account of changing consumer preferences or weighting shifts in the market basket of what people buy. That is, it captures their shifting to chicken, tuna or spam when they can’t afford steak.
Yet its hard to believe that the scant daylight shown in the chart below accounts for the drastic deterioration of economic growth during the last 15 years. In other words, we have had 2% inflation on the most commonly used measuring stick—-so what’s wrong with the ruler?
After all, even the Fed’s own preferred inflation ruler has clocked in at 1.84% per year since the year 2000. Presumably no adult would argue that a shortfall of 16bps per year from the magic 2.0% target would account for the 50% plunge in real economic growth during the last decade and one-half.
![]()
And this gets us to today’s report on the April CPI. Normally, Fed heads prefer the PCE deflator less food and energy on the grounds that the later elements are too volatile to properly measure the actual inflation trend. Alrighty then. The April index for people who prefer to starve and shiver in the dark came in at a 3.6% rate for the month and was 1.8% higher than last April.
Unless you are some kind of monetary monk counting bps of inflation on the head of a pin, therefore, you might say “mission accomplished”. Inflation is running close enough to the magic 2.0% threshold for government work.
But you would be wrong. Yellen issued another cloud of pettifoggery today and practically said that money market interest rates will be pinned to the zero bound for at least another three months. Worse still, our befuddled school marm said that the Fed’s monumental money printing campaign is working just swell, and that after the Q1 weather aberration, the US economy will reaccelerate along the Fed’s intended path toward full employment.
How was she so sure? Why, real consumer incomes have made a significant upward move in recent months, meaning, apparently, that households will be spending themselves silly any day now.
Say again. Did she say that after six years of stagnation, real wages have actually started growing again?
Well, yes they have if you deflate nominal wages by the year-over-year change in the CPI. Thus, during the year ending in April average weekly wages rose from $840 to $858, whereas the CPI came in at zero on a year over year basis.
So go knock yourself out with that $18 gain, said Yellen. Your paycheck is up by 2.1% in something called “real dollars”( if you can find a place that takes them).
Then again, last April the price of oil was $115 per barrel versus its $60 level today. And since that thundering collapse in the global oil patch accounts for all of the CPI deceleration from the prior year gain of 1.9%, the implication of the real wage pick-up theory is clear. Namely, that this will keep happening year after year—–so we get $30 oil by year-end 2015 and $15 oil in 2016!
Here’s the point. The Fed is always trumpeting the PCE deflator less food and energy when they want to chastise the gold bugs and hard money advocates and prove that massive money printing has not caused a worrisome flare-up of inflation. Except now that their entire post-crisis money printing spree is being called into question by an economy that is visibly faltering, they have opportunistically seized on the real wage theme by using a CPI based calculation of real wages—–even though the 0% reading is truly a transient consequence of the oil bust and will disappear from the numbers in a matter of months.
In fact, they have been favoring the PCE deflator less food and energy for most of this century because it conveniently clocked in at a slightly lower rate than the full PCE deflator. But since now that it is no longer convenient, it is apparently being chucked overboard.
Even then, however, the difference is so small over time as to reveal an important truth. These folks are just playing stupid numbers games to justify a policy of massive intervention in the financial markets that makes them rulers of the economic universe. Can any rational person believe that there is any difference over a 15 year period between the PCE deflator at 1.96% per annum and the PCE deflator less food and energy at 1.72% per annum.
It’s all noise and rounding errors, as shown below. There is absolutely nothing in the inflation data that justifies the Fed’s virtual destruction of price discovery in the financial markets, and the massive fraud it has introduced into the American economy by purchasing $3.6 billion of government debt over the past 7 years with credits conjured out of nothing.
Indeed, this morning’s 1.8% year over-year gain in the CPI less food and energy was an inflection point. It’s virtually identical to the inflation rate that foodless and heatless households have experienced over the last 15 years; and it’s so close to 2.0% as to invalidate the Fed’s entire inflation targeting policy regime.
![]()
The truth is, there has been plenty of inflation during the current century, as Doug Short vivified in the charts below. Indeed, on all the basics that consume most of the weekly pay- or benefit-check for upwards of 80% of American households there has been inflation aplenty. Food and beverage prices, for example, have risen at a 2.7% annual rate since the year 2000.
Likewise, medical care costs have risen at a 3.8% annual rate; housing costs at a 2.5% annual rate; and heavens forbid if you had to absorb college tuition and fees: They have by rising at a 6.0% annual rate.

Indeed, the whole chart is a rebuke to the money printers. When stuff goes up by 40% or better during the course of a decade and one-half, it suggest that too little inflation is most definitely not the problem.
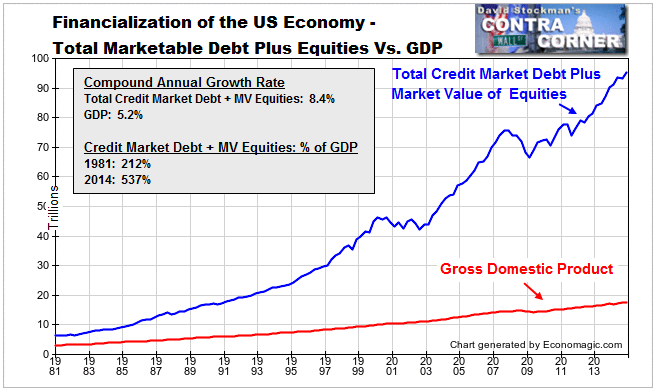
What is the problem is massive financial inflation. The value of corporate equities (at market) and total debt outstanding in the US economy has exploded from $7 trillion to $92 trillion since 1981. And that’s not because it morning again in America. Growth has stalled to a 1.1% rate since 2007, and real household income is barely at levels first achieved in 1989.
![]()
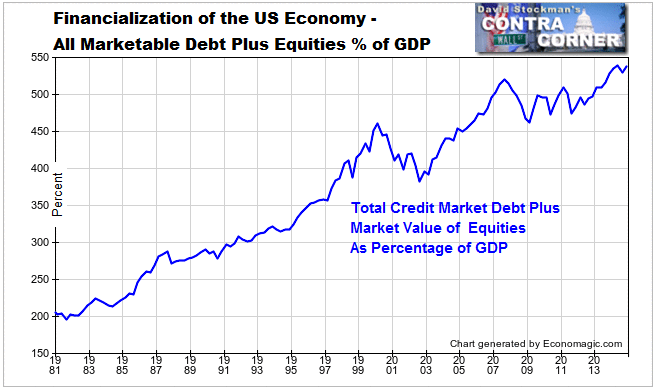
No, the financial economy has ballooned from 2X national income (its historic level) in 1981 to 5X today for one reason alone: Namely, owing to the massive borrowing spree and asset inflation generated by the Fed’s destruction of honest price discovery and discipline in the nation’s financial markets.
Stated differently, the $92 trillion number for equities and credit market debt shown below would be about $35 trillion under the traditional monetary regime that had supported steady growth of the US economy and household real incomes for nearly a century prior to 1971.
The US economy is thus imperiled by a $50-60 trillion financial bubble. Yet the Keynesian Klowns who inhabit the Eccles Building are still counting inflation bps on the head of a monetary pin.


Interesting stuff, david. i’m starting to suspect something else is going on as well. By ‘printing gold’ (no delivery), they have managed to contain broad hyperinflation despite counterfeiting trillions. But since that money is do concentrated, hyperinflation is occurring right before our eyes on the high end.
Certain real estate for instance, NY, san fran, miami beach. Art, look at what’s happening with Warhol, never mind picasso. Laferraris are worth more than double the 1.7 million dollar sticker on delivery. I don’t think this is the same as a bubble. It’s old scool too much monry chasing too few (precious) goods
And too many memorial day cocktails to edit