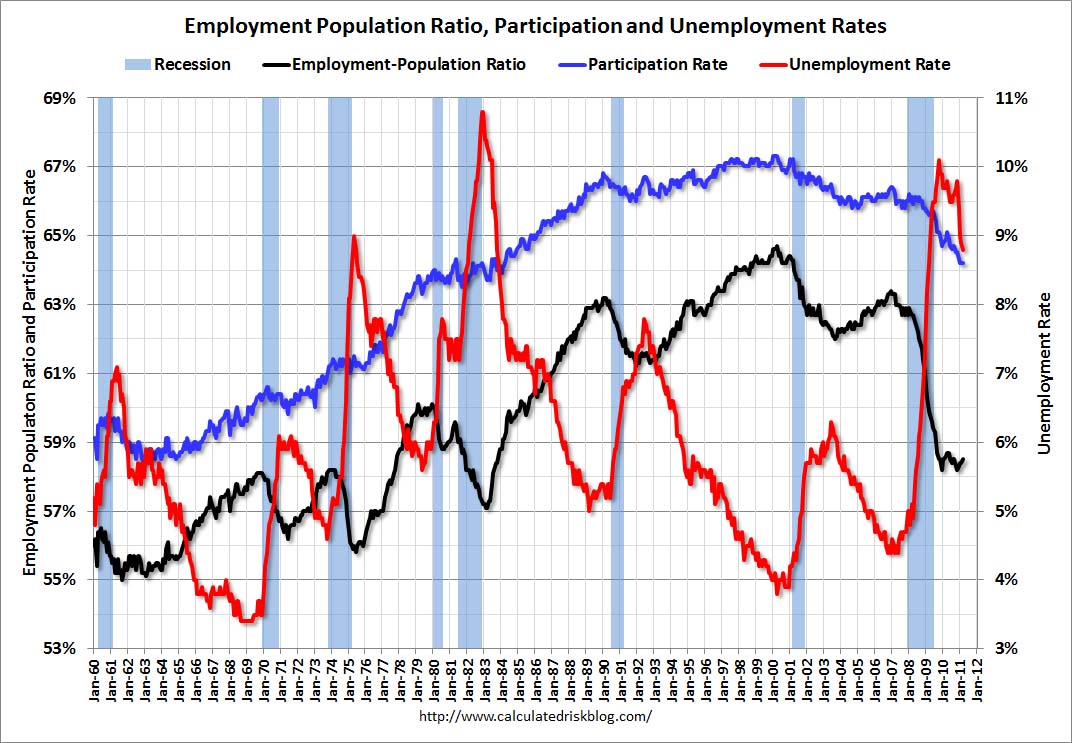
Barack Obama and his minions were out in force on Friday declaring that the 216,000 jobs added in February are proof of a recovering economy. The unemployment rate fell to 8.8%, down from 9.8% in April 2010. All it took was 2.8 million Americans to leave the labor force to achieve this fabulous reduction in the unemployment rate. The percentage of Americans in the labor force of 64.2% is the lowest since 1983. The employment to population ratio of 58.5% is also the lowest since 1983. These atrocious figures are after a supposed economic recovery that has been underway for the last 18 months.
There are now 1.8 million more people employed than at the depths of this Greater Depression. The working age population has grown by 3.2 million people since 2009. Inexplicably, the civilian workforce has actually declined by 736,000 over this same time frame. The government drones at the BLS want us to believe these people voluntarily left the workforce. Obama apologists declare this is because Baby Boomers are leaving the workforce as they retire into the sunset. That is laughable, as all studies show Boomers have not saved enough to retire and will be forced to work into their 70’s.
The manipulation of data in order to spin the economic situation in this country in the best light possible has become so blatant that only the most ignorant could possibly believe it. The corporate mainstream media dutifully reports the propaganda, without ever critically assessing what is being distributed by the government. The percentage of the American working population in the workforce consistently ranged between 66% and 67% from 1998 through 2008. Then, suddenly in 2008, after the economy went in the tank, a couple million Americans found better things to do with their spare time and left the workforce. Anyone with an ounce of brains knows these people gave up and are really unemployed. The percentage of people in the labor force should be 66.5%. Using this 20 year average would add 5.5 million people to the civilian labor force and the unemployment rolls. This exercise in reality gives a real unemployment rate of 12%.
It is interesting that Obama and his top economic propagandist Austin Goolsbee were out in full force on Friday, taking credit for the “tremendous” job gains, but had nothing to say earlier in the week with a much more revealing government report. There is now an all-time high of 44.2 million Americans and 20.7 million households in the food stamp program. This is 14.3% of the American population and 18% of all the households.

I’d like to hear the Administration spin for the SNAP program. Since the supposed end of this economic recession in late 2009, the number of people added to the food stamp rolls has increased by 8 million. The annual cost for this program will reach $70 billion this year, up from $33 billion in 2007. If the economy is recovering and people are voluntarily leaving the workforce, why have the number of people on food stamps increased by 22% since the official start of the recovery? Why does the number of people going on food stamps go up every month? The answer is that there has been no economic recovery for the average American. Wall Street bankers and the ultra-wealthy elite are the only people who have experienced a recovery.
| SUPPLEMENTAL NUTRITION ASSISTANCE PROGRAM |
| ( Data as of March 31, 2011) |
| Fiscal |
PARTICIPATION |
BENEFIT |
AVERAGE MONTHLY BENEFIT |
| Year |
Persons |
Households |
COSTS |
Per Person |
Per Household |
|
| FY 2011 |
43,766,713 |
20,501,213 |
23,348,337,586 |
133.37 |
284.73 |
| FY 2010 |
40,301,666 |
18,618,363 |
64,704,748,421 |
133.79 |
289.61 |
| FY 2009 |
33,489,975 |
15,232,115 |
50,359,917,015 |
125.31 |
275.51 |
The true picture of the American economy is that in 2007 there were 146 million Americans employed, or 63% of the working age population. Today, there are 139.9 million Americans employed, or 58.5% of the working age population. Over this time frame, an additional 7.1 million Americans entered the working age population. In 2007 there were 26.3 million Americans on food stamps, or 8.6% of the US population. Today there are 44.2 million Americans on food stamps, or 14.3% of the US population. To call the current economic disaster a recovery is to practice the art of the Big Lie.
Real Median Household Income, which is calculated using the dodgy government CPI, has not grown in 14 years. Using a true, non-manipulated inflation figure and real median household income is no higher than it was in 1987. The mainstream media reports the headline figures like the good lapdogs they are. The BLS Establishment data going back to 1965 is a treasure trove of interesting data. The average hourly wages have declined for the last three months and are essentially flat in the last year.

Decades of Decay
The current state of disarray in the job market did not occur overnight. It took decades of bad choices, willful ignorance and delusion. By charting BLS data over the last five decades, a picture of an empire in decay appears before your very eyes. We aren’t the first empire to experience this decay and won’t be the last. It is only in retrospect that it becomes clear that all empires gravitate from producing and creating to finance, debt and lending. The hubris of great empires leads them to believe they have been chosen by God as a special nation destined for eternal wealth and success. The seventeenth century Spanish empire thought so. The Dutch and their glorious maritime empire thought so. The all-powerful British Empire thought so. Do you hear much about these empires anymore? They all sacrificed productive activities and embraced the glories of a debt based society. Kevin Phillips details these declines in his brilliant book American Theocracy :
“Understandable as this cockiness might be, history teaches a crucial distinction: nations could marshal the necessary debt-defying high wire walks and comebacks during their youth and early middle age, when their industries, exports, capitalizations, and animal spirits were vital and expansive, but they became less resilient in later years. During these periods, as their societies polarized and their arteries clogged with rentier and debt buildups, wars and financial crises stopped being manageable. Of course, clarity about this develops only in retrospect. However, even though war related debt seems to have been part of each fatal endgame, the past leading world economic powers seem to have made another error en route. They did not pay enough attention to establishing or maintaining a vital manufacturing sector, thereby keeping a better international balance and a broader internal income distribution than financialization allowed.”
The chart below paints a clear picture of decay, debt and delusion. In 1961 the population of the United States was 184 million. There were 54 million employed Americans, with 15 million of them manufacturing goods for America and the rest of the world. Today the population of the United States is 310 million. There are 11.7 million people manufacturing goods, mostly weapons for export to our favorite despots. The population has grown by 68%, while manufacturing jobs have declined by 22%. Consumer spending accounted for 62.8% of GDP in 1961. Investments totaled 14.3% of GDP and we ran a trade surplus of $4.9 billion. Today, consumer spending accounts for 71.1% of GDP. Investments total 12.5% of GDP and we are running a $500 billion trade deficit. Over the course of 50 years, we’ve devolved from a production and exporting society into a consuming and borrowing society.
|
|
|
|
|
|
|
|
|
|
1961 |
1970 |
1980 |
1990 |
2000 |
2007 |
2010 |
Mar-11 |
| Total Employment |
54,106 |
71,005 |
90,530 |
109,487 |
131,786 |
137,599 |
129,819 |
130,738 |
|
|
|
|
|
|
|
|
|
| Mining |
728 |
677 |
1,077 |
765 |
599 |
724 |
705 |
758 |
| Construction |
2,908 |
3,654 |
4,454 |
5,263 |
6,787 |
7,630 |
5,526 |
5,514 |
| Manufacturing |
15,011 |
17,848 |
18,733 |
17,695 |
17,263 |
13,879 |
11,524 |
11,667 |
| Total Goods Producing |
18,647 |
22,179 |
24,264 |
23,723 |
24,649 |
22,233 |
17,755 |
17,939 |
|
|
|
|
|
|
|
|
|
| Trade, Transport, Utilities |
11,040 |
14,144 |
18,413 |
22,666 |
26,225 |
26,630 |
24,605 |
24,797 |
| Information |
1,693 |
2,041 |
2,361 |
2,688 |
3,630 |
3,032 |
2,711 |
2,681 |
| Finance |
2,590 |
3,532 |
5,025 |
6,614 |
7,687 |
8,301 |
7,630 |
7,610 |
| Professional & Business Services |
3,744 |
5,267 |
7,544 |
10,848 |
16,666 |
17,942 |
16,688 |
17,075 |
| Education & Health Serv. |
3,030 |
4,577 |
7,072 |
10,984 |
15,109 |
18,322 |
19,564 |
19,875 |
| Leisure & Hospitality |
3,468 |
4,789 |
6,721 |
9,288 |
11,862 |
13,427 |
13,020 |
13,156 |
| Other Services |
1,188 |
1,789 |
2,755 |
4,261 |
5,168 |
5,494 |
5,364 |
5,439 |
| Government |
8,706 |
12,687 |
16,375 |
18,415 |
20,790 |
22,218 |
22,482 |
22,166 |
| Total Service Producing |
35,459 |
48,826 |
66,266 |
85,764 |
107,137 |
115,366 |
112,064 |
112,799 |
A perusal of the chart shows the dramatic downturn has really occurred since 1980. Goods producing jobs have declined by 6.3 million in the last 30 years, while service jobs have grown by 46.5 million. Who would want to get their hands dirty on an assembly line when they could shuffle papers, invent CDOs, MBOs, and CDSs, create financial models to destroy the world, bribe rating agencies, file frivolous lawsuits, teach Keynesianism, or use the 60,000 page IRS code to help GE pay no taxes on their $14 billion of income. Alan Greenspan and many other “thought leaders” declared that America could succeed through its ingenuity and creative thought process. The rest of the world could handle the messy business of building things. So goes the hubris of an empire that has peaked. To get a clearer view of the conversion from a productive society to a consumption society, converting the above chart to a percentage basis is useful.
|
1961 |
1970 |
1980 |
1990 |
2000 |
2007 |
2010 |
Mar-11 |
| Total Employment |
100.0% |
100.0% |
100.0% |
100.0% |
100.0% |
100.0% |
100.0% |
100.0% |
|
|
|
|
|
|
|
|
|
| Mining |
1.3% |
1.0% |
1.2% |
0.7% |
0.5% |
0.5% |
0.5% |
0.6% |
| Construction |
5.4% |
5.1% |
4.9% |
4.8% |
5.2% |
5.5% |
4.3% |
4.2% |
| Manufacturing |
27.7% |
25.1% |
20.7% |
16.2% |
13.1% |
10.1% |
8.9% |
8.9% |
| Total Goods Producing |
34.5% |
31.2% |
26.8% |
21.7% |
18.7% |
16.2% |
13.7% |
13.7% |
|
|
|
|
|
|
|
|
|
| Trade, Transport, Utilities |
20.4% |
19.9% |
20.3% |
20.7% |
19.9% |
19.4% |
19.0% |
19.0% |
| Information |
3.1% |
2.9% |
2.6% |
2.5% |
2.8% |
2.2% |
2.1% |
2.1% |
| Finance |
4.8% |
5.0% |
5.6% |
6.0% |
5.8% |
6.0% |
5.9% |
5.8% |
| Professional & Business Services |
6.9% |
7.4% |
8.3% |
9.9% |
12.6% |
13.0% |
12.9% |
13.1% |
| Education & Health Serv. |
5.6% |
6.4% |
7.8% |
10.0% |
11.5% |
13.3% |
15.1% |
15.2% |
| Leisure & Hospitality |
6.4% |
6.7% |
7.4% |
8.5% |
9.0% |
9.8% |
10.0% |
10.1% |
| Other Services |
2.2% |
2.5% |
3.0% |
3.9% |
3.9% |
4.0% |
4.1% |
4.2% |
| Government |
16.1% |
17.9% |
18.1% |
16.8% |
15.8% |
16.1% |
17.3% |
17.0% |
| Total Service Producing |
65.5% |
68.8% |
73.2% |
78.3% |
81.3% |
83.8% |
86.3% |
86.3% |
In 1961 America was a well balanced economic powerhouse. Goods production accounted for 34.5% of all jobs, with manufacturing making up 27.7% of all jobs. Goods production now accounts for a pitiful 13.7% of all jobs in the country. The slack was picked up by financial analysts, accountants, lawyers, tax specialists, and bankers. They surged from supporting roles in a production society with 11.7% of the jobs in 1961 to the dominant big dogs today, with 18.9% of the jobs. The rest of the slack was taken up by teachers, school administrators, nurses, cabana boys and waitresses as they surged from 12% in 1961 to 25.3% of all jobs today. There is one problem with this shift. We have millions more educators, but our school systems churn out millions of functionally illiterate non-critical thinking drones. We have millions more healthcare professionals and are the most obese, unhealthy nation on earth even though we spend more per person than any other country. A country that employs one quarter of their workers in jobs that do not increase the wealth of the country is a country in decline. This shift has also pushed people into lower paying jobs.
|
1965 |
1970 |
1980 |
1990 |
2000 |
2007 |
2010 |
Mar-11 |
| Total Private Industry |
$2.63 |
$3.40 |
$6.85 |
$10.20 |
$14.02 |
$17.43 |
$19.07 |
$19.30 |
|
|
|
|
|
|
|
|
|
| Mining |
$2.87 |
$3.77 |
$8.97 |
$13.40 |
$16.55 |
$20.97 |
$23.83 |
$24.68 |
| Construction |
$3.23 |
$4.74 |
$9.37 |
$13.42 |
$17.48 |
$20.95 |
$23.22 |
$23.36 |
| Manufacturing |
$2.49 |
$3.23 |
$7.15 |
$10.78 |
$13.55 |
$17.26 |
$18.61 |
$18.90 |
| Total Goods Producing |
$2.63 |
$3.52 |
$7.66 |
$11.46 |
$15.27 |
$18.67 |
$20.28 |
$20.48 |
|
|
|
|
|
|
|
|
|
| Trade, Transport, Utilities |
$2.94 |
$3.65 |
$7.04 |
$9.83 |
$13.31 |
$15.78 |
$16.83 |
$16.99 |
| Information |
$4.47 |
$5.25 |
$9.47 |
$13.40 |
$19.07 |
$23.96 |
$25.86 |
$25.99 |
| Finance |
$2.38 |
$3.07 |
$5.82 |
$9.99 |
$14.98 |
$19.64 |
$21.49 |
$21.63 |
| Professional & Business Serv. |
$3.28 |
$4.04 |
$7.22 |
$11.14 |
$15.52 |
$20.15 |
$22.78 |
$23.10 |
| Education & Health Services |
$2.12 |
$2.88 |
$5.93 |
$10.00 |
$13.95 |
$18.11 |
$20.12 |
$20.45 |
| Leisure & Hospitality |
$1.17 |
$1.82 |
$3.98 |
$6.02 |
$8.32 |
$10.41 |
$11.31 |
$11.38 |
| Other Services |
$1.25 |
$2.01 |
$5.05 |
$9.08 |
$12.73 |
$15.42 |
$17.08 |
$17.23 |
| Total Service Producing |
$2.63 |
$3.34 |
$6.43 |
$9.72 |
$13.62 |
$17.11 |
$18.81 |
$19.05 |
| Consumer Price Index |
31.50 |
38.80 |
82.40 |
130.70 |
172.20 |
207.34 |
218.06 |
221.31 |
The insidious effects of Federal Reserve generated inflation can be seen in the above chart. The BLS Establishment data going back to 1965 reveals much about the hidden impact of inflation over time. In 1965 the average hourly wage was $2.65. Back then, Americans put in a full work week, averaging 38.6 hours per week. The average American was making $101.52 per week. This was enough for a family to live comfortably on with only one spouse working. Fast forward to today and we have an average wage of $19.30 per hour and work week of 33.4 hours. This yields an average weekly pay of $644.62. It is also necessary for most households to have two working spouses to make ends meet. I added the government reported CPI at the bottom of the chart to provide some perspective on our 50 years of middle class wage compression. Applying the change in CPI since 1965 to the change in average weekly earnings provides the clearest view of what has been done to our country by the Federal Reserve and the government/corporate oligarchy. It would have taken weekly wages of $713.25 to have kept up with inflation since 1965. The average worker today is making 10% less than they did in 1965, on an inflation adjusted basis.
Wages in the service industries fell behind by even more, with the exception of bankers, doctors and teachers. The finance sector wages and the healthcare/education sector wages are 25% higher than their inflation adjusted wages in 1965. You reap what you sow. The country has decided that bankers, doctors, and teachers are relatively more important to our economy than people who make products, create wealth, and increase the productive capacity of the country. Any impartial outcome based assessment of these choices would conclude these choices have been an unmitigated failure.
The financial/ banking sector has peddled debt to the masses that didn’t realize their standard of living has been declining for 50 years, and blew up the worldwide financial system through their greed and fraudulent business practices. We spend more per child on education than any country in the world and test scores are lower than they were 40 years ago. Our children graduate high school with no critical thinking skills and the inability to decipher propaganda from truth. We spend more per person on healthcare than any other country, but obesity, diabetes, and heart disease are rampant. Administrative bureaucracy and vast amounts of rules and regulations consume billions in these sectors of our economy. The simple art of creating and producing things that other people need or want has been cast aside by a country who thought they could borrow and spend their way to long-term prosperity.
So, here we find ourselves 18 months into a “recovery” and the country has added 1.3 million jobs in the last year. We’ve added 529,000 lawyers, accountants, consultants and tax specialists. We’ve added 420,000 teachers, nurses and administrators. We’ve added 193,000 waitresses and hotel busboys. And we’ve added 238,000 Wal-Mart clerks. Our well balanced economy is back in gear. What could go wrong?
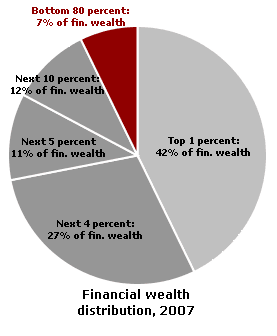
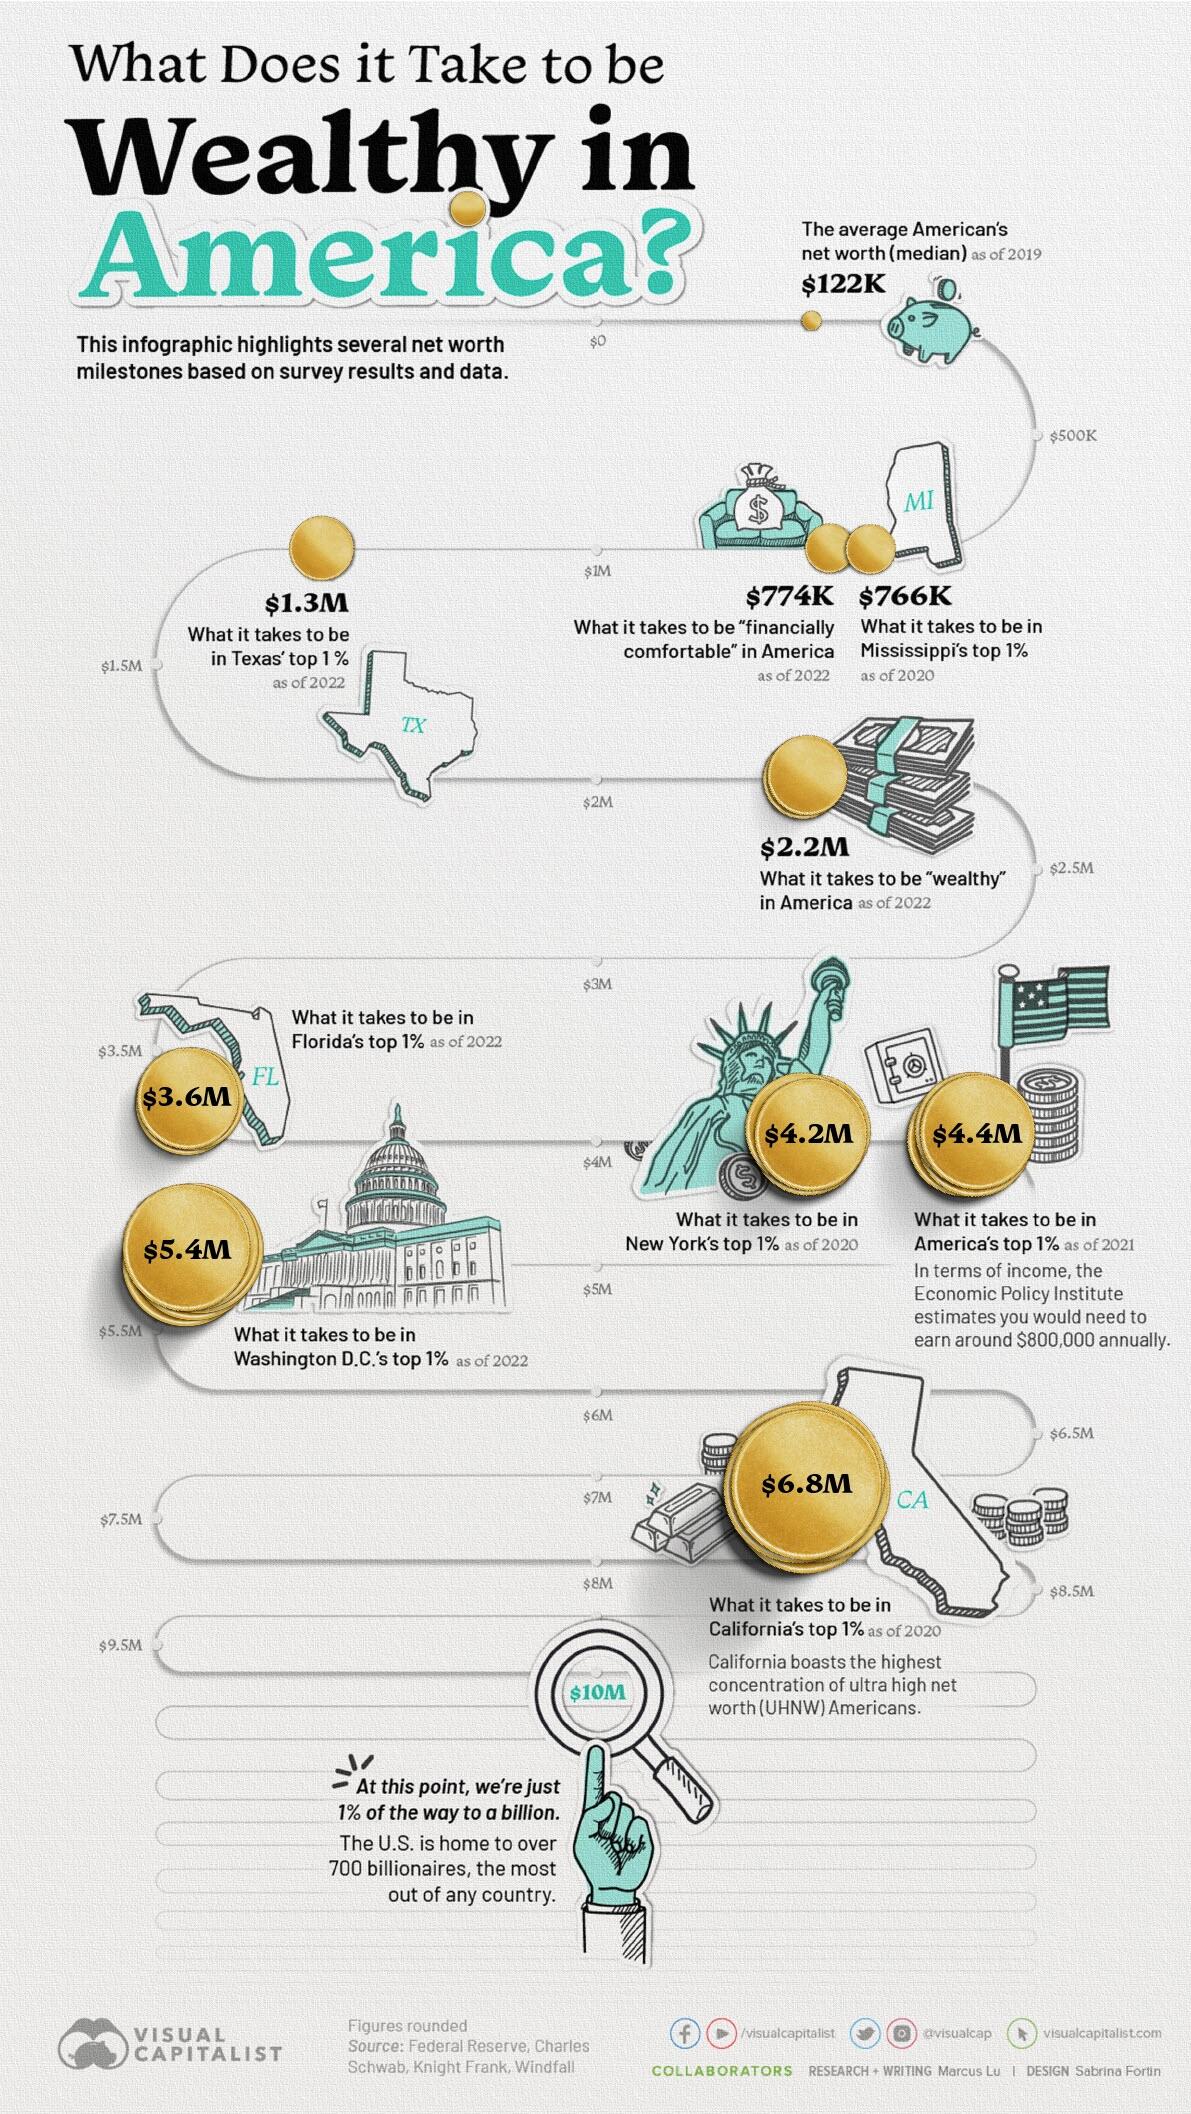
The truth is that the country remains in a 50 year death spiral of bad choices, delusion and fraud, created to benefit the few at the expense of the many. The average American wallows in a reality of low wages and high debt. Some of this reality has been self inflicted. Willful ignorance is a choice. Educating yourself to the truth is available to every American. Spending less than you make is something everyone can do. But, at the end of the day, the 1% at the top of the food chain controls the levers in this country. While the average American has fallen behind over the last 50 years, the ultra-wealthy elite have prospered. The top 1% takes home 25% of the national income and control 40% of the financial wealth in the country. Their lives have improved considerably. Twenty-five years ago, the ruling elite “earned” 12% of the national income and controlled 33% of the financial wealth. These are the people who control the message. They own the mainstream media. They run the Wall Street banks. They control the Federal Reserve. They write the laws and the tax code. They control the politicians like puppets on a string. An economic system based upon debt and Federal Reserve generated inflation benefits these chosen few, while destroying the middle class of America. We’ve chosen this path and are destined to experience the same fate as Spain, the Dutch, and Britain.