SUBPRIME AUTO NATION

Have you heard the news? Auto sales are booming. Total sales for the month of August were 1,285,202 vehicles, according to Autodata Corp, the highest monthly sales figure for any August since 2007, when 1.47 million autos were sold in the United States. Year to date auto sales have totaled 9.7 million and are on track to reach 14.5 million. Between 2006 and 2007, auto sales ranged between 16 million and 18 million. They crashed below 10 million in 2009. The Keynesians running our government have pulled out all the stops to restart this engine of consumer spending. First they wasted $3 billion of taxpayer funds on the Cash for Clunkers debacle. Almost 700,000 perfectly good cars were destroyed in order to keep union workers happy.  This Keynesian brain fart distorted the used car market for two years, raising prices for cars needed by the working poor. After that miserable failure, they realized the true secret to selling vehicles is to give them away to anyone that can scratch an X on a loan document, with 0% interest for 60 months, financed by Federal government controlled banking interests. Add in some massive channel stuffing and presto!!! – You’ve got an auto sales boom.

General Motors sales are up 3.7% over 2011. Ford Motors sales are up 6% over 2011. The Obama administration continues to tout their saving of the U.S. auto industry with their bailout in 2009 that saved unions and screwed bondholders. If this strong auto recovery is not an illusion, how do you explain the two charts below? General Motors stock is down 42% since 2011. The highly proclaimed success story called Ford Motors has seen their stock collapse by 50% since 2011. This is surely a sign of tremendous success and anticipation of soaring profits for these bastions of American manufacturing dominance.

Chart forGeneral Motors Company (GM)

Chart forFord Motor Co. (F)

This is America, land of the delusional and home of the vain. The appearance of success is more important than actual success. The corporate mainstream media dutifully reports the surge in auto sales is surely a sign the economy is recovering and the consumer has finished deleveraging and is ready to spend again. The government propaganda machine proclaims the surging auto sales are due to their wise and forward thinking policies (like the Chevy Volt). Luckily for them, there are millions of gullible Americans who believe the storyline and are easily convinced that driving a $30,000 new car, financed over seven years, makes them a success. The decades of Bernaysian marketing propaganda has worked its magic on the government educated, math challenged citizenry. There are only two things that matter to the non-thinking auto buyer (renter) – the monthly payment and what the next door neighbor and his coworkers will think. Buying a fuel efficient car they can afford, paying it off in three or four years, and driving it for ten years, while saving the monthly car payment, is what a practical, rational thinking person would do. The fact that only 20% of the 9.7 million vehicles sold this year have been small cars and the average sales price of new cars sold is now $31,000 proves Americans are still living in a delusional fantasyland of cheap gas and monthly payments for eternity.

As gas prices surpass $4 per gallon across the country, somehow 4.7 million of the 9.7 million vehicles sold in 2012 have been pickups, vans, crossovers or SUVs. Three of the top eight selling vehicles are pickups. Luxury vehicle sales are booming, with Mercedes, BMW, Porsche, Land Rover and Audi showing double digit percentage sales gains over 2011. We’ve entered a recession, gas prices are approaching all-time highs, job growth is pitiful, and Americans continue to buy luxury gas guzzlers on credit. This will surely end well.

The average payment on a new car in 2012 is $461. For used cars, the average monthly payment is $346. Today, 77% of new car purchases are financed. About half of all used vehicles involve financing. Of those cars financed, 89% are through a loan vs. 11% with a lease. A critical thinking person might wonder how a country with 4 million less employed people than we had in 2007, median household net worth down 35%, and real wages lower than they were in 2007, could be experiencing an auto boom. The answer is a government/corporate/banker/media effort to funnel taxpayer funds to deadbeats across the land in a fruitless attempt to create a facade of recovery. Our governing elite are convinced that more debt peddled to the masses is the path to recovery for an economy that imploded due to excessive debt peddled to the masses in the first place. Essentially, it comes down to who benefits from the peddling of debt. It isn’t the masses, as they become enslaved in the chains of debt and monthly payments in perpetuity. Debt peddling benefits Wall Street bankers, politicians, and mega-corporations selling crap to the masses.

The storyline being sold to the vegetative dupes (watching Honey Boo Boo) that occupy space in this delusional paradise we call America, by the corporate media, is that consumers have deleveraged and are ready to resume their “normal” pattern of spending money they don’t have on stuff they don’t need. Of course, the facts always seem to get in the way of a good yarn. Consumers have never deleveraged. Consumer credit outstanding is at an all-time high of $2.58 trillion. The decline from $2.55 trillion in 2008 to $2.4 trillion in 2010 was NOT deleveraging. It was the Wall Street Too Big To Fail banks taking a big dump on the American taxpayers. They passed their bad debts to you through TARP, the Federal Reserve buying their toxic “assets”, and ZIRP. 

Revolving credit (credit card) debt peaked at just above $1 trillion in 2008 and “declined” to $850 billion during 2010.  The media storyline is that you buckled down and paid off your credit cards, therefore depressing consumer spending and creating a recession. Sounds convincing except for the fact that it’s a load of bullshit. The Federal Reserve’s own data proves it to be false. Your friendly Wall Street banks have written off $213 billion of credit card debt since 2008 and passed the bill to the few remaining taxpayers in this country. For the math challenged, this means that consumers have actually INCREASED their credit card debt by $68 billion since 2008. The bad news for our Chinese crap peddling mega-retailers is that the significantly poorer average middle class American household is using their credit cards to pay their property tax bills, IRS bills, and utility bills in order to survive.  

Credit Card Charge-off in Dollars 2005 – 2011 — Not Seasonally Adjusted:

Year Dollar Amount
2011 $46,017,459,671
2010 $75,090,106,350
2009 $83,179,901,000
2008 $53,506,353,600
2007 $38,149,440,000
2006 $32,111,934,400
2005 $40,634,994,400
Year & Quarter Dollar Amount
2012Q1 $8,772,385,443


The category of debt that barely budged in the 2009 collapse was non-revolving credit. It stayed in the $1.5 trillion range in 2009 and has since surged to over $1.7 trillion in 2012. What could possibly have made this debt skyrocket by $200 billion when the GDP has only grown by 12% over the same time frame? You guessed it – your corporate fascist friends in Washington DC and on Wall Street. Non-revolving debt consists of auto loan debt of $663 billion and student loan debt of approximately $1 trillion. Student loan debt has shot up by $300 billion since 2008. This student loan debt is being distributed, like candy by a pedophile, from the Federal government in an effort to artificially hold down the unemployment rate.
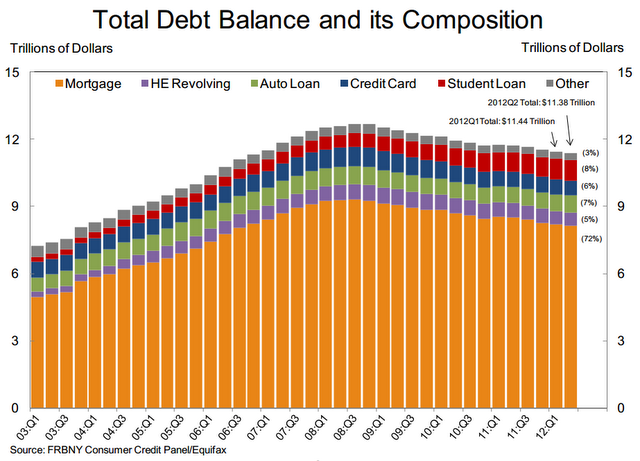
Approximately $500 billion of the student loan debt is held directly by the Federal government, up from $100 billion in 2008. The Feds guarantee the majority of the remaining student loan debt. Can you think of a more subprime borrower than a 40 year old former construction worker getting a liberal arts degree from the University of Phoenix, sitting at his computer in his underwear scratching his balls, and paying with a $10,000 Federal student loan from you? This fraudulent attempt to obscure the true employment situation will end in tears for the borrowers and the American taxpayer. It’s tough to make a loan payment without a job. The student loan bailout is just over the horizon and will cost you at least $300 billion. Delinquencies are already off the charts.
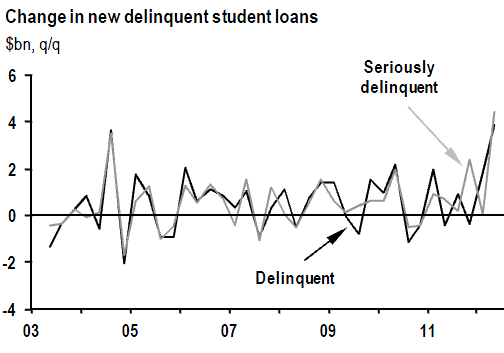
        

When has offering low interest debt in ample portions to people without jobs, income or assets ever backfired before? The bankers and politicians that control this country seem to be a one-trick pony. They will never admit that debt is the problem and reducing it the solution. The real solution would make them poorer, so their solution is to pour gasoline on the fire with more debt at lower interest rates to more people. The addict will keep injecting more poison into their system until sudden death. The bankers and politicians know we are a car-centric society and appeal to our vanity and poor math skills to keep the game going.     

During the first quarter of this year, total U.S. car loans totaled $52.5 billion. That’s 49% higher than the same period in 2009. Also during the first quarter, the average amount financed on new vehicles rose by $589, to $25,995, and for used cars by $411, to $17,050. Furthermore, buyers are stretching out payments for longer terms: The average length of new- and used-vehicle loans jumped a full month during the first three months of this year, to 64 and 59 months, respectively. The surge in auto sales is being completely driven by doling out more loans for a longer time frame to deadbeat borrowers. Subprime auto loans now make up 45% of all car loans and the vast majority of all used car loans.  They have even created a category called Deep Subprime. Borrowers classified as “deep subprime” (i.e. those with Vantage scores below 600) account for 10.7% of auto loans. You can also classify them as loans that will never be repaid.
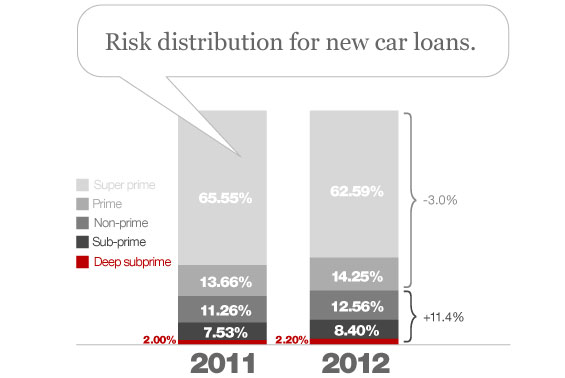
 

Two thirds of all car sales are for used cars, so the fact that 37% of all new cars are being sold to subprime borrowers is exacerbated by the ridiculous lending practices for used cars. The fine folks at Zero Hedge have provided the outrageous data and a chart that proves beyond a shadow of a doubt what awaits the American taxpayer – another bailout. Zero Hedge has already revealed the GM fake recovery by detailing their channel stuffing over the last two years. Now they’ve dug up more dirt on why car sales are surging. What could possibly go wrong providing loans for more than the value of the asset to people with a history of not paying their debts?

  • Subprime borrowers received 56.46% of loans on used cars in the quarter, up from 52.70% a year earlier.
  • The average loan-to-value on new cars was 109.55%
  • The average used car loan-to-value ratio rose to 126.62%
  • 77% of Subprime Auto Loans are for a period greater than five years

It’s amazing how many cars you can sell when you aren’t worried about getting paid. This is the beauty of a fiat currency, a printing press, and a taxpayer available to pick up the tab after the drunken party gets out of hand. The chart below provides the details of our superhighway to disaster. The percentage of used car loans to prime borrowers is now at an all-time low, while the percentage of loans to subprime borrowers is near all-time highs reached just prior to the 2008 crash. When lenders cared about being paid back in the early 2000’s, they rarely made loans longer than five years. Today, more than 77% of all subprime used car loans are longer than five years and average FICO scores are now well below 600. Just to clarify – if your FICO score is below 600 – YOU ARE A DEADBEAT.

When you start to connect the dots, things that didn’t seem to make sense begin to crystallize. This is all part of the master plan concocted by Bernanke, Geithner, Obama and the Wall Street Shysters. The auto section of my local paper now makes sense. Offers of 7 year financing at 0% interest and monthly lease offers of $150 to $200 for brand new cars now are understandable. The newer model BMWs, Cadillac Escalades, Volvos, and Jaguars I see parked in front of the low income luxury gated townhome community in West Philadelphia now makes sense. A pizza delivery guy driving a new Lexus is now explainable.   

The master plan is fairly simple. The Federal Reserve lends money to the Wall Street banks for 0% interest. These banks then turn around and provide credit card debt at 13% interest, new & used car loans to prime borrowers at 5% interest, and new & used car loans to subprime borrowers at 16%. When you can borrow for free, you can take a chance that a significant number of your borrowers will default. Essentially, Ben Bernanke is screwing the prudent savers and senior citizens by paying them 0.15% on their savings in order to subsidize the bankers that destroyed the country so they can make auto loans to the same people who took out the zero percent down interest only no doc mortgage loans in 2005. In addition, Wall Street knows the Bernanke Put is still in place. If and when these subprime loans explode in their faces again, Bennie, Timmy and Obamaney will come to the rescue with your tax dollars. Its heads you lose, tails you lose, again.    

 The chart below is like a who’s who of TARP recipients. The top 20 auto lenders control half the market. And look at the leader of the pack. Our friends at Ally Bank are the market share leader. You remember Ally Bank – they conveniently changed their name from GMAC (also known as Ditech – biggest subprime mortgage lender) after losing billions and being bailed out by you. They still owe you $11 billion and are 85% owned by the U.S. Treasury. No conflict of interest there. You have the biggest auto lender on earth controlled by the Obama administration. Do you think they have an incentive to make as many loans as humanly possible to help Obama create the illusion of an auto recovery? The only downside is for the American taxpayer when we have to eat billions more in Ally/GMAC losses. This insolvent excuse for a lending institution has been extremely aggressive in the subprime auto lending market and has forced the other wannabes – Wells Fargo, JP Morgan, Capital One and Bank of America – to lower their lending standards. Does this scenario ring a bell? 

top_20_car_lenders_market_share

We’ve become a subprime auto nation, addicted to easy debt, living lives of hope, delusion and minimum monthly payments. Storylines about economic recovery, fraudulent government statistics showing lower unemployment, feel good propaganda from the corporate mainstream media, and a return to easy money debt fueled spending does not constitute a real recovery. Until the bad debt is purged from the system and saving takes precedence over spending, the country will stagger and ultimately fall under the weight of its immense debt. We are lost in a blizzard of lies. This subprime fueled engine of recovery will propel the country into the same canyon of reality we entered in 2008. The crack up boom approaches.


survival seed vault


DEBATING A DOUCHEBAG – KRUGMAN CHRONICLES

Krugman’s solution is always the same. Borrow more. Spend more. Driving the National debt up by $5.5 trillion since 2008 has not brought us out of this recession. Krugman believes if we had just borrowed and spent another $3 trillion things would be much better now. His intellectual dishonesty and defending of a failed ideology is pitiful to watch. He belongs with the NYT, another liberal failure.

Whiskey & Gunpowder
by Detlev Schlichter

May 2, 2012
London, England, UK

How to Debate Paul Krugman

Paul Krugman is the high priest of Keynesianism and modern interventionism, of economic improvement through inflation and budget deficits. As such he is bête noir among us libertarians and Austrian School economists.

What makes him so annoying is his unquestioning, reflexive and almost childlike enthusiasm for state intervention, even in the face of its obvious failure, and his apparent unwillingness to probe any deeper into the real causes of our present economic problems or to show any willingness to investigate the effectiveness or ineffectiveness of his particular medicine. His Keynesian convictions are presented as articles of faith that no intelligent person can seriously question.

A Krugmanesque argument is always built on a number of assumptions that are beyond doubt:

1) Recessions, depressions and crises are the result of the unhampered market. We actually do not have to investigate if markets were really free when recessions occurred or what really were the specific causes of whatever threw the economy off track. When there is a recession, depression or crisis, there must have been too much of an uncontrolled market.

2) The Great Depression was caused by uncontrolled markets.

3) Recessions, depressions and crises are practically the result of one problem: a lack of aggregate demand. People, for whatever reason (and who cares about the reason; let’s not get hung up on those details!) don’t spend enough. If everybody were to spend more, people would sell more. Problem solved. It is the role of government to get people spending again. This is done by printing money and causing inflation so that people spend the money rather than save it. Or by the government running up deficits and spending it on behalf of the stupid savers.

4) The Great Depression was solved by the government spending lots of money and the central bank printing lots of money.

5) This explains ALL economic problems.

6) If there are recessions, depressions and crises, they can all be solved by printing money and by deficit spending.

7) If after many rounds of money printing and deficit spending there is still a recession, then only one conclusion is permissible: There was obviously not enough money printing and deficit spending. We need more money printing and deficit spending.

8) If after another round of money printing and deficit spending we still have a recession, then….well, are you stupid, or what? We obviously have NOT PRINTED ENOUGH MONEY and we are NOT ACCUMULATING ENOUGH DEBT!

(And, by the way, remember (7) above.)

Krugman is practicing Keynesianism as a religion. The 8 commandments above are not to be questioned. Whoever questions them is not worthy of debate. Consequently, Krugman has turned down requests to debate people like Peter Schiff or Bob Murphy. Interestingly, he agreed to debate Ron Paul on TV. The link is here.

I have to say that Ron Paul did not do as well as I had hoped he would. He did not sufficiently attack Krugman in my view, for the failure and ultimately disastrous consequences of his policy prescriptions. Krugman is the one who should be made to explain his policy recommendations. After all, t’s policies like the ones he is recommending got us into this mess in the first place Krugman needs to explain why his policy ideas have been implemented for years to no effect.

Yet, Krugman succeeded in putting Paul on the defensive, something in which he was greatly helped by the following: While Krugman may be the most outstanding, unashamed and fundamentalist of the celebrity Keynesians, the attitudes of the general public, the other journalists and thus most of the TV viewers are predominantly shaped by Keynesianism as well, and this means that Krugman, more than Paul or any ‘Austrian’ debater, can rely on some sense of intellectual sympathy.

Maybe the viewers don’t quite share the unquestioning, almost vulgar dedication to the Faith, that Krugman epitomizes. Maybe they feel queasy about printing trillions of paper dollars and running trillion-dollar deficits. Of course, a true believer like Krugman will never allow himself such feelings. But in general, the public, too, believes that the free market (and greedy bankers) caused the financial crisis; that we need low interest rates and other government measures to stimulate the economy; and that inflation is really not our main concern. Krugman, I think, cleverly used these attitudes to present himself as the safe and rational choice, and Paul as the weirdo who wants to pour out the state-policy baby with the crisis bath water.

Ron Paul started strongly by pointing out that Krugman’s policy is based on the idea that a bureaucratic elite can set interest rates and decide how much money should be created, and that this involves an arrogant and dangerous pretence of knowledge. Very good point.
Immediately, the apostle Krugman raised his head. “You cannot get the state out of money.” “The Fed has to set interest rates.” “You cannot go back 150 years.”

I think this is where Ron Paul should have dug in and put Krugman on the defensive:

“Why not? There was no Fed before 1913. That the Fed made things more stable is your assumption. But is it true? People like you and Bernanke tell us that the gold standard was to blame for the Depression. In the run-up to the Depression we had a gold standard but we also had a Fed. How can you say that the gold standard was to blame and the Fed was ultimately the solution?

“Dr. Krugman just said, ‘history told us’. That is nonsense. History doesn’t tell us anything. You need theory to interpret history, and your theory is wrong. You assign blame for the depression according to your Keynesian theory. If that theory is wrong – and I think it is completely wrong – your interpretation of history is hopelessly wrong.

“Dr. Krugman, we do no longer live in the 1930s. Why is it that you are harking back to those days? Are we still solving the Great Depression?

“Fact is that the monetary and economic institutions of America were shaped by people with your beliefs, Dr. Krugman. We have your system today. We have conducted and are conducting your policies. And, Dr. Krugman, do you really want to tell the American public that these policies and these institutions, such as the Fed, are working?

“We have no gold standard. Since 1971, the Fed is entirely free to print as much money as it likes. That is your system, isn’t it? That is what you recommend. – You say the Fed needs to keep interest rates low and print money to stimulate growth. That is what the Fed did in 1998 after LTCM and the Russia default, just as you recommended. That is what the Fed did again after the NASDAQ bubble burst and after 9/11 – surely, that was not an Austrian policy but a Keynesian one. It was straight out of your rule book, Dr. Krugman. You say the uninhibited market is to blame for the financial crisis. I say your policy is to blame. The mortgage bubble was blown by the ‘stimulus’ policy of the Fed – low interest rates and plenty new bank reserves – between 2001 and 2005. That was your recommendation, right? And those of your Keynesian buddies, such as Paul McCulley at Pimco.

“Since 2007, the Fed is conducting your policy. So is the US government. You demanded monetary stimulus and you got it. The Fed created $2 trillion dollars out of thin air. Interest rates have been zero for years. The US government is conducting stimulus policy to the tune of $1trillion-plus every year. Are you telling me, these are not Keynesian policies? What is it, Austrian policy?!

“What you are recommending has in fact been the guiding principle of global economic policy for years. What you are recommending is a systematic distortion of the market place. It is persistent price distortion. That is why we had an unsustainable housing boom. That is why we had a mortgage boom. That is why we had a financial industry boom. And whenever these artificial booms – that you create with your policy – falter, the American public has to pay the price. And what do you suggest then? More of the same. More cheap credit. More government debt. In the hope that you can generate another artificial boom for which a later generation will again have to pay the price.

“Dr. Krugman, you just answered the question of this journalist about how much more debt we should accumulate, by saying maybe another 30 percent but that nobody can say for sure. I agree that nobody can say how much debt the system can still take. But tell us, why do you think that the next 30 percent of state debt will magically stimulate the economy and that these 30 percent will thus achieve what the previous 30 percent obviously failed to do.

“Dr. Krugman, you have me worried here. And I think our viewers too. The only response you have to the abject failure of your policies is that we should do more of them. Whatever Keynesian stimulus is being implemented and whatever money the Fed prints, all you ever say is that it is not enough. We need more. Has it ever occurred to you that maybe the problem is the policy itself? Maybe your medicine is making things worse and not better.

“And something else worries me, Dr. Krugman. When do we ever stop printing money and borrowing? I think that you are stuck in a failed paradigm, a failed economic theory and a failed policy program. This has happened to scientists and politicians before. You cannot admit that failure. When you are confronted with the failure of modern central banking, of Keynesian stimulus and of moderate inflationism, your only answer is that nothing is wrong with any of it, it is just not implemented forcefully enough. Dr. Krugman, you remind me of a doctor, who misdiagnosed the disease and prescribed the wrong medicine and who is now unwilling to look at the situation objectively. All you want to do is increase the dosage.

“If the viewers really want to understand what is going on, they should not buy Krugman’s new book but go to the website of the Mises Institute and look for some excellent Austrian School literature, in particular anything written by Ludwig von Mises himself. But if you don’t have time to do this, an excellent start is a book by Detlev Schlichter, with the title Paper Money Collapse.”

Well, I guess this is how it could have unfolded.

Regards,

Detlev Schlichter
Paper Money Collapse

THANK GOD I’M WHITE

Fascinating report put out by the Census Bureau this morning. Here are some key points:

  • The nation’s official poverty rate in 2010 was 15.1 percent, up from 14.3 percent in 2009, the third consecutive annual increase in the poverty rate.  
  • There were 46.2 million people in poverty in 2010, up from 43.6 million in 2009, the fourth consecutive annual increase and the largest number in the 52 years for which poverty estimates have been published
  • The number of people without health insurance coverage rose from 49.0 million in 2009 to 49.9 million in 2010, while the percentage without coverage -16.3 percent – was not statistically different from the rate in 2009.
  • Breaking it down by ethnicity, living in poverty were 27.4% of all blacks, and 26.6% of all Hispanics. White, non Hispanics and Asians were doing better at 9.9% and 12.1% respectively.

Looks like us white folks are doing better than those minorities. I find this data fascinating. The number of people in poverty rose for the fourth consecutive year to an all-time high. But how could that be? Our very own government reported that Real GDP grew 3.0% in 2010. How could more people go into poverty if the economy grew strongly? It’s because the economy did not grow. The GDP numbers are a lie. The government borrowed from the Chinese, transferred the money to the poor and called it income.

The only people who recovered in 2010 were Wall Street bankers and big corporation CEOs like Immelt. The average person’s life got worse – little or no pay increases, higher food costs, and higher energy costs. If the economy had actually recovered in 2010, why did 6 million MORE people go on food stamps since 2009?

Obama and his minions got everything they asked for in 2009. They had both houses of Congress and they passed their plan, lock, stock and barrel. But somehow their Keynesian solutions led to greater poverty, 23% unemployment, and declining household income. Are you shocked that blacks and hispanics have almost three times the poverty of whites? When more than half your population is born out of wedlock and 50% of your kids drop out of high school and you depend on the government to pay your way in the world, what do you expect. At least they still have their Direct TV, cell phones, and SNAP cards.

The most revolting figure in the report is the real median household income of $49,445. This means 50% of the households in the U.S. make less than $49,445 per year. Below is a chart showing the real median household income going back to 1975. It is now lower than it was in 1997 and 6% below the peak, reached in 1999. Imagine the result if we used the real rate of inflation, rather that the government manipulated piece of shit called the CPI. My educated guess would be that real median household income is lower than it was in 1986.  

Year No. of Households Nominal $ Inflation Adjusted $
2009 117,538,000 $49,777 $49,777
2008 117,181,000 $50,303 $50,303
2007 116,783,000 $50,233 $52,163
2006 116,011,000 $48,201 $51,473
2005 114,384,000 $46,326 $51,093
2004 113,343,000 $44,334 $50,535
2003 112,000,000 $43,318 $50,711
2002 111,278,000 $42,409 $50,756
2001 109,297,000 $42,228 $51,356
2000 108,209,000 $41,990 $52,500
1999 106,434,000 $40,696 $52,587
1998 103,874,000 $38,885 $51,295
1997 102,528,000 $37,005 $49,497
1996 101,018,000 $35,492 $48,499
1995 99,627,000 $34,076 $47,803
1994 98,990,000 $32,264 $46,351
1993 97,107,000 $31,241 $45,839
1992 96,426,000 $30,636 $46,063
1991 95,669,000 $30,126 $46,445
1990 94,312,000 $29,943 $47,818
1989 93,347,000 $28,906 $48,463
1988 92,830,000 $27,225 $47,614
1987 91,124,000 $26,061 $47,251
1986 89,479,000 $24,897 $46,665
1985 88,458,000 $23,618 $45,069
1984 86,789,000 $22,415 $44,242
1983 85,407,000 $20,885 $42,910
1982 83,918,000 $20,171 $43,212
1981 83,527,000 $19,074 $43,328
1980 82,368,000 $17,710 $44,059
1979 80,776,000 $16,461 $45,498
1978 77,330,000 $15,064 $45,625
1977 76,030,000 $13,572 $43,925
1976 74,142,000 $12,686 $43,649
1975 72,867,000 $11,800 $42,936


The average family in the US is making much less money than they were 12 years ago. This supports John Williams contention that the US has virtually been in a decade long recession, despite what the government and main stream media report.

The situation continues to deteriorate. These families made up for their decline in income, by increasing their credit card, auto loan and student loan debt from $1.4 trillion in 1999 to $2.5 trillion today. Without jobs, incomes can’t rise. The Obama solution will be to funnel more of your money to those classified as in poverty. The only solution that will work is to liquidate the banks, liquidate the debt, wipe out those who made bad decisions, and start over. No one wants to accept the reality of this solution. It is too painful. It is mean and brutish. Tough shit. It is the only way. We could soften the blow by withdrawing our troops from around the globe, protecting our own borders and freeing up hundreds of billions in war spending for domestic purposes. What a concept – building bridges in the U.S. rather than rebuilding bridges we blew up in Iraq.

Otherwise we will continue on a path of ever declining income and bankers enriching themselves at our expense. But, at least I’m white. I got that going for me.

Income, Poverty and Health Insurance Coverage in the United States: 2010

Summary of Key Findings

     The U.S. Census Bureau announced today that in 2010, median household income declined, the poverty rate increased and the percentage without health insurance coverage was not statistically different from the previous year.

     Real median household income in the United States in 2010 was $49,445, a 2.3 percent decline from the 2009 median.

     The nation’s official poverty rate in 2010 was 15.1 percent, up from 14.3 percent in 2009 ─ the third consecutive annual increase in the poverty rate. There were 46.2 million people in poverty in 2010, up from 43.6 million in 2009 ─ the fourth consecutive annual increase and the largest number in the 52 years for which poverty estimates have been published.

     The number of people without health insurance coverage rose from 49.0 million in 2009 to 49.9 million in 2010, while the percentage without coverage −16.3 percent – was not statistically different from the rate in 2009.

     This information covers the first full calendar year after the December 2007-June 2009 recession. See section on the historical impact of recessions.

     These findings are contained in the report Income, Poverty, and Health Insurance Coverage in the United States: 2010. The following results for the nation were compiled from information collected in the 2011 Current Population Survey (CPS) Annual Social and Economic Supplement (ASEC):

Income

  • Since 2007, the year before the most recent recession, real median household income has declined 6.4 percent and is 7.1 percent below the median household income peak that occurred prior to the 2001 recession in 1999. The percentages are not statistically different from each another.

Race and Hispanic Origin (Race data refer to people reporting a single race only. Hispanics can be of any race.)

  • Among race groups, real median income declined for white and black households between 2009 and 2010, while changes for Asian and Hispanic-origin households were not statistically different. Real median income for each race and Hispanic-origin group has not yet recovered to the pre-2001 recession all-time highs. (See Table A.)

Regions

  • Households in the Midwest, South and West experienced declines in real median income between 2009 and 2010. The apparent change in median household income for the Northeast was not statistically significant. (See Table A.)

Nativity

  • Median income for households maintained by native-born householders declined between 2009 and 2010 in real terms. The change in the median income of all foreign-born households was not statistically significant. (See Table A.)

Earnings

  • In 2010, the earnings of women who worked full time, year-round were 77 percent of that for men working full time, year-round, not statistically different from the 2009 ratio. The 2010 real median earnings of these men and women were not different from the 2009 earnings.
  • Since 2007, the number of men working full time, year-round with earnings decreased by 6.6 million and the number of corresponding women declined by 2.8 million.

Income Inequality

  • Based on the Gini Index, the change in income inequality between 2009 and 2010 was not statistically significant, while the changes in shares of aggregate household income by quintiles showed a slight shift to more inequality. The Gini index was 0.469 in 2010. (The Gini index is a measure of household income inequality; zero represents perfect income equality and 1 perfect inequality.)

Poverty

  • The poverty rate in 2010 was the highest since 1993 but was 7.3 percentage points lower than the poverty rate in 1959, the first year for which poverty estimates are available. Since 2007, the poverty rate has increased by 2.6 percentage points.
  • In 2010, the family poverty rate and the number of families in poverty were 11.7 percent and 9.2 million, respectively, up from 11.1 percent and 8.8 million in 2009.
  • The poverty rate and the number in poverty increased for both married-couple families (6.2 percent and 3.6 million in 2010 from 5.8 percent and 3.4 million in 2009) and female-householder-with-no-husband-present families (31.6 percent and 4.7 million in 2010 from 29.9 percent and 4.4 million in 2009). For families with a male householder no wife present, the poverty rate and the number in poverty were not statistically different from 2009 (15.8 percent and 880,000 in 2010).

Thresholds

  • As defined by the Office of Management and Budget and updated for inflation using the Consumer Price Index, the weighted average poverty threshold for a family of four in 2010 was $22,314.
    (See <http://www.census.gov/hhes/www/poverty/data/threshld/index.html> for the complete set of dollar value thresholds that vary by family size and composition.)

Race and Hispanic Origin (Race data refer to people reporting a single race only. Hispanics can be of any race.)

  • The poverty rate for non-Hispanic whites was lower in 2010 than it was for other racial groups. Table B details 2010 poverty rates and numbers in poverty, as well as changes since 2009 in these measures, for race groups and Hispanics.

Doubled-Up Households

  • Doubled-up households are defined as households that include at least one “additional” adult: a person 18 or older who is not enrolled in school and is not the householder, spouse or cohabiting partner of the householder. In spring 2007, prior to the recession, doubled-up households totaled 19.7 million. By spring 2011, the number of doubled-up households had increased by 2.0 million to 21.8 million and the percent rose by 1.3 percentage points from 17.0 percent to 18.3 percent.
  • In spring 2011, 5.9 million young adults age 25-34 (14.2 percent) resided in their parents’ household, compared with 4.7 million (11.8 percent) before the recession, an increase of 2.4 percentage points.
  • It is difficult to precisely assess the impact of doubling up on overall poverty rates. Young adults age 25-34, living with their parents, had an official poverty rate of 8.4 percent, but if their poverty status were determined using their own income, 45.3 percent had an income below the poverty threshold for a single person under age 65.

Age

  • The poverty rate increased for children younger than 18 (from 20.7 percent in 2009 to 22.0 percent in 2010) and people 18 to 64 (from 12.9 percent in 2009 to 13.7 percent in 2010), while it was not statistically different for people 65 and older (9.0 percent).
  • Similar to the patterns observed for the poverty rate in 2010, the number of people in poverty increased for children younger than 18 (15.5 million in 2009 to 16.4 million in 2010) and people 18 to 64 (24.7 million in 2009 to 26.3 million in 2010) and was not statistically different for people 65 and older (3.5 million).

Nativity

  • The 2010 poverty rate for naturalized citizens was not statistically different from 2009, while the poverty rates of native-born and noncitizens increased. Table B details 2010 poverty rates and the numbers in poverty, as well as changes since 2009 in these measures, by nativity.

Regions

  • The South was the only region to show statistically significant increases in both the poverty rate and the number in poverty — 16.9 percent and 19.1 million in 2010 — up from 15.7 percent and 17.6 million in 2009. In 2010, the poverty rates and the number in poverty for the Northeast, Midwest and the West were not statistically different from 2009. (See Table B.)

Health Insurance Coverage

  • The number of people with health insurance increased to 256.2 million in 2010 from 255.3 million in 2009. The percentage of people with health insurance was not statistically different from 2009.
  • Between 2009 and 2010, the percentage of people covered by private health insurance declined from 64.5 percent to 64.0 percent, while the percentage covered by government health insurance increased from 30.6 percent to 31.0 percent. The percentage covered by employment-based health insurance declined from 56.1 percent to 55.3 percent.
  • The percentage covered by Medicaid (15.9 percent) was not statistically different from 2009.
  • In 2010, 9.8 percent of children under 18 (7.3 million) were without health insurance. Neither estimate is significantly different from the corresponding 2009 estimate.
  • The uninsured rate for children in poverty (15.4 percent) was greater than the rate for all children (9.8 percent).
  • In 2010, the uninsured rates decreased as household income increased from 26.9 percent for those in households with annual incomes less than $25,000 to 8.0 percent in households with incomes of $75,000 or more.

Race and Hispanic Origin (Race data refer to those reporting a single race only. Hispanics can be of any race.)

  • The uninsured rate and number of uninsured in 2010 were not statistically different from 2009 for non-Hispanic whites and blacks, while increasing for Asians. The number of uninsured Hispanics was not statistically different from 2009, while the uninsured rate decreased to 30.7 percent. (See Table C.)

Nativity

  • The proportion of the foreign-born population without health insurance in 2010 was about two-and-a-half times that of the native-born population. The 2010 uninsured rate was not statistically different from the 2009 rate for native-born, the foreign-born overall and noncitizens but rose for naturalized citizens. Table C details the 2010 uninsured rate and the number of uninsured, as well as changes since 2009 in these measures, by nativity.

Regions

  • The Northeast and the Midwest had the lowest uninsured rates in 2010. Between 2009 and 2010, there were no statistical differences in uninsured rates for any of the regions. The number of uninsured increased in the Northeast, while there were no statistically significant changes for the other three regions. (See Table C.)

Historical Impact of Recessions

Since 2010 represents the first full calendar year after the recession that ended in June 2009, one can compare changes in income, poverty and health insurance coverage between 2009 and 2010 with changes during the first year after the end of other recessions:

  • Median household income declined the first full year following the December 2007 to June 2009 recession, as well as in the first full year following three other recessions (March 2001 to November 2001, January 1980 to July 1980 and December 1969 to November 1970). However, household income increased the first full year following the November 1973 to March 1975 recession, and the changes following the July 1990 to March 1991 and July 1981 to November 1982 recessions were not statistically significant.
  • The poverty rate and the number of people in poverty increased in the first calendar year following the end of the last three recessions. For the recessions that ended in 1961 and 1975, the poverty rate decreased in the next full calendar year.
  •      After the most recent recession, there was no significant difference in the uninsured rate during the first full year after the recession. However, in the year following the recessions that ended in 1991 and 2001, the uninsured rate increased.

Supplemental Poverty Measure

     The Census Bureau’s statistical experts, with assistance from the Bureau of Labor Statistics and in consultation with the Office of Management and Budget, the Economics and Statistics Administration and other appropriate agencies and outside experts, are now developing a Supplemental Poverty Measure. The Supplemental Poverty Measure, for which the Census Bureau expects to publish preliminary estimates in October 2011, will provide an additional measure of economic well-being. It will not replace the official poverty measure and will not be used to determine eligibility for government programs. See Income, Poverty, and Health Insurance Coverage in the United States: 2010 for more information.

     The Current Population Survey Annual Social and Economic Supplement is subject to sampling and nonsampling errors. All comparisons made in the report have been tested and found to be statistically significant at the 90 percent confidence level, unless otherwise noted.

     For additional information on the source of the data and accuracy of the estimates for the CPS, visit <http://www.census.gov/hhes/www/p60_239sa.pdf>.

KEYNESIAN SOLUTIONS – AFTER TOTAL FAILURE – TRY, TRY AGAIN

“Lenin is said to have declared that the best way to destroy the capitalist system was to debauch the currency. By a continuing process of inflation, governments can confiscate, secretly and unobserved, an important part of the wealth of their citizens. By this method they not only confiscate, but they confiscate arbitrarily; and, while the process impoverishes many, it actually enriches some. The sight of this arbitrary rearrangement of riches strikes not only at security, but at confidence in the equity of the existing distribution of wealth.” – John Maynard Keynes – The Economic Consequences of the Peace


While Barack Obama vacations on Martha’s Vineyard this week he’ll be thinking about his grand vision to save America – again. There is one thing you can say about Obama – he’s predictable. He promises to unveil his “new” plan for America in early September. The White House said Obama will give a speech after the September 5 Labor Day holiday to outline measures to boost hiring and find budget savings that surpass the $1.5 trillion goal of a new congressional deficit-cutting committee. It is heartening to see that Barack has turned into a cost cutter extraordinaire. He should be an inspiration to the Tea Party, except for one little problem. The plan he unveils in a few weeks will increase spending now and fret about spending cuts at some future unspecified date.

I can reveal his plan today because the White House has already leaked the major aspects of his plan. He will call for an extension of the Social Security payroll tax cut of 2% for all working Americans. This was supposed to give a dramatic boost to GDP in 2011. Maybe it will work next time. He will demand that extended unemployment benefits be renewed. Somehow providing 99 weeks of unemployment benefits is supposed to create jobs. It’s done wonders thus far. He will propose some semblance of an infrastructure bank or tax cuts to spur infrastructure spending. It will include a proposal for training and education to help unemployed people switch careers. He will attempt to steal the thunder from the SUPER COMMITTEE of 12 by coming up with $2 trillion of budget savings by insisting the Lear jet flying rich fork over an extra $500 billion.

You may have noticed that followers of Keynesian dogma like Paul Krugman, Larry Summers, Brad Delong, Richard Koo, John Galbraith, every Democrat in Congress, and every liberal pundit and columnist have been shrieking about the Tea Party terrorists and their ghastly budget cuts that are destroying our economy. They contend the stock market is tanking and the economy is heading into recession due to the brutal austerity measures being imposed by the extremists in the Republican Party. There is just one small issue with their argument. It is completely false. It is a bold faced lie. This is 2011. The economy has been in freefall since January 1. No spending cuts have occurred. Nada!!! As the CBO chart below reveals, the horrendous slashing of government will amount to $21 billion in 2012 and $42 billion in 2013. Of course, those aren’t even cuts in spending. They are reductions in the projected increases in spending. Politicians must be very secure in the knowledge that Americans are completely ignorant when it comes to anything other than the details of Kim Kardashian’s wedding and who Snooki is banging on Jersey Shore.


I’d like to remind the Harvard educated Keynesian economists that Federal government spending is currently chiming in at $3.8 trillion per year. Federal spending was $2.7 trillion in 2007 and $3.0 trillion in 2008. Keynesians believe government spending fills the gap when private companies are contracting. Obama has taken Keynesianism to a new level. Federal spending will total $10.8 trillion in Obama’s 1st three years, versus $8.4 trillion in the previous three years. Even a Harvard economist can figure out this is a 29% increase in Federal spending. What has it accomplished? We are back in recession, unemployment is rising, forty six million Americans are on food stamps, food and energy prices are soaring, and the middle class is being annihilated. The standard Keynesian response is we would have lost 3 million more jobs, we were saved from a 2nd Great Depression and the stimulus was too little. It would have worked if it had just been twice as large.

The 2nd Great Depression was not avoided, it was delayed. Our two decade long delusional credit boom could have been voluntarily abandoned in 2008. The banks at fault could have been liquidated in an orderly bankruptcy with stockholders and bondholders accepting the consequences of their foolishness. Unemployment would have soared to 12%, GDP would have collapsed, and the stock market would have fallen to 5,000. The bad debt would have been flushed from the system. Instead our Wall Street beholden leaders chose to save their banker friends, cover-up the bad debt, shift private debt to taxpayer debt, print trillions of new dollars in an effort to inflate away the debt, and implemented every wacky Keynesian stimulus idea Larry Summers could dream up.  These strokes of genius have failed miserably. Bernanke, Paulson, Geithner and Obama have set in motion a series of events that will ultimately lead to a catastrophic currency collapse. We have entered the 2nd phase of the Greater Depression and there are no monetary or fiscal bullets left in the gun. Further expansion of debt will lead to a hyperinflationary collapse as the remaining confidence in the U.S. dollar is exhausted. We are one failed Treasury auction away from a currency crisis.

John Maynard Keynes argued the solution to the Great Depression was to stimulate the economy through some combination of two approaches: a reduction in interest rates and government investment in infrastructure. Investment by government injects income, which results in more spending in the general economy, which in turn stimulates more production and investment involving still more income and spending and so forth. The initial stimulation starts a cascade of events, whose total increase in economic activity is a multiple of the original investment.

It sounds so good in theory, but it didn’t work in the Depression and it hasn’t worked today. It is a doctrine taught in every business school in America with no actual results to support it. Who needs facts and actual results when a good story believed and perpetuated by non-thinking pundits will do? Every Keynesian play in the playbook has been used since 2008. The American people were told by Obama and his Keynesian trained advisors that if we implemented his $862 billion shovel ready stimulus package, unemployment would peak at 7.9% and would decline to 6.5% by today. The cascade of recovery was going to be jump started by a stimulus package that equaled 27% of the previous year’s entire spending. Obama’s complete package was implemented. The outcome was an eye opener. If you show a Keynesian this chart, their response would be: “Imagine how bad it would have been if we didn’t spend the $862 billion.”


John Maynard Obama got everything he asked for in January 2009. He had both houses in Congress and did not need to consult Republicans to pass his Keynesian $862 billion porkulus bill. It seems that $252 billion, or 29% of the package was nothing more than transfer payments. Of course, according to Keynesians, the $252 billion should have had a multiplier effect when it was handed out. I think they were right. Obama was able to multiply the number of people on food stamps in January 2009 from 32 million to the current tally of 45.8 million. The monthly food stamp transfer payment has gone from $3.6 billion to $6.1 billion. Keynesians should be thrilled by this success story.

 [Review & Outlook]

Obama’s Keynesian dream bill included:

  • $1 billion for Amtrak, the federal railroad that hasn’t turned a profit in 40 years.
  • $2 billion for child-care subsidies.
  • $50 million for that great engine of job creation, the National Endowment for the Arts.
  • $400 million for global-warming research.
  • $2.4 billion for carbon-capture demonstration projects.
  • $650 million on top of the billions already doled out to pay for digital TV conversion coupons.
  • $8 billion for renewable energy funding.
  • $6 billion for mass transit that had a low or negative return on investment.
  • $600 million more for the federal government to buy new cars. Uncle Sam already spends $3 billion a year on its fleet of 600,000 vehicles.
  • Congress earmarked $7 billion for modernizing federal buildings and facilities.
  • The Smithsonian received $150 million.
  • The Department of Education got $66 billion, more than the entire Education Department spent a just 10 years ago. $6 billion of this subsidized university building projects.

Obama declared in December 2008 there were shovel ready projects across the land that would create immediate jobs. Too bad he didn’t tell the American public only $30 billion of the $862 billion mountain of pork was earmarked for highways and bridges. Obama declared his stimulus would create 3.5 million jobs, later changed to “create or save”. There were 144 million Americans employed in January 2009. Today, there are 139 million Americans employed. Obama gives the term “success story” a new meaning. The Keynesians had their chance and now they want a do-over. Sorry, that isn’t how it works in the real world. As Speaker Nancy Pelosi put it, “We won the election. We wrote the bill.” No truer words have ever been spoken.

As we know, that was only the beginning of our Keynesian debt nightmare. Let’s do some critical thinking and assess the results of Obama’s other Keynesian solutions:

  • The Homebuyer Tax Credit cost taxpayers $27 billion or $43,000 per additional house sold. The Keynesians handed 3.9 million people $7,000 to do something they were going to do anyway. They lured first time home buyers into the market. Since the credit expired, median home prices have fallen $15,000 and continue to fall. This wonderful government program has created more underwater homeowners and did nothing to stabilize the housing market or home prices.
  • Cash for Clunkers cost taxpayers $3 billion. An incremental 125,000 cars were sold at a cost of $24,000 per car. This Keynesian dream program lured more people into debt and warped the used car market by destroying used cars and driving up prices for poor people who couldn’t afford a new car. There were no carryover benefits except for government controlled union car makers.
  • Obama’s HAMP program allocated $11 billion to supposedly allow 4 million homeowners to modify their mortgages, reduce their monthly mortgage payments and avoid foreclosure. HAMP has proven a colossal failure that has done more to harm than help debt-laden homeowners. It has achieved slightly more than 500,000 permanent modifications, 40% of which the Treasury expects to default. Far more borrowers have dropped out of the program than successfully achieved permanent loan modification. These borrowers, along with those who later default, will often be left with larger outstanding debt, worse credit scores, and less home equity.
  • Obama even handed $30 billion to the largest homebuilder corporations in the country, run by billionaires like Bob Toll, by allowing them to carry back their losses and wipe out tax liabilities in prior years. This did wonders for the housing market. It did stimulate bonus payments for the CEOs of these companies.
  • Billions of tax revenue was lost by handing out $1,500 tax credits for people to buy new windows, doors, and appliances they were going to buy anyway. We are still waiting for that multiplier effect.

The usual suspects are now declaring that we can’t make the same mistakes FDR made in 1937 resulting in a dramatic downturn in 1938. As usual, the Keynesian storyline about the Great Depression is false.

Depression Keynesian Fallacy

One thing to remember is that while the depression that started in 1929 may have come to a bottom in 1933, it took a long time to recover. There was a cyclical recovery in 1937, and why was that? Roosevelt had the good luck to have been elected dead flat at the bottom. So it wasn’t his policies that cured the last depression, it was luck and good timing, combined with the fact that they were creating a lot of money after Roosevelt took the dollar off the gold standard. That resulted in a false recovery, from 1933 to 1937, and it went downhill again. – Doug Casey   


Keynes′ theory suggested that active government policy could be effective in managing the economy. Rather than seeing unbalanced government budgets as wrong, Keynes advocated what has been called countercyclical fiscal policies, that is, policies that acted against the tide of the business cycle: deficit spending when a nation’s economy suffers from recession or when recovery is long-delayed and unemployment is persistently high—and the suppression of inflation in boom times by either increasing taxes or cutting back on government outlays. He argued that governments should solve problems in the short run rather than waiting for market forces to do it in the long run. Keynes had too much faith in the wisdom of politicians and Federal Reserve bankers. They mastered the art of deficit spending, but fell a little short on paying off the debts during boom times. About $14.6 trillion short so far.

The Great Depression had the same origins as our current Greater Depression. The three Republican administrations of the 1920s practiced laissez-faire economics, starting by cutting top tax rates from 77% to 25% by 1925. Non-intervention into business and banking became government policy. These policies led to overconfidence on the part of investors and a classic credit-induced speculative boom. Gambling in the markets by the wealthy increased. While the haves got richer, millions of have-nots lived below the household poverty line of $2,000 per year. The rip roaring party came to an abrupt end in October 1929, with the Great Stock Market Crash.

Between 1929 and 1932, the market fell 89% from its high. The Keynesian storyline is that Herbert Hoover’s administration did nothing to try and revive the economy. It took Franklin Delano Roosevelt and his New Deal Keynesian policies to save the country. It’s a nice story, but entirely phony. Between 1929 and 1933 the Hoover administration increased real per-capita federal expenditures by 88%, not exactly the austerity measures described in fantasy stories concocted by the mainstream media.  

Bureau of Economic Analysis National Income and Product Accounts Table

Table 1.1.6A. Real Gross Domestic Product, Chained (1937) Dollars [Billions of chained (1937) dollars]
 
 1929 
 1930 
 1931 
 1932 
 1933 
 1934 
 1935 
 1936 
 1937 
 1938 
 1939 
Gross domestic product
87.3
79.8
74.6
64.9
64.0
71.0
77.3
87.4
91.9
88.7
95.9
Personal consumption expenditures
63.1
59.7
57.8
52.6
51.5
55.1
58.5
64.5
66.8
65.8
69.4
Gross private domestic investment
12.2
8.1
5.1
1.5
2.3
4.1
7.6
9.7
12.2
8.0
10.3
Net exports of goods and services
0.8
0.4
0.2
0.0
-0.1
0.2
-0.5
-0.3
0.1
0.9
1.0
Government consumption expenditures and gross investment
9.2
10.2
10.6
10.2
9.9
11.1
11.5
13.4
12.8
13.8
15.0


The Great Depression officially lasted from 1929 until 1940. What is not well known is that real GDP was at the same level in 1936 as it had been in 1929. In no small part because real GDP soared by 37% between 1933 and 1936. The unemployment rate in 1929 was 5%. In 1936, even after real GDP had recovered to pre-depression levels, the unemployment rate was still 15%. It spiked back to 18% in 1938 and stayed above 15% until World War II. Tellingly, in 1936, private domestic investment was 21% below the level of 1929. 

By contrast, government expenditures surged by 46% between 1929 and 1936. With the government creating new agencies and employing people in make-work projects, private industry was crowded out. The extensive governmental economic planning and intervention that began during the Hoover administration swelled drastically under Roosevelt. The bolstering of wage rates and prices, expansion of credit, propping up of weak firms, and increased government spending on public works prolonged the Great Depression.

The facts powerfully contradict the notion endorsed by Krugman and other Keynesian devotees that the supposed 1937-38 Depression within the Great Depression was caused by Roosevelt slashing spending. In fact, real GDP only dropped by 3.5% in 1938 and rebounded by 8.1% in 1939. What actually collapsed in 1938 was private investment, which fell 34%. By contrast, government spending declined by only 4.5% in 1938, proving that Roosevelt did not drastically cut spending. To the extent that he eased up on the accelerator, it was by cutting back on useless jobs programs like those provided by the Works Progress Administration and the Public Works Administration. Austerity did not derail the recovery.

The reason private investment collapsed in 1938 was Roosevelt’s anti-business crusade. He denounced big business as the cause of the Depression. In March 1938, FDR appointed Yale University law professor Thurman Arnold to head the antitrust division of the Justice Department. Arnold soon hired some 300 lawyers to file antitrust lawsuits against businesses. Arnold launched cases against entire industries, with lawsuits against the milk, oil, tobacco, shoe machinery, tires, fertilizer, railroad, pharmaceuticals, school supplies, billboards, fire insurance, liquor, typewriter, and movie industries.

Paul Krugman’s recent veiled yearning for a war or staged crisis to revive the economy through spending to fight the war is another Keynesian fallacy perpetuated by the mainstream media. These mindless non-critical thinking talking heads actually believe World War II ended the Great Depression. Doug Casey obliterates their fantasy:

“People say that World War II cured the Depression, but in fact, it made it worse. As bad as things were in the ‘30s, they were worse during the war in the ‘40s. You couldn’t get shoes. You couldn’t get gasoline. You couldn’t get tires. You couldn’t get just about anything that was being used for the war. The war prolonged and deepened the Depression. The thing that ended the Depression was not the war but the fact that since people could not consume, they were forced to save. That delayed consumption resulted in a huge amount of savings, and that’s what caused the recovery in the late 1940s.


The fact that the entire world was left in smoldering ruins after World War II, except for the United States, may have contributed slightly to our recovery from the Great Depression.

According to Murray Rothbard, in his book America’s Great Depression, the artificial meddling in the economy was a disaster prior to the Great Depression, and government efforts to prop up the economy after the crash of 1929 only made things far worse. Government intrusion delayed the market’s correction and made the road to complete recovery more difficult. Today’s myopic politicians, captured monetary authorities and Harvard trained Keynesian economists have learned the wrong lessons from the Great Depression. The upshot will be a second Greater Depression and further impoverishment of the dwindling middle class. The implications of more wasteful government stimulus programs, more quantitative easing and more debt are: further debasement of the currency and ultimately a hyperinflationary collapse. The great economist John Maynard Keynes understood currency debasement:

“There is no subtler, no surer means of overturning the existing basis of society than to debauch the currency. The process engages all the hidden forces of economic law on the side of destruction, and does it in a manner which not one man in a million is able to diagnose.”

How to Cut Spending While Actually Increasing Spending

“Those to whom the system brings windfalls, beyond their deserts and even beyond their expectations or desires, become ‘profiteers,’ who are the object of the hatred of the bourgeoisie, whom the inflationism has impoverished, not less than of the proletariat. As the inflation proceeds and the real value of the currency fluctuates wildly from month to month, all permanent relations between debtors and creditors, which form the ultimate foundation of capitalism, become so utterly disordered as to be almost meaningless; and the process of wealth-getting degenerates into a gamble and a lottery.” – John Maynard Keynes – The Economic Consequences of the Peace

Obama’s plan to revive America will be announced with great fanfare in two weeks. We know for sure he will propose these two brilliant ideas:

  • Extending unemployment compensation again at a total 2012 cost of $65 billion. Because we know that paying people to not work creates millions of jobs. The multiplier effect is off the charts. Why work when you can watch The View and chow down on cheese doodles purchased with your SNAP card for 99 weeks?
  • Extending the payroll tax cut at a total 2012 cost of $100 billion. This was supposed to give a dramatic boost to the economy in FY11. Have you noticed any boost? A Keynesian will argue, “Imagine if we hadn’t done it.” A critical thinker might ask: Is it prudent to increase the unfunded Social Security liability by another $100 billion and hand the bill to future unborn generations, so we can buy a new IPod 2 today?

It is a certainty that Obama will announce an infrastructure bank or some variation to spur investment in our national infrastructure that is crumbling by the day. Top Keynesian, and architect of the Obama stimulus plan, Larry Summers has been blathering about this for months. Even though the first stimulus plan was sold as an infrastructure plan, they mean it this time. As usual, the storyline is false. You can’t drive anywhere in this country and not be inconvenienced by road widening, bridge building, and repaving projects. The Keynesians act like infrastructure projects are highly unusual and need new Federal dollars to jump start the engine. The fact is that every Federal, State and municipal government has a capital fund that is budgeted every year. Most of the projects have multiple year lead times. They require planning and coordination. The reason we have 160,000 structurally deficient or obsolete bridges and thousands of miles of crumbling underground pipes is because politicians decided to spend their budgets on something more useful like train museums, murals, turtle crossings, and studies on the mating habits of ferrets.

The country has lost approximately seven million jobs since 2007. Five million of the jobs were lost in sales industries and manufacturing industries. There are 139 million jobs in America today and only seven million, or 5% of all jobs, in the construction industry. How do Keynesians expect to revive the job market with an infrastructure bank that will benefit, at most, 5% of the U.S. workforce? Let me guess. They will propose billions of new spending on education so they can retrain sales clerks from Wal-Mart into architects for designing 160,000 new bridges.

Barack Obama will stand in front of the American people and lie. He is a born again cost cutter, who will propose new spending. As anyone with a calculator can figure out, the two guaranteed proposals from his upcoming speech will increase spending by $165 billion in 2012. If you go back to the handy dandy chart from the CBO showing the “horrific spending cuts” from the recent debt ceiling deal you will see  these “cuts” total $122 billion between 2012 and 2014. Barack will wipe out all of the supposed savings through mid 2015 with his new Keynesian plan. But don’t worry. His plan will have huge spending cuts in 2017 after his hoped for 2nd term is finished. Keynesians always promise to cut spending once their current emergency ends.     

The Keynesians had their chance. They controlled the Presidency and both houses of Congress. A Keynesian runs the Federal Reserve. They implemented everything they proposed. The $862 billion porkulus program, the $700 billion TARP program, home buyer tax credits, energy efficiency credits, loan modification programs, zero interest rates, QE1 and QE2. They increased social welfare transfers for Social Security, Unemployment Compensation, food stamps, Medicare, Medicaid, and Veterans by $600 billion since 2007, a 35% increase in four years. No one has foiled their plans. The Tea Party didn’t really exist until 2010. They didn’t lose the House until November 2010. They cannot blame the Tea Party extremists, but they do.

The Keynesians have successfully increased Federal spending by $1.1 trillion, or 41% since 2007, and are running deficits exceeding 10% of GDP, but they call the Tea Party extremists. Domestic investment is still 9% below 2008 levels as the Federal government has crowded out the small businesses that create the jobs in this country. And now the Keynesians declare we need more stimulus, more programs, more debt, more quantitative easing and lower interest rates. It just wasn’t enough the first time. You have to give the Keynesians credit. Despite the utter absolute failure of every scheme they have implemented, they will worship their models and theories until they successfully collapse our economic system. Then they’ll blame the Tea Party terrorists who foiled their plans.

None of the Keynesian solutions worked during this crisis, just as they didn’t work during the Great Depression. The solution was simple, yet painful. The banking system needed to be saved, not the banks. The bad debt needed to be purged from the system. Wall Street criminals needed to be prosecuted. Bondholders and stockholders needed bear the losses from their foolish investments. Saving and investment in the country needed to be encouraged, while borrowing and consuming needed to be discouraged. Our leaders have failed to lead. The American people have failed to accept the consequences of their actions. And now we are going to pay a heavy price as Ludwig von Mises predicted:

“There is no means of avoiding the final collapse of a boom brought about by credit (debt) expansion. The alternative is only whether the crisis should come sooner as the result of a voluntary abandonment of further credit (debt) expansion, or later as a final and total catastrophe of the currency system involved.”