

If you don’t like to read detailed analysis of why the stock market is overvalued by 80%, here is the key paragraph from Doctor Hussman:
The price/revenue ratio of the S&P 500 has reached 1.5, compared with a historical norm of just 0.8 prior to the late-1990’s bubble. The Shiller P/E (S&P 500 divided by the 10-year average of inflation-adjusted earnings) remains near 24. Importantly, despite weak earnings at various points over the past decade, the denominator of the Shiller P/E remains well within the historical growth channel that has contained Shiller earnings historically. In other words, the Shiller P/E is not being biased upward by an unusually low denominator. If anything, the ratio of “Shiller earnings” to S&P 500 revenues is among the highest in history, so much like other price/earnings measures, even the Shiller P/E is biased downward by elevated profit margins in recent years. That said, the Shiller P/E is essentially a useful shorthand for discussion purposes, as we use numerous other measures in practice that have an equal or stronger relationship with S&P 500 total returns. I continue to view the S&P 500 as being about 80% above the level that would be associated with “fair value”, but that’s simply another way of saying that I expect annual S&P 500 total returns to average little more than 3% nominal over the coming decade. Valuations are not a timing tool, but in a mature, overbought half-cycle, where advisory bulls dramatically outpace bears, my impression is that the likelihood of a long and pleasant future for stocks is quite low, at least until much more reasonable valuations are established.
Know when to hold em and know when to fold em.
Following the Fed to 50% Flops
John P. Hussman, Ph.D.
One of the most strongly held beliefs of investors here is the notion that it is inappropriate to “Fight the Fed” – reflecting the view that Federal Reserve easing is sufficient to keep stocks not only elevated, but rising. What’s baffling about this is that the last two 50% market declines – both the 2001-2002 plunge and the 2008-2009 plunge – occurred in environments of aggressive, persistent Federal Reserve easing.
It’s certainly true that favorable monetary conditions are helpful for stocks, on average. But that average hides a lot of sins.
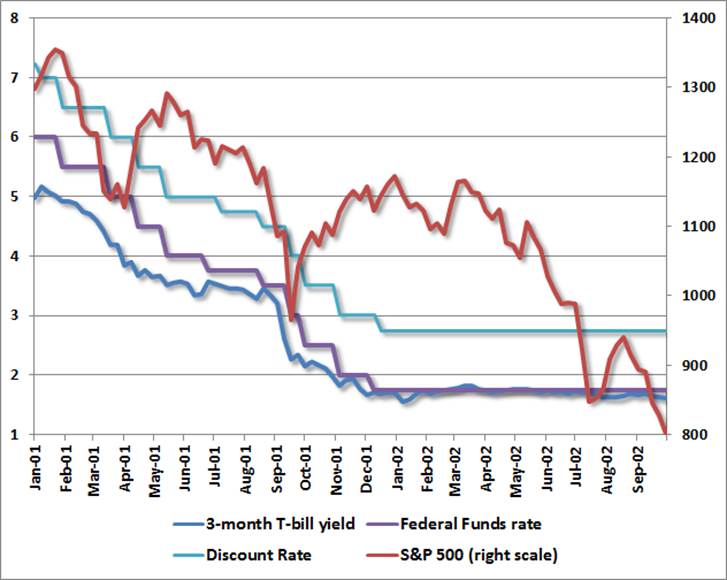
There are many ways to define monetary conditions using policy rates, market yields, and variables such as the monetary base or other aggregates. But given the strong relationship between monetary base/GDP and interest rates, these measures overlap quite a bit, and the results are quite general regardless of the precise definition. For discussion purposes, we’ll define “favorable” monetary conditions here as: either the Federal Funds rate, the Discount Rate, or the 3-month Treasury bill yield lower than 6 months prior, or the last move in the Fed Funds or Discount Rate being an easing. Historically, this captures about 52% of historical periods. During these periods, the total return of the S&P 500 averaged 13.5% annually, versus just 8.8% annually when monetary conditions were not favorable.
This is a worthwhile distinction, but it doesn’t partition the data enough to separate out periods where the average return on the S&P 500 was below Treasury bills. So historically, using this indicator alone would have suggested holding stocks regardless of monetary conditions. One might expect to do better by taking a leveraged exposure during favorable monetary conditions, and a muted exposure during unfavorable conditions, but this strategy would have invited intolerable risks. Strikingly, the maximum drawdown of the S&P 500, confined to periods of favorable monetary conditions since 1940, would have been a 55% loss. This compares with a 33% loss during unfavorable monetary conditions. This is worth repeating – favorable monetary conditions were associated with far deeper drawdowns.
If this all seems preposterous and counterintuitive, consider the last two market plunges. While investors seem to have forgotten this inconvenient history, the 2001-2002 market plunge went hand-in-hand with continuous and aggressive monetary easing.
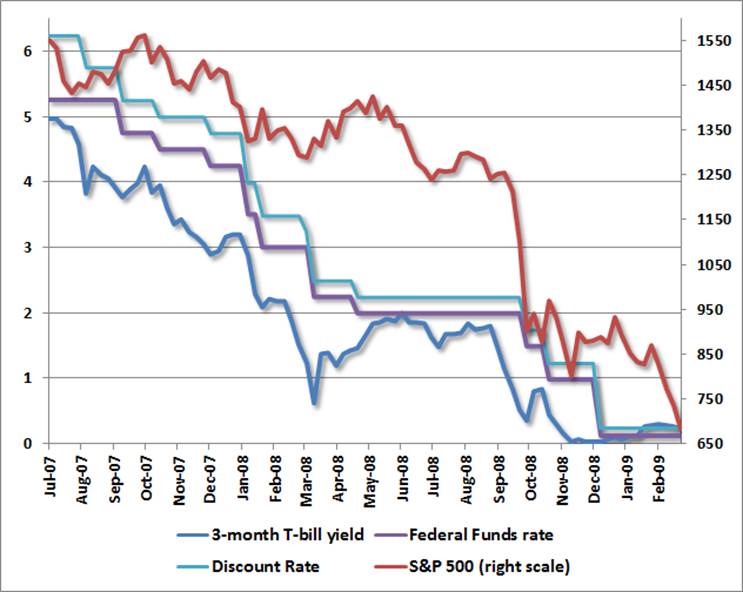
Ditto for the 2008-2009 market plunge. Persistent monetary easing did nothing to prevent a 55% collapse in the S&P 500.
From an asset allocation perspective, even simple trend-following methods have performed far better historically than following monetary policy. For example, since 1940, when the S&P 500 has been above its 200-day moving average, the total return of the index has averaged 14.2% annually, versus just 4.5% when the index has been below its 200-day average. That separation in returns is meaningful, because the return during periods of unfavorable trends did not exceed Treasury bill returns, so it would not have harmed long-term performance to be out of the market during those periods (at least, before transaction costs, taxes and slippage). The deepest loss of the S&P 500, confined to periods of “favorable” trends and reflecting occasional whipsaws, was -26%, versus -53% during unfavorable trends.
As I noted a few weeks ago (see Aligning Investment Exposure with the Expected Return/Risk Profile), all of the net historical benefit of favorable trend-following has occurred in periods where “overvalued, overbought, overbullish” characteristics have been absent. In the presence of this syndrome, the average total return of the S&P 500 collapses below Treasury bill yields, on average. The same is true, on average, when favorable monetary conditions are coupled with overvalued, overbought, overbullish features.
Hands-down, the worst-case scenario is a market that comes off of such overextended conditions and then breaks trend-support in the context of an economic downturn. That’s not something we observe at present, but it is something to keep in mind, as I doubt that we will avoid that sequence over the completion of the current market cycle.
Part of the reason that monetary policy was so ineffective during 2001-2002 and 2008-2009 is that these market collapses were preceded by overvalued, overbought, overbullish euphoria, and then gave way to economic downturns. Though monetary policy certainly fed the preceding bubbles, monetary policy did not prevent or halt those recessions, and those recessions were not broadly recognized until stocks had already lost about 30% of their value. At least in post-war data (Depression-era data is more challenging), the proper investment approach has generally been to accept market risk in the presence of favorable market action, particularly if monetary conditions are supportive, to start walking when overvalued, overbought, overbullish conditions emerge, and to run once momentum rolls over (as it has already). There’s a grey area when such overextended conditions are cleared, which can allow for recovery rallies if market action is still supportive. But regardless of monetary policy, investors should avoid risk in richly-valued environments once market action deteriorates, and buckle up hard on signs of economic weakness once an overvalued market loses trend support.
The following point should not be missed. I am not saying that monetary conditions are unimportant. Indeed, provided that trend-following conditions are favorable and overvalued, overbought, overbullish conditions are absent, favorable monetary conditions have contributed to stronger total returns for the S&P 500, and reduced periodic losses, in data since 1940. Favorable monetary conditions are most useful in confirming and supporting favorable evidence on other measures. My concern here, however, is that investors seem to believe that favorable monetary conditions are a veto against all other possible risks, regardless of whether those risks are financial (e.g. overvalued, overbought, overbullish conditions) or economic. This is dangerously incorrect.
There is no question that Fed action can affect economic outcomes when it relaxes some economic constraint that is actually binding (for example, during bank runs, when Fed-provided liquidity is essential). But there is little evidence of any transmission mechanism whereby a greater supply of idle bank reserves promises to make a dent in the economy beyond occasional and short-lived can-kicks. There is also no question that interest rates matter, given that stocks must compete with bonds. But stocks are much longer duration securities than investors seem to appreciate, and the relationship between stock yields and interest rates is not even close to one-to-one, despite what Fed Model proponents might suggest.
Even so, investors have come to believe that there is a direct cause-and-effect link from monetary easing to rising security prices. The historical evidence is much less supportive. Interestingly, if we look at conditions that have been most generally hostile for stocks on average (S&P 500 below its 200-day moving average, or overvalued, overbought, overbullish conditions in place), more than half of these periods were accompanied by “favorable” monetary conditions. Stocks proceeded to underperform Treasury bills anyway, on average, with steep interim losses.
Conversely, monetary conditions have been unfavorable in nearly half of historical periods where trends were supportive and overvalued, overbought, overbullish features were absent. In those periods, the average total return of the S&P 500 was still quite strong, and returns were only slightly lower than when monetary conditions were favorable under otherwise similar conditions (15.6% vs. 18.9% at an annual rate), while periodic drawdowns increased only slightly.
So again, the point is not that favorable monetary conditions are irrelevant. The point is that they are not omnipotent – and that the most severe market losses on record have been accompanied by aggressive easing. Without question, quantitative easing has been very effective in suppressing spikes in risk premiums in recent years. More recently, it has been effective in removing any perception that stocks have risk and creating the impression that easy money is enough to override every possible economic or financial concern. But that is where perception has moved beyond reality. There is no evidence in the historical record for such optimism. Indeed, even the recovery from the 2009 lows was more directly linked to the change by the Financial Accounting Standards Board to eliminate “mark-to-market” accounting (keeping banks from insolvency even if they were technically insolvent) and the shift to an outright guarantee of Fannie Mae and Freddie Mac debt by the U.S. Treasury. It is superstition to believe that monetary easing is a panacea. Investors who recognize (actually, simply remember) this now are likely to fare better than those who are forced to relearn it later.
Needless to say, all of this will be summarily ignored by speculators who have been rewarded by the strategy of following the Fed in a mature, overvalued, overbought, overbullish, unfinished half-cycle that recently hit new highs. Advice from Kenny Rogers – you never count your money when you’re sittin’ at the table.
Economic Notes
We’re observing some very wide dispersion in regional economic surveys in recent reports. On one hand, the Chicago Purchasing Managers Index surged to 58.7 last month, with the important new orders component jumping to 58.1 (a level of 50 on the PMI is neutral). This sort of strength, if sustained over several months and joined by strength in the Philadelphia Fed index, would help to ease our economic concerns here, as several months of strength on these two measures are among the more reliable leading indicators of economic shifts.
On the other hand, in nearby Milwaukee, the PMI collapsed from 48.4 to 40.7, while the Philadelphia Fed index itself dropped into negative territory, falling from +1.3 to -5.2, with the new orders component deteriorating from -1.0 to -7.9. That general weakness was much more in line with what we’re observing from other surveys, including the Chicago Fed National Activity Index, Empire Manufacturing, Dallas Fed, and Richmond Fed.
When we plot “outliers” (where the Chicago PMI deviates from the average of the other surveys), against subsequent changes in the Chicago PMI, what results is a clearly downward-sloping scatter, meaning that positive outliers, as we presently observe, are typically corrected by subsequent disappointments in the Chicago PMI. Conversely, however, outliers in the Chicago PMI are typically not related to subsequent positive surprises in the other indices. Again, joint strength in the Chicago PMI New Orders component and the Philly Fed index, sustained over a period of 3-4 months, does tend to lead broader improvements. This is not what we observe here.
In short, the coincident and leading economic evidence is deteriorating, not improving. Even the chart below incorporates a strong Chicago PMI figure that appears to be a temporary outlier. Employment data is a well-known lagging indicator, and is always somewhat “rear-view”, but it’s fair to say that given what is now the lowest labor participation rate in 30 years, the relatively restrained level of new claims for unemployment has been a bright spot.
It seems to be universally assumed that surprisingly strong data on the economic and jobs front would pose the greatest risk to the market, as it would accelerate the “taper” of quantitative easing. To the contrary, the largest risk here would be an acceleration of disappointing economic data, as it would further reinforce the case made by former Fed Chairman Paul Volcker that the benefits of quantitative easing are “limited and diminishing.” Disappointments on the economic front may be met with knee-jerk enthusiasm. But the quickest path to an extended bear market would be a deteriorating economy, coupled with recognition that quantitative easing has an even weaker benefit/cost tradeoff than is already plain.
The foregoing comments represent the general investment analysis and economic views of the Advisor, and are provided solely for the purpose of information, instruction and discourse. Only comments in the Fund Notes section relate specifically to the Hussman Funds and the investment positions of the Funds.
Fund Notes
Investors, like the proverbial frog, invariably wish to remain in a boiling pot as long as possible. But as I noted a few weeks ago, very few live frogs can be pulled from a boiling pot once a syndrome of overvalued, overbought, overbullish market conditions is coupled with a deterioration in the market’s momentum. When we examine the set of historical periods where the market has been overvalued, overbought, and overbullish even to a lesser extent, very few instances have been followed by positive returns once measures of price momentum deteriorate. This is the situation we presently observe.
The price/revenue ratio of the S&P 500 has reached 1.5, compared with a historical norm of just 0.8 prior to the late-1990’s bubble. The Shiller P/E (S&P 500 divided by the 10-year average of inflation-adjusted earnings) remains near 24. Importantly, despite weak earnings at various points over the past decade, the denominator of the Shiller P/E remains well within the historical growth channel that has contained Shiller earnings historically. In other words, the Shiller P/E is not being biased upward by an unusually low denominator. If anything, the ratio of “Shiller earnings” to S&P 500 revenues is among the highest in history, so much like other price/earnings measures, even the Shiller P/E is biased downward by elevated profit margins in recent years. That said, the Shiller P/E is essentially a useful shorthand for discussion purposes, as we use numerous other measures in practice that have an equal or stronger relationship with S&P 500 total returns. I continue to view the S&P 500 as being about 80% above the level that would be associated with “fair value”, but that’s simply another way of saying that I expect annual S&P 500 total returns to average little more than 3% nominal over the coming decade. Valuations are not a timing tool, but in a mature, overbought half-cycle, where advisory bulls dramatically outpace bears, my impression is that the likelihood of a long and pleasant future for stocks is quite low, at least until much more reasonable valuations are established.
Strategic Growth remains fully hedged, and the recent decline has taken the market to or below the “staggered” strike prices that we established at higher levels on the index put option side of our hedge, raising the value of those options toward 2% of Fund value at present. While recent Fund returns have been primarily driven by differences in performance between the stocks held by the Fund and the indices we use to hedge, the impact of these index put options will likely become a source of day-to-day Fund variability if a market decline takes them significantly in-the-money. This can create a give-and-take profile in day-to-day returns, where a sharp market decline may benefit those put options one day, and a market advance the next may withdraw that benefit. My suggestion here is to take day-to-day fluctuations with something of a grain of salt, because if this sort of give-and-take profile emerges, it will most likely be because a market decline has taken the Fund’s put options “in-the-money,” and market action is generally validating a defensive stance. My strongest concern in early declines from overbought peaks is the tendency for selling to become indiscriminate. Our staggered strike hedge is largely insurance against that potential risk here.
Of course, we do shift our strike prices opportunistically, and I expect to lessen or remove portions of our hedges as constructive evidence emerges. As I’ve often noted, the most likely opportunity to accept a greater exposure to market fluctuations would be a moderate retreat in valuations coupled with a firming of market internals, and the absence of an overvalued, overbought, overbullish syndrome of conditions. I have little doubt that we will observe such combinations of evidence during the completion of the present market cycle, not to mention future ones.
Meanwhile, Strategic International remains fully hedged, and Strategic Dividend Value remains hedged at about 50% of the value of its stock holdings. In Strategic Total Return, we boosted our duration slightly on the recent spike in Treasury yields, bringing the Fund’s duration to about 3.5 (meaning that a 100 basis point move in interest rates would be expected to impact Fund value by about 3.5% on the basis of bond price fluctuations. Conversely, we are observing a growing tendency toward risk aversion from a variety of sectors such as corporate debt, and the combination of higher Treasury yields and lower inflation pressures tends not to be as supportive as we would like for precious metals shares, despite what we see as undervaluation. Balancing these considerations, we scaled our precious metals position below 10% of assets for a while.


“NEVER COUNT YOUR MONEY WHILE YOUR SITTIN AT THE TABLE”
—-article headline
The second “your” should be “you’re.” Damnit, Admin, how many times do I need to correct you on this egregious violation of proper English? 10? 20?
Watcha talking about old man? You’re eyes must be going.
My my,
Here we have SUCKUP the English major lifer who responded to fool with vulgarity which referred to oral sex.
Must be reviewing his GED lessons.
Huge Manufacturing ISM Miss And Lowest Print Since June 2009 Sends Markets Soaring
Submitted by Tyler Durden on 06/03/2013 10:13 -0400
So much for the Chicago PMI 8 Sigma renaissance. Moments ago the Manufacturing ISM came out and confirmed that all those “other” diffusion indices were correct, except for the “data” out of Chicago (yes, shocking). Printing at a contractionary 49.0, this was a drop from 50.7, well below expectations of 51.0 (and far below the cartoonish Joe Lavorgna’s revised 53.0 forecast). More importantly, this was the worst ISM headline print since June 2009, the first sub-50 print since November 2012, while the New Orders of 48.8, was the worst since July 2012. Both Production and Backlogs tumbled by -4.9 and -5.0 to 48.6, and 48.0 respectively. In brief, of the 11 series tracked by the ISM, only 3 posted a reading over 50 in May. This compares to just 2 out of 11 that were below 50 in April. Oh well, so much for this recovery. But the good news for the market is that today is really bad news is really good news day, and stocks have soared as according to the vacuum tubes, the result means no taper. The farce must go on.
Japan may be setting the example. If so, the US market has another spike left in it before it contracts in earnest.
Posted 2013-06-03 10:06
by Karl Denninger
ISM: Goodnight (49%)
This number sucks.
The report was issued today by Bradley J. Holcomb, CPSM, CPSD, chair of the Institute for Supply Management™ Manufacturing Business Survey Committee. “The PMI™ registered 49 percent, a decrease of 1.7 percentage points from April’s reading of 50.7 percent, indicating contraction in manufacturing for the first time since November 2012 and only the second time since July 2009. This month’s PMI™ reading is at its lowest level since June 2009, when it registered 45.8 percent. The New Orders Index decreased in May by 3.5 percentage points to 48.8 percent, and the Production Index decreased by 4.9 percentage points to 48.6 percent. The Employment Index registered 50.1 percent, a slight decrease of 0.1 percentage point compared to April’s reading of 50.2 percent. The Prices Index registered 49.5 percent, decreasing 0.5 percentage point from April, indicating that overall raw materials prices decreased from last month. Several comments from the panel indicate a flattening or softening in demand due to a sluggish economy, both domestically and globally.”
Oops.
New orders, production, deliveries, inventories, customer inventories, prices, backlog — all negative (under 50.) Employment was 50.1, edging down from 50.2 and flirting with negative territory.
This is a crap report — period — and in addition posted up a bunch of “1”s on the trends (number of months in trend.)
That is, a shift in trend.
The regional fed surveys have pointed to trouble here for a while — now it’s becoming realized in the national data.
I expect the market pumpers will try to spin this as “Fed will continue to pump in money” and likely bounce the market somewhat, but I’d be careful with the initial reaction — there’s an awful lot of crack smoking going on in the belief that The Fed can actually help the economy.
After all, if they could with their bond-buying games, why haven’t they?
tool on the hill
Bite me.
Friday’s Drop Was Just a Hint Of What’s Coming
Submitted by Phoenix Capital Research on 06/03/2013
The economic gaming continues in the US.
On Friday it was announced that consumer confidence hit its highest level in nearly six years. Indeed, the last time we saw confidence in the economy as this reading was July 2007…
Here’s a riddle… how can consumer confidence be so high when:
Household wealth remains 45% lower than it was before the Crisis?
Incomes are falling?
Prices are generally rising?
Technically we’re all poorer than we were before 2008 happened. Most of us are making less money. And we’re spending more just trying to get by thanks to higher food, energy, and healthcare prices. Heck, housing is now even soaring again, pricing most beginning homebuyers out of the market.
And yet… supposedly we’re all feeling much better about things. Either we’re all delusional… or the data is being massaged to look better than reality.
Against this backdrop, Bernanke continues to talk about how removing stimulus could damage the “recovery.”
This is extraordinary.
We’re five years into a financial crisis. The typical business cycle is 10 years. So just based on historical cycles alone we should be witnessing a roaring recovery by now. And yet, the Fed Chairman is worried that removing stimulus (which is now north of $85 billion by the way) would damage the “recovery.”
Folks this entire mess is one big house of cards that is getting ready to collapse again. The Fed doesn’t have an exit plan. It never had a plan to begin with except to leave the paperweight on the “print” button. The fact that they’re still talking about a recovery five years and $2+ trillion after the Crisis hit makes it clear they’re losing control.
The market is beginning to sense this as Friday’s collapse indicates. As I’ve stated many times in the past weeks, stocks were ready to correct.