RETAIL DEATH RATTLE GROWS LOUDER

The definition of death rattle is a sound often produced by someone who is near death when fluids such as saliva and bronchial secretions accumulate in the throat and upper chest. The person can’t swallow and emits a deepening wheezing sound as they gasp for breath. This can go on for two or three days before death relieves them of their misery. The American retail industry is emitting an unmistakable wheezing sound as a long slow painful death approaches.

It was exactly four months ago when I wrote THE RETAIL DEATH RATTLE. Here are a few terse anecdotes from that article:

The absolute collapse in retail visitor counts is the warning siren that this country is about to collide with the reality Americans have run out of time, money, jobs, and illusions. The exponential growth model, built upon a never ending flow of consumer credit and an endless supply of cheap fuel, has reached its limit of growth. The titans of Wall Street and their puppets in Washington D.C. have wrung every drop of faux wealth from the dying middle class. There are nothing left but withering carcasses and bleached bones.

Once the Wall Street created fraud collapsed and the waves of delusion subsided, retailers have been revealed to be swimming naked. Their relentless expansion, based on exponential growth, cannibalized itself, new store construction ground to a halt, sales and profits have declined, and the inevitable closing of thousands of stores has begun.

The implications of this long and winding road to ruin are far reaching. Store closings so far have only been a ripple compared to the tsunami coming to right size the industry for a future of declining spending. Over the next five to ten years, tens of thousands of stores will be shuttered. Companies like JC Penney, Sears and Radio Shack will go bankrupt and become historical footnotes. Considering retail employment is lower today than it was in 2002 before the massive retail expansion, the future will see in excess of 1 million retail workers lose their jobs. Bernanke and the Feds have allowed real estate mall owners to roll over non-performing loans and pretend they are generating enough rental income to cover their loan obligations. As more stores go dark, this little game of extend and pretend will come to an end.

Retail store results for the 1st quarter of 2014 have been rolling in over the last week. It seems the hideous government reported retail sales results over the last six months are being confirmed by the dying bricks and mortar mega-chains. In case you missed the corporate mainstream media not reporting the facts and doing their usual positive spin, here are the absolutely dreadful headlines:

Wal-Mart Profit Plunges By $220 Million as US Store Traffic Declines by 1.4%

Target Profit Plunges by $80 Million, 16% Lower Than 2013, as Store Traffic Declines by 2.3%

Sears Loses $358 Million in First Quarter as Comparable Store Sales at Sears Plunge by 7.8% and Sales at Kmart Plunge by 5.1%

JC Penney Thrilled With Loss of Only $358 Million For the Quarter

Kohl’s Operating Income Plunges by 17% as Comparable Sales Decline by 3.4%

Costco Profit Declines by $84 Million as Comp Store Sales Only Increase by 2%

Staples Profit Plunges by 44% as Sales Collapse and Closing Hundreds of Stores

Gap Income Drops 22% as Same Store Sales Fall

Ann Taylor Profit Crashes by 75% as Same Store Sales Fall

American Eagle Profits Tumble 86%, Will Close 150 Stores

Aeropostale Losses $77 Million as Sales Collapse by 12%

Big Lots Profit Tumbles by 90% as Sales Flat & Exiting Canadian Market

Best Buy Sales Decline by $300 Million as Margins Decline and Comparable Store Sales Decline by 1.3%

Macy’s Profit Flat as Comparable Store Sales decline by 1.4%

Dollar General Profit Plummets by 40% as Comp Store Sales Decline by 3.8%

Urban Outfitters Earnings Collapse by 20% as Sales Stagnate

McDonalds Earnings Fall by $66 Million as US Comp Sales Fall by 1.7%

Darden Profit Collapses by 30% as Same Restaurant Sales Plunge by 5.6% and Company Selling Red Lobster

TJX Misses Earnings Expectations as Sales & Earnings Flat

Dick’s Misses Earnings Expectations as Golf Store Sales Plummet

Home Depot Misses Earnings Expectations as Customer Traffic Only Rises by 2.2%

Lowes Misses Earnings Expectations as Customer Traffic was Flat

Of course, those headlines were never reported. I went to each earnings report and gathered the info that should have been reported by the CNBC bimbos and hacks. Anything you heard surely had a Wall Street spin attached, like the standard BETTER THAN EXPECTED. I love that one. At the start of the quarter the Wall Street shysters post earnings expectations. As the quarter progresses, the company whispers the bad news to Wall Street and the earnings expectations are lowered. Then the company beats the lowered earnings expectation by a penny and the Wall Street scum hail it as a great achievement.  The muppets must be sacrificed to sustain the Wall Street bonus pool. Wall Street investment bank geniuses rated JC Penney a buy from $85 per share in 2007 all the way down to $5 a share in 2013. No more needs to be said about Wall Street “analysis”.

It seems even the lowered expectation scam hasn’t worked this time. U.S. retailer profits have missed lowered expectations by the most in 13 years. They generally “beat” expectations by 3% when the game is being played properly. They’ve missed expectations in the 1st quarter by 3.2%, the worst miss since the fourth quarter of 2000. If my memory serves me right, I believe the economy entered recession shortly thereafter. The brilliant Ivy League trained Wall Street MBAs, earning high six digit salaries on Wall Street, predicted a 13% increase in retailer profits for the first quarter. A monkey with a magic 8 ball could do a better job than these Wall Street big swinging dicks.

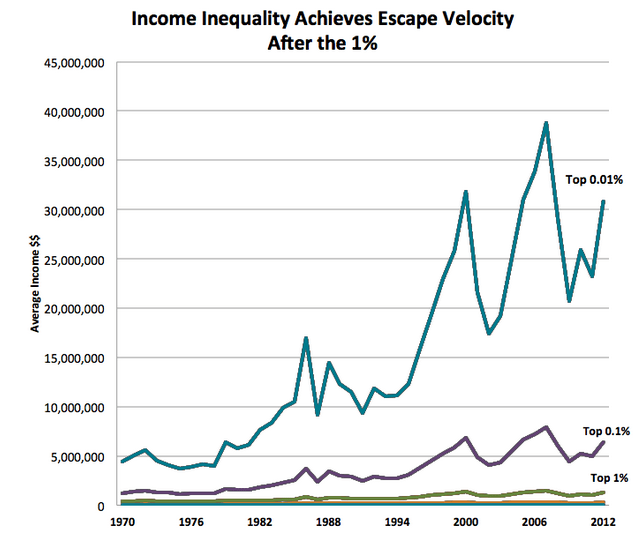
The highly compensated flunkies who sit in the corner CEO office of the mega-retail chains trotted out the usual drivel about cold and snowy winter weather and looking forward to tremendous success over the remainder of the year. How do these excuse machine CEO’s explain the success of many high end retailers during the first quarter? Doesn’t weather impact stores that cater to the .01%? The continued unrelenting decline in profits of retailers, dependent upon the working class, couldn’t have anything to do with this chart? It seems only the oligarchs have made much progress over the last four decades.

Screen-Shot-2014-03-29-at-9.23.25-PM.png

Retail CEO gurus all think they have a master plan to revive sales. I’ll let you in on a secret. They don’t really have a plan. They have no idea why they experienced tremendous success from 2000 through 2007, and why their businesses have not revived since the 2008 financial collapse. Retail CEOs are not the sharpest tools in the shed. They were born on third base and thought they hit a triple. Now they are stranded there, with no hope of getting home. They should be figuring out how to position themselves for the multi-year contraction in sales, but their egos and hubris will keep them from taking the actions necessary to keep their companies afloat in the next decade. Bankruptcy awaits. The front line workers will be shit canned and the CEO will get a golden parachute. It’s the American way.

The secret to retail success before 2007 was: create or copy a successful concept; get Wall Street financing and go public ASAP; source all your inventory from Far East slave labor factories; hire thousands of minimum wage level workers to process transactions; build hundreds of new stores every year to cover up the fact the existing stores had deteriorating performance; convince millions of gullible dupes to buy cheap Chinese shit they didn’t need with money they didn’t have; and pretend this didn’t solely rely upon cheap easy debt pumped into the veins of American consumers by the Federal Reserve and their Wall Street bank owners. The financial crisis in 2008 revealed everyone was swimming naked, when the tide of easy credit subsided.

The pundits, politicians and delusional retail CEOs continue to await the revival of retail sales as if reality doesn’t exist. The 1 million retail stores, 109,000 shopping centers, and nearly 15 billion square feet of retail space for an aging, increasingly impoverished, and savings poor populace might be a tad too much and will require a slight downsizing – say 3 or 4 billion square feet. Considering the debt fueled frenzy from 2000 through 2008 added 2.7 billion square feet to our suburban sprawl concrete landscape, a divestiture of that foolish investment will be the floor. If you think there are a lot of SPACE AVAILABLE signs dotting the countryside, you ain’t seen nothing yet. The mega-chains have already halted all expansion. That was the first step. The weaker players like Radio Shack, Sears, Family Dollar, Coldwater Creek, Staples, Barnes & Noble, Blockbuster and dozens of others are already closing stores by the hundreds. Thousands more will follow.

This isn’t some doom and gloom prediction based on nothing but my opinion. This is the inevitable result of demographic certainties, unequivocal data, and the consequences of a retailer herd mentality and lemming like behavior of consumers. The open and shut case for further shuttering of 3 to 4 billion square feet of retail is as follows:

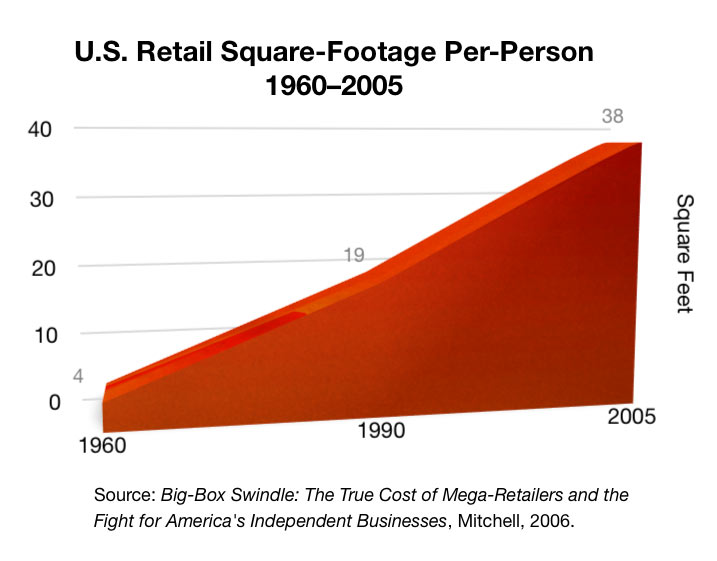
  • There is 47 square feet of retail space per person in America. This is 8 times as much as any other country on earth. This is up from 38 square feet in 2005; 30 square feet in 2000; 19 square feet in 1990; and 4 square feet in 1960. If we just revert to 2005 levels, 3 billion square feet would need to go dark. Does that sound outrageous?

  • Annual consumer expenditures by those over 65 years old drop by 40% from their highest spending years from 45 to 54 years old. The number of Americans turning 65 will increase by 10,000 per day for the next 16 years. There were 35 million Americans over 65 in 2000, accounting for 12% of the total population. By 2030 there will be 70 million Americans over 65, accounting for 20% of the total population. Do you think that bodes well for retailers?

  • Half of Americans between the ages of 50 and 64 have no retirement savings. The other half has accumulated $52,000 or less. It seems the debt financed consumer product orgy of the last two decades has left most people nearly penniless. More than 50% of workers aged 25 to 44 report they have less than $10,000 of total savings.

  • The lack of retirement and general savings is reflected in the historically low personal savings rate of a miniscule 3.8%. Before the materialistic frenzy of the last couple decades, rational Americans used to save 10% or more of their personal income. With virtually no savings as they approach their retirement years and an already extremely low savings rate, do retail CEOs really see a spending revival on the horizon?

  • If you thought the savings rate was so low because consumers are flush with cash and so optimistic about their job prospects they are unconcerned about the need to save for a rainy day, you would be wrong. It has been raining for the last 14 years. Real median household income is 7.5% lower today than it was in 2001. Retailers added 2.7 billion square feet of retail space as real household income fell. Sounds rational.

  • This decline in household income may have something to do with the labor participation rate plummeting to the lowest level since 1978. There are 247.4 million working age Americans and only 145.7 million of them employed (19 million part-time; 9 million self-employed; 20 million employed by the government). There are 92 million Americans, who according to the government have willingly left the workforce, up by 13.3 million since 2007 when over 146 million Americans were employed. You’d have to be a brainless twit to believe the unemployment rate is really 6.3% today. Retail sales would be booming if the unemployment rate was really that low.

  • With a 16.5% increase in working age Americans since 2000 and only a 6.5% increase in employed Americans, along with declining real household income, an inquisitive person might wonder how retail sales were able to grow from $3.3 trillion in 2000 to $5.1 trillion in 2013 – a 55% increase. You need to look no further than your friendly Too Big To Trust Wall Street banks for the answer. In the olden days of the 1970s and early 1980s Americans put 10% to 20% down to buy a house and then systematically built up equity by making their monthly payments. The Ivy League financial engineers created “exotic” (toxic) mortgage products requiring no money down, no principal payments, and no proof you could make a payment, in their control fraud scheme to fleece the American sheeple. Their propaganda machine convinced millions more to use their homes as an ATM, because home prices never drop. Just ask Ben Bernanke. Even after the Bernanke/Blackrock fake housing recovery (actual mortgage originations now at 1978 levels) household real estate percent equity is barely above 50%, well below the 70% levels before the Wall Street induced debt debacle. With the housing market about to head south again, the home equity ATM will have an Out of Order sign on it.

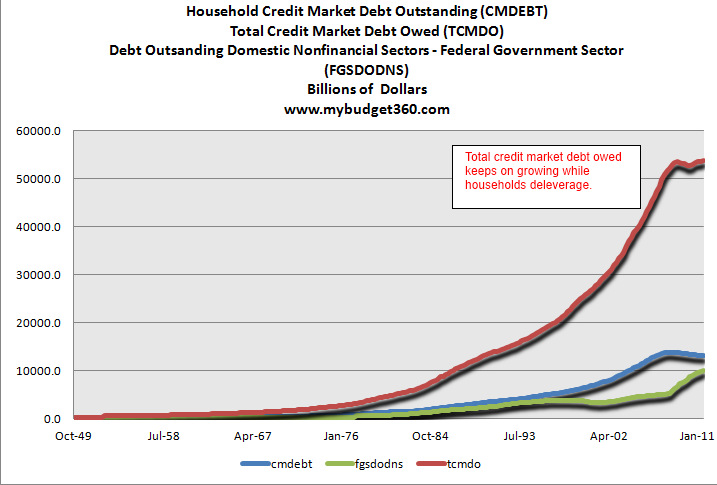
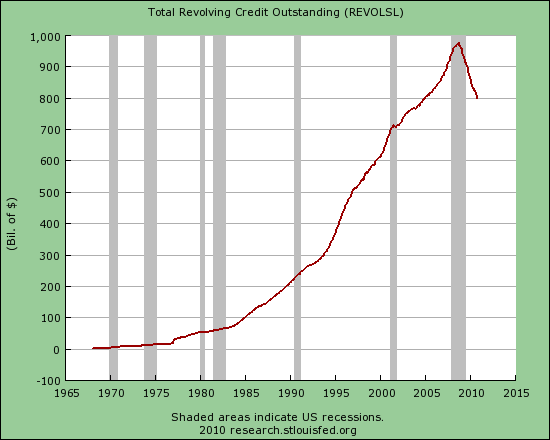
  • We hear the endless drivel from disingenuous Keynesian nitwits about government and consumer austerity being the cause of our stagnating economy. My definition of austerity would be an actual reduction in spending and debt accumulation. It seems during this time of austerity total credit market debt has RISEN from $53.5 trillion in 2009 to $59 trillion today. Not exactly austere, as the Federal government adds $2.2 billion PER DAY to the national debt, saddling future generations with the bill for our inability to confront reality. The American consumer has not retrenched, as the CNBC bimbos and bozos would have you believe. Consumer credit reached an all-time high of $3.14 trillion in March, up from $2.52 trillion in 2010. That doesn’t sound too austere to me. Of course, this increase is solely due to Obamanomics and Bernanke’s $3 trillion gift to his Wall Street owners. The doling out of $645 billion to subprime college “students” and subprime auto “buyers” since 2010 accounts for more than 100% of the increase. The losses on these asinine loans will be epic. Credit card debt has actually fallen as people realize it is their last lifeline. They are using credit cards to pay income taxes, real estate taxes, higher energy costs, higher food costs, and the other necessities of life.

The entire engineered “recovery” since 2009 has been nothing but a Federal Reserve/U.S. Treasury conceived, debt manufactured scam. These highly educated lackeys for the establishment have been tasked with keeping the U.S. Titanic afloat until the oligarchs can safely depart on the lifeboats with all the ship’s jewels safely stowed in their pockets. There has been no housing recovery. There has been no jobs recovery. There has been no auto sales recovery. Giving a vehicle to someone with a 580 credit score with a 0% seven year loan is not a sale. It’s a repossession in waiting. The government supplied student loans are going to functional illiterates who are majoring in texting, facebooking and twittering. Do you think these indebted University of Phoenix dropouts living in their parents’ basements are going to spur a housing and retail sales recovery? This Keynesian “solution” was designed to produce the appearance of recovery, convince the masses to resume their debt based consumption, and add more treasure into the vaults of the Wall Street banks.

The master plan has failed miserably in reviving the economy. Savings, capital investment, and debt reduction are the necessary ingredients for a sustained healthy economic system. Debt based personal consumption of cheap foreign produced baubles & gadgets, $1 trillion government deficits to sustain the warfare/welfare state, along with a corrupt political and rigged financial system are the explosive concoction which will blow our economic system sky high. Facts can be ignored. Media propaganda can convince the willfully ignorant to remain so. The Federal Reserve can buy every Treasury bond issued to fund an out of control government. But eventually reality will shatter the delusions of millions as the debt based Ponzi scheme will run out of dupes and collapse in a flaming heap.

The inevitable shuttering of at least 3 billion square feet of retail space is a certainty. The aging demographics of the U.S. population, dire economic situation of both young and old, and sheer lunacy of the retail expansion since 2000, guarantee a future of ghost malls, decaying weed infested empty parking lots, retailer bankruptcies, real estate developer bankruptcies, massive loan losses for the banking industry, and the loss of millions of retail jobs. Since I always look for a silver lining in a black cloud, I predict a bright future for the SPACE AVAILABLE and GOING OUT OF BUSINESS sign making companies.

BEST BUY REVENUE FALLS BY $450 MILLION & PROFIT FALLS BY $225 MILLION: STOCK SOARS

Cut through all the gibberish, spin, bullshit and lies and you see that Best Buy had a horrible fourth quarter after an atrocious fourth quarter last year.

  • Revenue declined by $451 million.
  • Actual profit from the business declined by $225 million.
  • Cash flow from operations declined by $300 million versus last year.
  • They have slashed inventories by $1.2 billion, an 18% reduction. What are they going to sell in 2014?

The Wall Street muppet show continues. Every retailer has reported awful 4th quarter results and Wall Street cheers because it was better than expected. They need muppets. Buy buy buy.

Best Buy Reports Fourth Quarter Results

Non-GAAP diluted EPS from continuing operations of $1.24GAAP diluted EPS from continuing operations of $0.88Annualized Renew Blue cost reductions reach $765 million

MINNEAPOLIS, Feb 27, 2014 (BUSINESS WIRE) — Best Buy Co., Inc. /quotes/zigman/219712/delayed/quotes/nls/bbyBBY+6.66% today announced results for the 13-week fourth quarter (“Q4 FY14”) and 52-week year ended February 1, 2014 (“FY14”), as compared to the 13-week fourth quarter (“Q4 FY13”) and 53-week year ended February 2, 2013 (“FY13”).

Revenue Q4 FY14 Q4 FY13 FY14 FY13
Revenue ($ in millions) $14,470 $14,921 $42,410 $43,913
Comparable store sales % change1 (1.2%) (1.4%) (0.8%) (3.5%)
Domestic Segment:
Comparable store sales % change (1.2%) 0.9% (0.4%) (1.7%)
Comparable online sales % change 25.8% 11.2% 19.8% 11.4%
International Segment:
Comparable store sales % change (1.7%) (12.6%) (3.1%) (12.0%)
Operating Income, Diluted EPS and Return on Invested Capital (ROIC) Q4 FY14 Q4 FY13 FY14 FY13
GAAP
Operating income (loss) as a % of revenue 3.2% (1.2%) 2.7% 0.4%
Diluted EPS from continuing operations $0.88 ($1.36) $1.98 ($0.80)
Non-GAAP2
Operating income as a % of revenue 4.5% 5.7% 2.8% 3.4%
Diluted EPS from continuing operations $1.24 $1.47 $2.07 $2.54
ROIC3 n/a n/a 9.1% 9.2%

Note: All information regarding the company’s results pertain to continuing operations and do not include the impact of the European business, which was sold on June 26, 2013, or mindSHIFT Technologies, which was sold on February 1, 2014. The extra week in FY13 occurred in Q1 FY13 and contributed approximately $735 million in revenue.

Hubert Joly, Best Buy president and CEO, commented, “As we said in our holiday sales release, the fourth quarter was an environment of declining retail traffic, intense promotion, fewer holiday shopping days and severe weather. In the face of these unusual circumstances, our strategy to be price competitive and provide an improved customer experience resulted in market share gains4 in a weaker-than-expected consumer electronics market.

While we cannot be satisfied with the fourth quarter operating income rate decline of 120 basis points, the decline included the expected approximate 100-basis point negative impact associated with our mobile warranty and new credit card agreement economics that we called out in our Q3 FY14 earnings release. Thus we were able to materially offset the price investments we have been making with substantial cost savings and other operational improvements.”

Joly continued, “Turning to the full year, during fiscal 2014 we made substantial progress against our Renew Blue priorities. First, after only one year, we exceeded our original Renew Blue cost reduction target of $725 million by delivering annualized Renew Blue cost reductions totaling $765 million. Second, we have made progress in stabilizing our top and bottom lines. Domestic comparable store sales were virtually flat for the year. Domestic operating income rate, however, was down 70 basis points versus 130 basis points in the previous year. Again, excluding the impact of the increased mobile warranty expense, our cost savings and other operational improvements have materially offset pricing and other Renew Blue investments.

Third, and very important for our future, we have enhanced how we serve our customers and have been building key foundational capabilities. Most notably, we have: (1) increased Domestic online sales by 20%; (2) significantly increased our price competitiveness; (3) rolled out ship-from-store to more than 1,400 locations; (4) opened 1,400 Samsung and 600 Windows stores-within-a-store and completed the first phase of our floor space optimization; (5) increased our Net Promoter Score by more than 300 basis points; (6) re-launched our loyalty and credit card programs; (7) advanced the transformation of our online platform and customer database; and (8) significantly strengthened our balance sheet through a renewed focus on our core business and a substantially more disciplined capital allocation process.”

Joly concluded, “Our Renew Blue transformation is a multi-year journey, and while it is off to an encouraging start, it is still in the early stages. As we move forward, we will continue to address three business imperatives: (1) improving our operational performance; (2) building foundational capabilities necessary to unlock future growth strategies; and (3) leveraging our unique assets to create significant differentiation that is meaningful for our customers and our vendors. Our focus is on executing against these imperatives in pursuit of our long-term non-GAAP financial targets of 5% to 6% operating income rate and 13% to 15% ROIC.”

Sharon McCollam, Best Buy EVP, CAO and CFO, commented, “With each of the imperatives Hubert just outlined comes year-over-year financial change – both positive and negative – and we know that modeling such changes absent additional information in a transformation like ours is extremely difficult. Therefore, as we have done the past several quarters, we are providing you today with our quarterly estimates of how these discrete financial impacts will affect our quarterly operating income rates for FY15.

These financial impacts continue to include the following business drivers: (1) the negative impact of ongoing pricing investments; (2) the negative impact of our incremental Renew Blue SG&A investments; (3) the temporary negative impact of our mobile warranty costs; (4) the negative impact of the economics of our new credit card agreement; and (5) the offsetting positive impact of the realization of Renew Blue cost savings, which now total $765 million on an annualized basis.

In our Q3 FY14 earnings release, we quantified the net year-over-year impact of these drivers to the operating income rate by quarter as follows: (1) negative 60 to 90 basis points in Q1 FY15; (2) negative 70 to 100 basis points in Q2 FY15; and (3) negative 30 to 60 basis points in Q3 FY15.

Today, due to a higher than expected negative impact from the economics of our new credit card agreement and incremental year-over-year pricing investments, we are now expecting the net impact of these drivers to be negative 70 to 90 basis points in Q1 FY15. In Q2 FY15 and Q3 FY15, however, due to the timing of the benefits, we will begin realizing substantially greater Renew Blue cost savings and will be able to significantly offset the impact of the negative P&L drivers for those quarters.”

McCollam continued, “We will also have discrete year-over-year impacts related to income tax in FY15. In Q1 FY15, we expect to reorganize certain foreign legal entities to simplify our overall structure. This reorganization will accelerate a non-cash tax benefit of approximately $0.87 to $1.01 per diluted share. Due to its materiality, this will be treated as a non-GAAP adjustment. In prior years, this benefit has been historically recognized on a periodic basis. As a result of this acceleration, the company will have a higher quarterly income tax expense and income tax rate going forward on both a GAAP and non-GAAP basis. For tax purposes, this benefit will continue to be amortized.

In addition, there are other discrete year-over-year income tax-related items that we also expect will have a negative impact on the FY15 income tax expense and the FY15 income tax rate.

We estimate the combined diluted EPS impact of these discrete income tax-related items on both a GAAP and non-GAAP basis to be as follows: (1) negative $0.03 to $0.04 in Q1 FY15; (2) flat to positive $0.01 in Q2 FY15; (3) flat to negative $0.01 in Q3 FY15; and (4) negative $0.09 to $0.10 in Q4 FY15.

From a revenue perspective, in light of overall economic concerns, we are assuming that the industry declines in the consumer electronics category that we saw in the fourth quarter will continue. As a result, it is reasonable to expect that total company revenue and comparable store sales will remain slightly negative – similar to Q4 FY14 – in the first half of the year.”

Domestic Segment Fourth Quarter Results

Revenue

Domestic revenue of $12.30 billion declined 1.8% versus last year. This decline was primarily driven by a comparable store sales decline of 1.2%. Excluding a 30-basis point impact from the continuing rationalization of non-core businesses and a 30-basis point impact from a periodic profit sharing payment based on the long-term performance of the company’s externally managed extended service plan portfolio that occurred in January FY13 and did not recur in January FY14, the company estimates Domestic comparable store sales would have declined approximately 0.6%.

Comparable online sales increased 25.8% to $1.57 billion due to: (1) a higher average order value; (2) improved inventory availability supported by our ship-from-store and online distribution center expansion initiatives; (3) increased traffic; and (4) higher conversion on both the core and mobile sites.

From a merchandising perspective, growth in computing, appliances and gaming was more than offset by declines in other categories, including digital imaging, movies and home theater.

Gross Profit Rate

Domestic gross profit rate was 20.0% versus 22.3% last year. Excluding the 30-basis point impact from the periodic profit sharing payment described above, Domestic gross profit rate declined 200 basis points. This decline was primarily driven by (1) a 125-basis point incremental investment in structural and promotional pricing; (2) a 40-basis point negative impact of the new credit card agreement, which has less favorable economics than the expired agreement due to changes in both the regulatory environment and overall consumer credit market; (3) a 35-basis point negative impact from increased product warranty-related costs associated with higher claims frequency in the mobile phone category; and (4) a lower gross margin in mobile due to lower attachment rates on mobile service plans. These impacts were partially offset by the realization of Renew Blue cost reductions and other supply chain cost containment initiatives.

Selling, General and Administrative Expenses (“SG&A”)

Domestic SG&A expenses were $1.96 billion or 16.0% of revenue versus $2.06 billion or 16.5% of revenue last year. On a non-GAAP basis, Domestic SG&A expenses were $1.91 billion or 15.5% of revenue versus $2.05 billion or 16.4% of revenue last year. This 90-basis point rate decline was primarily driven by (1) the realization of Renew Blue cost reduction initiatives; (2) tighter expense management throughout the company; (3) lower legal-related expenses; and (4) lower incentive compensation. These impacts were partially offset by Renew Blue investments in online growth and advertising.

International Segment Fourth Quarter Results

Revenue

International revenue of $2.17 billion declined 9.6% versus last year. The decline was primarily driven by (1) the negative impact of foreign currency exchange rate fluctuations; (2) the loss of revenue from large format store closures in Canada and China; and (3) a comparable store sales decline of 1.7%. Comparable store sales were negatively impacted primarily by declining industry trends in Canada and Mexico.

Gross Profit Rate

International gross profit rate was 21.3% versus 22.3% last year. This 100-basis point rate decline was primarily driven by increased promotional activity and a mix shift into lower margin products in Canada.

SG&A

International SG&A expenses were $369 million or 17.0% of revenue versus $460 million or 19.2% of revenue last year. On a non-GAAP basis, International SG&A expenses were $363 million or 16.7% of revenue versus $425 million or 17.7% of revenue last year. This 100-basis point rate decline was primarily driven by Renew Blue cost reductions and tighter expense management in Canada, and to a lesser extent, the elimination of expenses associated with previously closed stores.

Renew Blue Cost Reduction Initiatives Update

Since the company’s Q3 FY14 earnings release, Renew Blue annualized cost reductions have increased $260 million, bringing the total Renew Blue annualized cost reductions to $765 million ($570 million in SG&A and $195 million in cost of goods sold). The additional $260 million in cost reductions ($230 million in SG&A and $30 million in cost of goods sold) is primarily driven by (1) the optimization of the field and store operating models in the U.S. and Canada; (2) structural changes to certain compensation and benefits programs; and (3) ongoing optimization of returns, replacements and damages.

The company has already exceeded the $725 million North American cost reduction opportunity it presented at its Investor Day in November 2012. Today the company is increasing the target to $1 billion. These additional cost reductions are expected to come primarily from the optimization of (1) returns, replacements and damages and (2) logistics and supply chain.

Restructuring Charges and Non-Cash Impairments

During Q4 FY14, the company recorded pre-tax restructuring charges totaling $115 million primarily related to severance charges associated with the Renew Blue SG&A cost reduction initiatives outlined above. The majority of the $115 million is expected to be paid in cash in FY15.

The company also recorded $65 million of non-restructuring asset impairments (within the SG&A expenses line). These non-cash impairments were primarily a result of store-related impairment charges in the Domestic segment.

Please see the table titled “Reconciliation of Non-GAAP Financial Measures” attached to this release for more detail.

mindSHIFT Transaction

On February 1, 2014, the company completed the sale of mindSHIFT Technologies, a business-to-business technology services provider it had acquired in December 2011. Results from mindSHIFT are now presented as discontinued operations.

Dividends

On December 31, 2013, the company paid a quarterly dividend of $0.17 per common share outstanding, or $59 million.

Conference Call

Best Buy is scheduled to conduct an earnings conference call at 8:00 a.m. Eastern Time (7:00 a.m. Central Time) on February 27, 2014. A webcast of the call is expected to be available at www.investors.bestbuy.comboth live and after the call.

(1) Best Buy’s comparable store sales is comprised of revenue at stores, websites and call centers operating for at least 14 full months as well as revenue related to other comparable sales channels. Relocated stores, as well as remodeled, expanded and downsized stores closed more than 14 days, are excluded from the comparable store sales calculation until at least 14 full months after reopening. Acquired stores and businesses are included in the comparable store sales calculation beginning with the first full quarter following the first anniversary of the date of the acquisition. The portion of the calculation of the comparable store sales percentage change attributable to the International segment excludes the effect of fluctuations in foreign currency exchange rates. The calculation of comparable store sales excludes the impact of revenue from discontinued operations and the extra week of revenue in FY13. The method of calculating comparable store sales varies across the retail industry. As a result, Best Buy’s method of calculating comparable store sales may not be the same as other retailers’ methods. Online revenue is included in Best Buy’s comparable store sales calculation.

(2) The company defines non-GAAP gross profit, non-GAAP SG&A, non-GAAP operating income and non-GAAP diluted earnings per share for the periods presented as its gross profit, SG&A, operating income and diluted earnings per share for those periods calculated in accordance with accounting principles generally accepted in the U.S. (“GAAP”) adjusted to exclude restructuring charges, non-restructuring asset impairments, gains on sales of investments and the required tax allocation impact from the sale of the company’s European business.

These non-GAAP financial measures provide investors with an understanding of the company’s financial performance adjusted to exclude the effect of the items described above. These non-GAAP financial measures assist investors in making a ready comparison of the company’s gross profit, SG&A, operating income and diluted earnings per share for its fiscal quarter and year ended February 1, 2014, against the company’s results for the respective prior-year periods and against third party estimates of the company’s gross profit, SG&A, operating income and diluted earnings per share for those periods that may not have included the effect of such items. Additionally, management uses these non-GAAP financial measures as an internal measure to analyze trends, allocate resources, and analyze underlying operating performance. These non-GAAP financial measures should not be considered superior to, as a substitute for, or as an alternative to, and should be considered in conjunction with, GAAP financial measures and may differ from similar measures used by other companies. Please see “Reconciliation of Non-GAAP Financial Measures” at the end of this release for more detail.

(3) The company defines non-GAAP return on invested capital (“ROIC”) as non-GAAP net operating profit after taxes divided by average invested capital for the periods presented (including both continuing and discontinued operations). Non-GAAP net operating profit after taxes is defined as our operating income for the periods presented calculated in accordance with GAAP adjusted to exclude the effects of: (i) operating lease interest; (ii) investment income; (iii) net earnings attributable to noncontrolling interests; (iv) income taxes; (v) all restructuring charges in costs of goods sold and operating expenses, the effect of Q2 FY14 LCD legal settlements, and goodwill and tradename impairments; and (vi) the noncontrolling interest impact of the restructuring charges, and transaction costs related to the disposition of our interest in Best Buy Europe (BBE). Average invested capital is defined as the average of our total assets for the trailing four quarters in relation to the periods presented adjusted to: (i) exclude excess cash and cash equivalent and short-term investments; (ii) include capitalized operating lease obligations calculated using a multiple of eight times rental expenses; (iii) exclude our total liabilities, less our outstanding debt; and (iv) exclude equity of noncontrolling interests.

This non-GAAP financial measure provides investors with a supplemental measure to evaluate how effectively the company is investing its capital and deploying its assets. Management uses this non-GAAP financial measure to assist in allocating resources. Trends in the measure may fluctuate over time as management balances long-term initiatives with possible short-term impacts. Our ROIC calculation utilizes total operations in order to provide a measure that includes the results of and capital invested in all operations, including those businesses that are no longer continuing operations. This non-GAAP financial measure should not be considered superior to, as a substitute for, or as an alternative to, and should be considered in conjunction with, GAAP financial measures and may differ from similar measures used by other companies. Please see “Reconciliation of Non-GAAP Financial Measures” at the end of this release for more detail.

(4) Share gain is determined by reference to information from The NPD Group and other industry sources. According to The NPD Group’s POS Weekly Tracking Service, revenue for the CE industry was down 3.2% during the 13 weeks ended February 1, 2014 compared to the 13 weeks ended February 2, 2013. The CE industry, as defined by The NPD Group, includes TVs, desktop and notebook computers, tablets not including Kindle, digital imaging and other categories. It does not include mobile phones, gaming, movies, music, appliances or services.

Forward-Looking and Cautionary Statements:

This news release contains forward-looking statements within the meaning of the Private Securities Litigation Reform Act of 1995 as contained in Section 27A of the Securities Act of 1933 and Section 21E of the Securities Exchange Act of 1934 that reflect management’s current views and estimates regarding future market conditions, company performance and financial results, business prospects, new strategies, the competitive environment and other events. You can identify these statements by the fact that they use words such as “anticipate,” “believe,” ”assume,” “estimate,” “expect,” “intend,” “project,” “guidance,” “plan,” “outlook,” and other words and terms of similar meaning. These statements involve a number of risks and uncertainties that could cause actual results to differ materially from the potential results discussed in the forward-looking statements. Among the factors that could cause actual results and outcomes to differ materially from those contained in such forward-looking statements are the following: general economic conditions, changes in consumer preferences, consumer confidence, consumer spending and debt levels, online sales levels and trends, average ticket size, the mix of products and services offered for sale, credit market changes and constraints, product availability, sales volumes, competitive initiatives of competitors, including pricing actions and promotional activities of competitors, profit margins and the impact of pricing investments on our revenue, weather, natural or man-made disasters, the company’s ability to react to a disaster recovery situation, changes in law or regulations, including changes in tax rates, foreign currency fluctuation, availability of suitable real estate locations, the company’s ability to manage its property portfolio, the impact of labor markets and new product introductions on overall profitability, the availability of qualified labor pools, the company’s ability to retain qualified employees. management turnover, failure to achieve anticipated expense and cost reductions from operational and restructuring changes, disruptions in our supply chain, the costs of procuring goods the company sells, failure to achieve anticipated profitability increases from operational and restructuring changes, failure to accurately predict the duration over which we will incur costs, acquisitions and development of new businesses, divestitures of existing businesses, failure to achieve anticipated benefits of announced transactions, integration challenges relating to new ventures and unanticipated costs associated with previously announced or future restructuring activities, our ability to protect information relating to our customers, A further list and description of these risks, uncertainties and other matters can be found in the company’s annual report and other reports filed from time to time with the Securities and Exchange Commission (“SEC”), including, but not limited to, Best Buy’s Transition Report on Form 10-K filed with the SEC on March 27, 2013. Best Buy cautions that the foregoing list of important factors is not complete, and any forward-looking statements speak only as of the date they are made, and Best Buy assumes no obligation to update any forward-looking statement that it may make.

BEST BUY CO., INC.
CONSOLIDATED STATEMENTS OF EARNINGS
($ in millions, except per share amounts)
(Unaudited and subject to reclassification)
Three Months Ended Twelve Months Ended
Feb 1, 2014 Feb 2, 2013 Feb 1, 2014 Feb 2, 2013
Revenue $ 14,470 $ 14,921 $ 42,410 $ 43,913
Cost of goods sold 11,553 11,589 32,720 33,547
Restructuring charges – cost of goods sold 1 1
Gross profit 2,917 3,331 9,690 10,365
Gross profit % 20.2% 22.3% 22.8% 23.6%
Selling, general and administrative expenses 2,333 2,522 8,391 8,954
SG&A % 16.1% 16.9% 19.8% 20.4%
Goodwill impairment 822 822
Restructuring charges 115 168 159 420
Operating income (loss) 469 (181) 1,140 169
Operating income (loss) % 3.2% (1.2%) 2.7% 0.4%
Other income (expense):
Gain on sale of investments 2 20
Investment income and other 9 3 27 19
Interest expense (23) (28) (100) (109)
Earnings (loss) from continuing operations before income tax expense 457 (206) 1,087 79
Income tax expense 146 254 398 349
Effective tax rate 32.0% (122.7%) 36.7% 443.6%
Net earnings (loss) from continuing operations 311 (460) 689 (270)
Gain (loss) from discontinued operations, net of tax (17) 81 (166) 37
Net earnings (loss) including noncontrolling interest 294 (379) 523 (233)
Net earnings from continuing operations attributable to noncontrolling interests (1) (1) (2) (1)
Net (earnings) loss from discontinued operations attributable to noncontrolling interests (29) 11 (15)
Net earnings (loss) attributable to Best Buy Co., Inc. shareholders $ 293 $ (409) $ 532 $ (249)
Amounts attributable to Best Buy Co., Inc. shareholders
Net earnings (loss) from continuing operations $ 310 $ (461) $ 687 $ (271)
Net earnings (loss) from discontinued operations (17) 52 (155) 22
Net earnings (loss) attributable to Best Buy Co., Inc. shareholders $ 293 $ (409) $ 532 $ (249)
Basic earnings (loss) per share attributable to Best Buy Co., Inc. shareholders
Continuing operations $ 0.89 $ (1.36) $ 2.01 $ (0.80)
Discontinued operations (0.04) 0.15 (0.45) 0.07
Basic earnings (loss) per share $ 0.85 $ (1.21) $ 1.56 $ (0.73)
Diluted earnings (loss) per share attributable to Best Buy Co., Inc. shareholders
Continuing operations $ 0.88 $ (1.36) $ 1.98 $ (0.80)
Discontinued operations (0.05) 0.15 (0.45) 0.07
Diluted earnings (loss) per share $ 0.83 $ (1.21) $ 1.53 $ (0.73)
Dividends declared per Best Buy Co., Inc. common share $ 0.17 $ 0.17 $ 0.68 $ 0.66
Weighted average Best Buy Co., Inc. common shares outstanding (in millions)
Basic 346.3 338.1 342.1 339.0
Diluted 352.6 338.1 347.6 339.0
BEST BUY CO., INC.
CONDENSED CONSOLIDATED BALANCE SHEETS
($ in millions)
(Unaudited and subject to reclassification)
Excluding Best Buy Europe
Feb 1, 2014 Feb 2, 2013 Feb 2, 20131
ASSETS
Current assets
Cash and cash equivalents $ 2,678 $ 1,826 $ 1,665
Short-term investments 223
Receivables 1,308 2,704 1,075
Merchandise inventories 5,376 6,571 6,042
Other current assets 900 946 821
Total current assets 10,485 12,047 9,603
Net property and equipment 2,598 3,270 2,918
Goodwill 425 528 528
Tradenames 101 131 105
Customer relationships 203 77
Equity and other investments 43 86 61
Other assets 361 522 249
TOTAL ASSETS $ 14,013 $ 16,787 $ 13,541
LIABILITIES & EQUITY
Current liabilities
Accounts payable $ 5,122 $ 6,951 $ 5,933
Unredeemed gift card liabilities 406 428 424
Accrued compensation 444 520 425
Accrued liabilities 1,272 1,639 1,316
Accrued income taxes 147 129 121
Short-term debt 596
Current portion of long-term debt 45 547 544
Total current liabilities 7,436 10,810 8,763
Long-term liabilities 976 1,109 1,029
Long-term debt 1,612 1,153 1,150
Equity 3,989 3,715 2,599
TOTAL LIABILITIES & EQUITY $ 14,013 $ 16,787 $ 13,541
(1) Represents the assets, liabilities and equity as of Feb 2, 2013 excluding Best Buy Europe.
BEST BUY CO., INC.
CONDENSED CONSOLIDATED STATEMENTS OF CASH FLOWS
($ in millions)
(Unaudited and subject to reclassification)
Twelve Months Ended
Feb 1, 2014 Feb 2, 2013
OPERATING ACTIVITIES
Net earnings (loss) including noncontrolling interests $ 523 $ (233)
Adjustments to reconcile net earnings (loss) to total cash provided by operating activities:
Depreciation 701 876
Amortization of definite-lived intangible assets 15 41
Goodwill impairments 822
Restructuring charges 259 457
Loss on sale of business 143
Stock-based compensation 90 117
Realized gain on sale of investment (18)
Deferred income taxes (28) (100)
Excess tax benefits from stock-based compensation (9)
Other, net 71 68
Changes in operating assets and liabilities, net of acquired assets and liabilities:
Receivables 7 (217)
Merchandise inventories 597 265
Other assets (70) (110)
Accounts payable (986) 38
Other liabilities (273) (432)
Income taxes 54 (152)
Total cash provided by operating activities 1,094 1,422
INVESTING ACTIVITIES
Additions to property and equipment (547) (742)
(Purchases) sales of investments, net (180) 56
Proceeds from sale of business, net of cash transferred upon sale 206 25
Acquisition of business, net of cash acquired (31)
Change in restricted assets 5 74
Other, net (1) 16
Total cash used in investing activities (517) (602)
FINANCING ACTIVITIES
Repurchase of common stock (255)
Borrowings of debt, net 381 70
Dividends paid (233) (224)
Issuance of common stock 171 27
Excess tax benefits from stock-based compensation 9
Other, net (9) (14)
Total cash provided by (used in) financing activities 319 (396)
EFFECT OF EXCHANGE RATE CHANGES ON CASH (44) 1
INCREASE IN CASH AND CASH EQUIVALENTS 852 425
ADJUSTMENT FOR CHANGE IN FISCAL YEAR 202
INCREASE IN CASH AND CASH EQUIVALENTS AFTER ADJUSTMENT 852 627
CASH AND CASH EQUIVALENTS AT BEGINNING OF PERIOD 1,826 1,199
CASH AND CASH EQUIVALENTS AT END OF PERIOD $ 2,678 $ 1,826
BEST BUY CO., INC.
SEGMENT INFORMATION
($ in millions)
(Unaudited and subject to reclassification)
Domestic Segment Performance Summary
Three Months Ended Twelve Months Ended
Feb 1, 2014 Feb 2, 2013 Feb 1, 2014 Feb 2, 2013
Revenue $12,298 $12,519 $35,831 $36,716
Gross profit $2,454 $2,796 $8,274 $8,741
SG&A $1,964 $2,062 $7,006 $7,365
Operating income $393 $650 $1,145 $1,040
Key Metrics
Comparable store sales % change1 (1.2%) 0.9% (0.4%) (1.7%)
Gross profit as a % of revenue 20.0% 22.3% 23.1% 23.8%
SG&A as a % of revenue 16.0% 16.5% 19.6% 20.1%
Operating income as a % of revenue 3.2% 5.2% 3.2% 2.8%
Adjusted (non-GAAP) Results2
Gross profit $2,454 $2,797 $8,010 $8,742
Gross profit as a % of revenue 20.0% 22.3% 22.4% 23.8%
SG&A $1,905 $2,053 $6,887 $7,342
SG&A as a % of revenue 15.5% 16.4% 19.2% 20.0%
Operating income $549 $744 $1,123 $1,400
Operating income as a % of revenue 4.5% 5.9% 3.1% 3.8%
International Segment Performance Summary
Three Months Ended Twelve Months Ended
Feb 1, 2014 Feb 2, 2013 Feb 1, 2014 Feb 2, 2013
Revenue $2,172 $2,402 $6,579 $7,197
Gross profit $463 $535 $1,416 $1,624
SG&A $369 $460 $1,385 $1,589
Operating income (loss) $76 ($831) ($5) ($871)
Key Metrics
Comparable store sales % change1 (1.7%) (12.6%) (3.1%) (12.0%)
Gross profit as a % of revenue 21.3% 22.3% 21.5% 22.6%
SG&A as a % of revenue 17.0% 19.2% 21.1% 22.1%
Operating income (loss) as a % of revenue 3.5% (34.6%) (0.1%) (12.1%)
Adjusted (non-GAAP) Results2
SG&A $363 $425 $1,368 $1,552
SG&A as a % of revenue 16.7% 17.7% 20.8% 21.6%
Operating income $100 $110 $48 $72
Operating income as a % of revenue 4.6% 4.6% 0.7% 1.0%
(1) Best Buy’s comparable store sales is comprised of revenue at stores, websites and call centers operating for at least 14 full months, as well as revenue related to other comparable sales channels. The portion of the calculation of the comparable store sales percentage change attributable to the International segment excludes the effect of fluctuations in foreign currency exchange rates.
(2) Please see table titled “Reconciliation of Non-GAAP Financial Measures” at the back of this release.
BEST BUY CO., INC.
REVENUE CATEGORY SUMMARY
(Unaudited and subject to reclassification)
Domestic Segment Summary
Revenue Mix Summary Comparable Store Sales
Three Months Ended Three Months Ended
Feb 1, 2014 Feb 2, 2013 Feb 1, 2014 Feb 2, 2013
Consumer Electronics1 32% 33% (5.9%) (5.0%)
Computing and Mobile Phones1 46% 44% 2.9% 11.4%
Entertainment 11% 12% (5.6%) (18.9%)
Appliances 5% 5% 17.1% 11.7%
Services2 5% 5% (9.2%)3 6.2%3
Other 1% 1% n/a n/a
Total 100% 100% (1.2%) 0.9%
International Segment Summary
Revenue Mix Summary Comparable Store Sales
Three Months Ended Three Months Ended
Feb 1, 2014 Feb 2, 2013 Feb 1, 2014 Feb 2, 2013
Consumer Electronics1 31% 34% (10.0%) (17.8%)
Computing and Mobile Phones1 39% 38% 2.7% (5.0%)
Entertainment 11% 10% 0.6% (17.8%)
Appliances 15% 14% 3.8% (14.7%)
Services2 4% 4% (0.7%) (12.8%)
Other <1% <1% n/a n/a
Total 100% 100% (1.7%) (12.6%)
(1) During the first quarter of fiscal 2014, e-Readers were moved from the “Consumer Electronics” revenue category to “Computing and Mobile Phones” to reflect the continued convergence of their features with tablets and other computing devices. Prior years have been recast for comparability.
(2) The “Services” revenue category consists primarily of service contracts, extended warranties, computer related services, product repair and delivery and installation for home theater, mobile audio and appliances.
(3) The Domestic comparable store sales for the “Services” revenue category reflects a periodic profit sharing payment based on the long-term performance of the company’s externally managed extended service plan portfolio that occurred in January FY13 and did not recur in January FY14. Excluding this impact, comparable store sales would have been (2.6%) in Q4 FY14 and (0.9%) in Q4 FY13.
BEST BUY CO., INC.
REVENUE CATEGORY SUMMARY
(Unaudited and subject to reclassification)
Domestic Segment Summary
Revenue Mix Summary Comparable Store Sales
Twelve Months Ended Twelve Months Ended
Feb 1, 2014 Feb 2, 2013 Feb 1, 2014 Feb 2, 2013
Consumer Electronics1 30% 32% (5.6%) (7.7%)
Computing and Mobile Phones1 48% 45% 4.7% 7.0%
Entertainment 8% 10% (16.3%) (21.5%)
Appliances 7% 6% 16.7% 10.1%
Services2 6% 6% 0.2%3 0.3%3
Other 1% 1% n/a n/a
Total 100% 100% (0.4%) (1.7%)
International Segment Summary
Revenue Mix Summary Comparable Store Sales
Twelve Months Ended Twelve Months Ended
Feb 1, 2014 Feb 2, 2013 Feb 1, 2014 Feb 2, 2013
Consumer Electronics1 28% 31% (9.4%) (17.2%)
Computing and Mobile Phones1 40% 39% (1.7%) (4.1%)
Entertainment 7% 8% (9.3%) (17.1%)
Appliances 20% 17% 8.4% (17.3%)
Services2 5% 5% (5.3%) (10.0%)
Other <1% <1% n/a n/a
Total 100% 100% (3.1%) (12.0%)
(1) During the first quarter of fiscal 2014, e-Readers were moved from the “Consumer Electronics” revenue category to “Computing and Mobile Phones” to reflect the continued convergence of their features with tablets and other computing devices. Prior years have been recast for comparability.
(2) The “Services” revenue category consists primarily of service contracts, extended warranties, computer related services, product repair and delivery and installation for home theater, mobile audio and appliances.
(3) The Domestic comparable store sales for the “Services” revenue category reflects a periodic profit sharing payment based on the long-term performance of the company’s externally managed extended service plan portfolio that occurred in January FY13 and did not recur in January FY14 Excluding this impact, comparable store sales would have been 2.2% in FY14 and (1.6%) in FY13.
BEST BUY CO., INC.
RECONCILIATION OF NON-GAAP FINANCIAL MEASURES
CONTINUING OPERATIONS
($ in millions, except per share amounts)
(Unaudited and subject to reclassification)
The following tables reconcile operating income, net earnings and diluted earnings per share for the periods presented for continuing operations (GAAP financial measures) to adjusted operating income, adjusted net earnings and adjusted diluted earnings per share for continuing operations (non-GAAP financial measures) for the periods presented.
Three Months Ended Three Months Ended
Feb 1, 2014 Feb 2, 2013
$ % of Rev. $ % of Rev.
Domestic – Continuing Operations
Gross profit $2,454 20.0% $2,796 22.3%
Restructuring charges – COGS 0 0.0% 1 0.0%
Adjusted gross profit $2,454 20.0% $2,797 22.3%
SG&A $1,964 16.0% $2,062 16.5%
Non-restructuring asset impairments – SG&A (59) (0.5%) (9) (0.1%)
Adjusted SG&A $1,905 15.5% $2,053 16.4%
Operating income $393 3.2% $650 5.2%
Restructuring charges – COGS 0 0.0% 1 0.0%
Non-restructuring asset impairments – SG&A 59 0.5% 9 0.1%
Goodwill impairment 0 0.0% 3 0.0%
Restructuring charges 97 0.8% 81 0.6%
Adjusted operating income $549 4.5% $744 5.9%
International – Continuing Operations
SG&A $369 17.0% $460 19.2%
Non-restructuring asset impairments – SG&A (6) (0.3%) (35) (1.5%)
Adjusted SG&A $363 16.7% $425 17.7%
Operating income (loss) $76 3.5% ($831) (34.6%)
Non-restructuring asset impairments – SG&A 6 0.3% 35 1.5%
Goodwill impairment 0 0.0% 819 34.1%
Restructuring charges 18 0.8% 87 3.6%
Adjusted operating income $100 4.6% $110 4.6%
Consolidated – Continuing Operations
Gross profit $2,917 20.2% $3,331 22.3%
Restructuring charges – COGS 0 0.0% 1 0.0%
Adjusted gross profit $2,917 20.2% $3,332 22.3%
SG&A $2,333 16.1% $2,522 16.9%
Non-restructuring asset impairments – SG&A (65) (0.4%) (44) (0.3%)
Adjusted SG&A $2,268 15.7% $2,478 16.6%
Operating income (loss) $469 3.2% ($181) (1.2%)
Restructuring charges – COGS 0 0.0% 1 0.0%
Non-restructuring asset impairments – SG&A 65 0.4% 44 0.3%
Goodwill impairment 0 0.0% 822 5.5%
Restructuring charges 115 0.8% 168 1.1%
Adjusted operating income $649 4.5% $854 5.7%
Three Months Ended Three Months Ended
Feb 1, 2014 Feb 2, 2013
$ % of Rev. $ % of Rev.
Net earnings (loss) $310 ($461)
After-tax impact of restructuring charges – COGS 0 1
After-tax impact of net LCD settlements1 6 0
After-tax impact of non-restructuring asset impairments – SG&A 42 31
After-tax impact of goodwill impairment 0 821
After-tax impact of restructuring charges 74 107
Income tax impact of Best Buy Europe sale2 4 0
Adjusted net earnings $436 $499
Diluted EPS $0.88 ($1.36)
Per share impact of restructuring charges – COGS 0.00 0.01
Per share impact of net LCD settlements1 0.02 0.00
Per share impact of non-restructuring asset impairments – SG&A 0.12 0.09
Per share impact of goodwill impairment 0.00 2.42
Per share impact of restructuring charges 0.21 0.31
Per share income tax impact of Best Buy Europe sale2 0.01 0.00
Adjusted diluted EPS $1.24 $1.47
Twelve Months Ended Twelve Months Ended
Feb 1, 2014 Feb 2, 2013
$ % of Rev. $ % of Rev.
Domestic – Continuing Operations
Gross profit $8,274 23.1% $8,741 23.8%
Restructuring charges – COGS 0 0.0% 1 0.0%
LCD settlements3 (264) (0.7%) 0 0.0%
Adjusted gross profit $8,010 22.4% $8,742 23.8%
SG&A $7,006 19.6% $7,365 20.1%
Non-restructuring asset impairments – SG&A (84) (0.2%) (23) (0.1%)
LCD settlement legal fees3 (35) (0.1%) 0 0.0%
Adjusted SG&A $6,887 19.2% $7,342 20.0%
Operating income $1,145 3.2% $1,040 2.8%
Restructuring charges – COGS 0 0.0% 1 0.0%
Net LCD settlements3 (229) (0.6%) 0 0.0%
Non-restructuring asset impairments – SG&A 84 0.2% 23 0.1%
Goodwill impairment 0 0.0% 3 0.0%
Restructuring charges 123 0.3% 333 0.9%
Adjusted operating income $1,123 3.1% $1,400 3.8%
International – Continuing Operations
SG&A $1,385 21.1% $1,589 22.1%
Non-restructuring asset impairments – SG&A (17) (0.3%) (37) (0.5%)
Adjusted SG&A $1,368 20.8% $1,552 21.6%
Operating loss ($5) (0.1%) ($871) (12.1%)
Non-restructuring asset impairments – SG&A 17 0.3% 37 0.5%
Goodwill impairment 0 0.0% 819 11.4%
Restructuring charges 36 0.5% 87 1.2%
Adjusted operating income $48 0.7% $72 1.0%
Twelve Months Ended Twelve Months Ended
Feb 1, 2014 Feb 2, 2013
$ % of Rev. $ % of Rev.
Consolidated – Continuing Operations
Gross profit $9,690 22.8% $10,365 23.6%
Restructuring charges – COGS 0 0.0% 1 0.0%
LCD settlements3 (264) (0.6%) 0 0.0%
Adjusted gross profit $9,426 22.2% $10,366 23.6%
SG&A $8,391 19.8% $8,954 20.4%
Non-restructuring asset impairments – SG&A (101) (0.2%) (60) (0.1%)
LCD settlement legal fees3 (35) (0.1%) 0 0.0%
Adjusted SG&A $8,255 19.5% $8,894 20.3%
Operating income $1,140 2.7% $169 0.4%
Restructuring charges – COGS 0 0.0% 1 0.0%
Net LCD settlements3 (229) (0.5%) 0 0.0%
Non-restructuring asset impairments – SG&A 101 0.2% 60 0.1%
Goodwill impairment 0 0.0% 822 1.9%
Restructuring charges 159 0.4% 420 1.0%
Adjusted operating income $1,171 2.8% $1,472 3.4%
Net earnings (loss) $687 ($271)
After-tax impact of restructuring charges – COGS 0 1
After-tax impact of net LCD settlements3 (142) 0
After-tax impact of non-restructuring asset impairments – SG&A 67 41
After-tax impact of goodwill impairment 0 821
After-tax impact of restructuring charges 104 271
After-tax impact of gain on sale of investments (12) 0
Income tax impact of Best Buy Europe sale2 18 0
Adjusted net earnings $722 $863
Diluted EPS $1.98 ($0.80)
Per share impact of net LCD settlements3 (0.41) 0.00
Per share impact of non-restructuring asset impairments – SG&A 0.19 0.12
Per share impact of goodwill impairment 0.00 2.42
Per share impact of restructuring charges 0.30 0.80
Per share impact of gain on sale of investments (0.04) 0.00
Per share income tax impact of Best Buy Europe sale2 0.05 0.00
Adjusted diluted EPS $2.07 $2.54
(1) Represents interim period tax reporting impact of Q2 FY14 LCD-related legal settlements.
(2) Tax impact of Best Buy Europe sale and resulting required tax allocation between continuing and discontinued operations.
(3) Includes settlements reached in Q2 FY14. Settlements reached prior to Q2 FY14 are not included.
BEST BUY CO., INC.
RECONCILIATION OF NON-GAAP FINANCIAL MEASURES
($ in millions)
(Unaudited and subject to reclassification)
The following information provides a reconciliation of a non-GAAP financial measure to the most comparable financial measure calculated and presented in accordance with GAAP. The company has provided the non-GAAP financial measure, which is not calculated or presented in accordance with GAAP, as information supplemental and in addition to the financial measure that is calculated and presented in accordance with GAAP. Such non-GAAP financial measure should not be considered superior to, as a substitute for, or as an alternative to, and should be considered in conjunction with, the GAAP financial measure. The non-GAAP financial measure in the accompanying news release may differ from similar measures used by other companies.The following table includes the calculation of Adjusted ROIC for total operations, which includes both continuing and discontinued operations (non-GAAP financial measures), along with a reconciliation to the calculation of return on total assets (“ROA”) (GAAP financial measure) for the periods presented.
Calculation of Return on Invested Capital1
Feb 1, 20142 Feb 2, 20132
Net Operating Profit After Taxes (NOPAT)
Operating income – continuing operations $ 1,140 $ 169
Operating loss – discontinued operations (206) (14)
Total operating income 934 155
Add: Operating lease interest3 517 587
Add: Investment income 33 32
Less: Net (earnings) loss attributable to noncontrolling interest (NCI) 9 (16)
Less: Income taxes4 (629) (763)
NOPAT $ 864 $ (5)
Add: Restructuring charges and impairments5 256 1,340
Add: NCI impact of BBYM profit share buyout, restructuring charges and impairments (38) (3)
Adjusted NOPAT $ 1,082 $ 1,332
Average Invested Capital
Total assets $ 14,174 $ 16,551
Less: Excess Cash6 (1,564) (554)
Add: Capitalized operating lease obligations7 8,272 9,397
Total liabilities (10,453) (12,485)
Exclude: Debt8 1,674 2,140
Less: Noncontrolling interests (160) (627)
Average invested capital $ 11,943 $ 14,422
Adjusted return on invested capital (ROIC) 9.1% 9.2%
Calculation of Return on Assets1
Feb 1, 20142 Feb 2, 20132
Net earnings (loss) including noncontrolling interests $ 523 $ (233)
Total assets 14,174 16,551
Return on assets (ROA) 3.7% (1.4%)
(1) The calculations of Return on Invested Capital and Return on Assets use total operations, which includes both continuing and discontinued operations.
(2) Income statement accounts represent the activity for the 12 months ended as of each of the balance sheet dates. Balance sheet accounts represent the average account balances for the 4 quarters ended as of each of the balance sheet dates.
(3) Operating lease interest represents the add-back to operating income driven by our capitalized lease obligations and represents fifty percent of our annual rental expense which is the multiple used for the retail sector by one of the nationally recognized credit rating agencies that rates our creditworthiness, and we consider it to be an appropriate multiple for our lease portfolio.
(4) Income taxes are calculated using a blended statutory rate at the enterprise level based on statutory rates from the countries we do business in.
(5) Includes all restructuring charges in costs of goods sold and operating expenses, goodwill and tradename impairments, non-restructuring impairments, and the BBE transaction costs.
(6) Cash and cash equivalents and short-term investments are capped at the greater of 1% of revenue or actual amounts on hand. The cash and cash equivalents and short-term investments in excess of the cap are subtracted from our calculation of average invested capital to show their exclusion from total assets.
(7) The multiple of eight times annual rental expense in the calculation of our capitalized operating lease obligations is the multiple used for the retail sector by one of the nationally recognized credit rating agencies that rates our creditworthiness, and we consider it to be an appropriate multiple for our lease portfolio.
(8) Debt includes short-term debt, current portion of long-term debt and long-term debt and is added back to our calculation of average invested capital to show its exclusion from total liabilities.

SOURCE: Best Buy Co., Inc.

JIM CRAMER & CNBC ARE A JOKE

Does it ever get old watching the lying sack of shit Jim Cramer and his discredited Wall Street Shill network CNBC get raked over the coals for their blatant propaganda and absolutely horrible investment advice?

A Brief History Of Jim Cramer’s Opinions On “Pillar Of Strength” Best Buy

Tyler Durden's picture

You really can’t make this shit up. From the funniest person on financial comedy TV (whose most memorable TV appearance will always be roaring that Bear Stearns is fine days before its collapse), here is his “opinion” on Best Sell Buy, entirely in his own words.

November 20: Jim Cramer opines on Best Buy:

Pillars of Strength in Retail


The homework doesn’t dovetail with the shares. That’s how I felt about the way Best Buy (BBY), Home Depot (HD) and Dick’s (DKS) traded in the wake of the earnings calls — because all three were basically in all-systems-go mode for suppliers.


Regarding Best Buy, it looks as if the tablet is the standout. I know that Apple (AAPL) has become a hated equity, but I keep hearing good things, so I can’t join the nitpicker mob. You did get a nice Chrome call-out for Google (GOOG), but that’s just icing on the Google lovers’ cake.


All three chain stores — Home Depot, Dick’s and Best Buy — are pictures of strength, not weakness. All three stocks should be bought, not sold, on share weakness, despite whatever the “action” says about how well the companies performed. They have performed superbly against both their fields and against retail in general.

Then the next day, November 21, just in case the message was lost:

Best Buy Co. Inc. Jim Cramer ranked this stock a Buy. Cramer previously ranked this stock a Buy on November 15, 2013. The news about tablets also bodes well for Best Buy, a company that has turned around its ailing retail position to once again become one of the stronger names selling technological products to consumers. Cramer said that retail stocks were especially well-positioned at the moment, and he did not neglect to mention Best Buy near the top of his list of retail all-stars.

Fast forward to today, following a 30% collapse in the stock price in one day. From TheStreet:

It really makes you wonder what went wrong when you see a company down 30% in a single trading session, TheStreet’s Jim Cramer said of Best Buy.


The co-portfolio manager of the Action Alerts PLUS portfolio said most analysts had been bullish on the stock, all the way into the upper $30s.

Uhm, just the analysts?

Those expectations were way off, Cramer said. The company reported sales fell 0.8% for the nine weeks ended Jan. 4, while analysts had expected growth and no real degradation in gross margins.


Cramer advised investors who want to buy the stock to wait until Friday because these types of violent moves tend to pan out over a two-day period.

So buy, buy, buy Best Buy at $40, but wait at $26? Gotcha.

And the piece de resistance comes from CNBC this morning:

Cramer said the electronics retailer needs a “big reset,” and that analysts erred in thinking the company could compete with online shopping outlets. He said the holidays were an “Amazon quarter.”


A steady stream of positive analyst notes before the busy holiday season helped set up Best Buy for its huge 30 percent drop Thursday, CNBC’s Jim Cramer said.


“Each day one came out and then another came out,” Cramer said Thursday on “Squawk on the Street.” “If they had all come out at once, the stock wouldn’t have been pumped to where it was. It was a serial rollout of positives.”

Wait a minute. It was precisely the “steady stream of positive analyst notes” that Cramer used to pitch as the buying catalyst in Best Buy just back on November 19 and as the reason why people should not sell the stock!!!

The people who are selling [Best Buy] don’t realize the power of the reiteration of [analyst] recommendations we are going to get in the next few days.


But… but… less than two months later it was this very reason that Cramer used as an excuse why the company sold off! It really isn’t… it doesn’t… it can’t… it makes no…

Aghhhh #Ref!

Summarizing it all below:


And now we eagerly await the sequel: “Get Poor Instantly

ONLY 2,400 BIG BOX STORES TO CLOSE IN NEXT FEW YEARS

Nothing like a little reality on a Wednesday afternoon. Below is a list of the worst of the worst retailers in the U.S. Hysterically, there are multiple articles about JC Penney this morning and the surge in their stock price yesterday because their dumbass CEO has announced a major change in strategy. Drum roll please. He is going back to having fake sales. The idiots who call themselves financial analysts immediately expounded upon the brilliance of this move. After losing $1 billion of business in one year, this will surely turn the ship back on course.

So solly. The list below, along with the three other failed retailers – Gamestop, Office Max and Radio Shack will be closing thousands of stores in the near future. Just think of all the benefits this will provide. More ghost malls across America. It will do wonders for the Space Available sign manufacturers. Maybe some new retail concepts can gain a foothold – Soup Kitchens R Us, Used Body Parts Thrift Store, or a cafe catering to senior citizens with your choice of cat or dog food. 

It should really test the accounting fraud skills of mall owners, property developers, and our friendly Wall Street bankers as rental income dries up and loan payments on vacant malls become a little challenging. I’m sure Bernanke can convince the FASB to let the banks convert all commercial loans to balloon payment loans with a 50 year term. Therefore, all will be well. No need for cashflow or tenants. I should work for the government.

There should be some great going out of business sales. I’m looking forward to it.

Retailers That Will Close the Most Stores

by | January 29, 2013 at 1:24 PM | Economy, General, Shopping

(AP Photo/Dave Martin)

By Douglas A. McIntyre, Samuel Weigley, Alexander E.M. Hess and Michael B. Sauter, 24/7 Wall St.

It is the time of year again, when America’s largest retailers release those  critical holiday season figures and disclose their annual sales. A review of  these numbers tells us a great deal about how most of the companies will do in  the upcoming year. And while successful retailers in 2012 may add stores this  year, those that have performed very poorly may have to cut locations during  2013 to improve margins or reverse losses.

For many retailers, the sales situation is so bad that it is not a question  of whether they will cut stores, but when and how many. Most recently, Barnes & Noble Inc. (NYSE:  BKS) decided it had too many stores to maintain profits. Its CEO recently  said he plans to close as many as a third of the company’s locations.

Several of America’s largest retailers have been battered for years. Most  have been undermined by a combination of e-commerce competition, often from  Amazon.com Inc. (NASDAQ:  AMZN) and more successful retailers in the same areas. Borders and Circuit  City are two of the best examples of retailers that were destroyed by larger  bricks-and-mortar competition and consumers transitioning to online shopping.  These large, badly damaged retailers could not possibly keep their stores  open.

RELATED: The Most Hated Companies in America

24/7 Wall St. reviewed the weakest large U.S. retailers and picked those that  likely will not be profitable next year if they keep their current location  counts. 24/7 analyzed the retailers’ store counts, recent financial data, online presences, prospects against direct  competitors and precedents set by other large retailers that have downsized by  shuttering locations. We then forecast how many stores each retailer will have  to close this year to sharply increase its prospects financially, even if some  of those location closings do not occur for several years. These forecasts were  based on drops in same-store sales, drops in revenue, a review of direct  competitors, Internet sales and the size of cuts at retailers  in the same sector, if those were available.

5. Barnes & Noble
> Forecast store closings: 190 to  240, per company comments
> Number of U.S. stores: 689
>  One-year stock performance: 8.95%

The move by customers away from print books toward digital books has hurt  Barnes & Noble Inc. (NYSE:  BKS). Same-store sales during the nine-week holiday season fell by 8.2%  year-over-year. The bookseller has tried to offset the declines in physical book  sales with its Nook e-book reader device, but sales of that device fell 13%  compared to the previous year. The company already has begun cutting down  the number of its stores in the past several years. In a recent interview with  the Wall Street Journal, the head of the retail group at Barnes & Noble said  he expected the company to have just 450 to 500 retail stores in 10 years.

RELATED: The Best- and Worst-Run Cities in America

4. Office Depot
> Forecast store closings: 125 to 150
> Number of U.S. stores: 1,114
> One-year stock  performance: 50.7%

Office Depot Inc.’s (NYSE:  ODP) troubles date back to years of competition against OfficeMax Inc. (NYSE:  OMX) and Staples Inc. (NASDAQ:  SPLS), as well as big-box retailers like Walmart. All three stores were  dealt a blow from reduced business activity during the recession, as well as  increased popularity of online retailers such as Amazon. The company’s North  American division reported an operating loss of $21 million in the third quarter  of 2012. Office Depot plans to relocate or downsize as many as 500 locations and  close at least 20 stores. In the third quarter of 2012, the company closed four  stores in the United States, and same-store sales were down by 4%  year-over-year.

3. J.C. Penney
> Forecast store closings: 300 to 350
> Number of U.S. stores: 1,100
> One-year stock performance: -53.6%

J.C. Penney has gone through a rough stretch recently. In the most recent  quarter, same-store sales fell by 26.1% compared to the year-ago period. Even  Internet sales, which are increasing significantly across the retail sector,  have taken a turn for the worst, falling 37.3% in the third quarter, compared to  the prior year. J.C. Penney sales have taken a turn for the worst since former Apple Inc. (NASDAQ:  AAPL) retail chief Ron Johnson took the helm at the company. Johnson’s plan,  among others, has been to wean customers off of heavy discounting and simply  give customers low prices. However, retail strategists and analysts have argued  that Johnson’s plans have created confusion among customers and has been a  further setback to any potential turnaround.

RELATED: States with the Best and Worst School Systems

2. Sears Holding Corp.
> Forecast store closings: Kmart  175 to 225, Sears 100 to 125
> Number of U.S. stores: 2,118
> One-year stock performance: 8.8%

Both Sears and Kmart have been going down the tubes for a long-time, steadily  losing their middle-income shoppers to retailers such as Wal-Mart Stores Inc.  (NYSE:  WMT) and Target Corp. (NYSE:  TGT). Sears Holdings Corp.’s (NASDAQ:  SHLD) same-store sales have declined for six years. In the most recent year,  same-store sales at the namesake franchise fell by 1.6% and at Kmart by 3.7%,  compared to the year-ago period. The company is already in the process of  downsizing its brick-and-mortar presence. In 2012, Sears announced it was  shutting 172 stores. CEO Lou D’Ambrosio is leaving the company in February, to  be replaced by chairman and hedge-fund manager Edward Lampert. Lampert has  minimal operating experience in retail management.

1. Best Buy
> Forecast store closings: 200 to 250
> Number of U.S. stores:1,056
> One-year stock performance: -36.8%

The holiday season was rough for Best Buy Co. Inc. (NYSE:  BBY). Same-store sales declined by 1.4% year-over-year, with international  stores posting a 6.4% decline while U.S. same-store sales were flat.  Companywide, the electronics retailer reported that holiday revenue had declined  to $12.8 billion from $12.9 billion the year before. In the most recent  completed quarter, during which same-store sales declined 4.3%, the company  reported a loss of $0.04 per share. Best Buy has been plagued by customers “showrooming” — looking at products in the store and then purchasing them online — in recent years. Speculation persists  that former chairman and founder Richard Schulze may buy out the company.

To see the full list, visit 24/7 Wall St.

BRICKS & MORTAR RETAILING CRUMBLING

Anyone who thinks J.C. Penney, Sears, Best Buy, or Radio Shack just need to make a few tweaks and everything will return to normal probably believed Bernanke in 2005 when he said the housing market was not a bubble. Retail CEOs and their humungous egos refuse to acknowledge that their business concept is dying. Building new stores in this economy is like putting a gun to your head and pulling the trigger. All of these bricks and mortar retailers who are now going full speed into on-line retailing are cannibalizing their existing mall based stores. These are not incremental sales.

As gas prices shockingly rise again in 2013 and real wages shockingly decline again and two million more people shockingly leave the work force, and the MSM idiots conclude that the economy shockingly went back into recession, consumers will shockingly spend less money in the dying bricks and mortar retailers. Online sales will probably continue to grow, just as it has for the last two decades.

Retail CEOs will be forced to acknowledge that their thousands of physical stores are growing obsolete and dragging them towards bankruptcy. The announced “restructurings” will result in thousands more vacant hulking shells in more dying malls. It already looks like SPACE AVAILABLE is the hottest retailer in America. Mall developers will be defaulting on their loans, but the Wall Street banks will just “restructure” the loans so they don’t have to write them off. Who needs principal and interest payments when you have accountants and 0% loans from the Fed?  

The next time you see a Wall Street shyster recommending Sears stock and talking about the brilliance of Eddie Lampert (aka the next Warren Buffett), remember this chart. Lampert has run this joke of a retailer into the ground. The Wall Street scum touted Sears as an asset play, with thousands of valuable real estate locations. Hysterical. Who exactly is Lampert going to sell these mall locations to? Best Buy? JC Penney? Target? 

The demise of bricks and mortar retailers will be a slow motion train wreck. It already started in 2008 and will pick up steam in 2013.

CAUSE, EFFECT & THE FALLACY OF A RETURN TO NORMALCY

 “Thousands upon thousands are yearly brought into a state of real poverty by their great anxiety not to be thought of as poor.”Robert Mallett


I hear the term de-leveraging relentlessly from the mainstream media. The storyline that the American consumer has been denying themselves and paying down debt is completely 100% false. The proliferation of this Big Lie has been spread by Wall Street and their mouthpieces in the corporate media. The purpose is to convince the ignorant masses they have deprived themselves long enough and deserve to start spending again. The propaganda being spouted by those who depend on Americans to go further into debt is relentless. The “fantastic” automaker recovery is being driven by 0% financing for seven years peddled to subprime (aka deadbeats) borrowers for mammoth SUVs and pickup trucks that get 15 mpg as gas prices surge past $4.00 a gallon. What could possibly go wrong in that scenario? Furniture merchants are offering no interest, no payment deals for four years on their product lines. Of course, the interest rate from your friends at GE Capital reverts retroactively to 29.99% at the end of four years after the average dolt forgot to save enough to pay off the balance. I’m again receiving two to three credit card offers per day in the mail. According to the Wall Street vampire squids that continue to suck the life blood from what’s left of the American economy, this is a return to normalcy.

The definition of normal is: “The usual, average, or typical state or condition”. The fallacy is calling what we’ve had for the last three decades of illusion – Normal. Nothing could be further from the truth. We’ve experienced abnormal psychotic behavior by the citizens of this country, aided and abetted by Wall Street and their sugar daddies at the Federal Reserve. You would have to be mad to believe the debt financed spending frenzy of the last few decades was not abnormal.

The Age of Illusion

“Illusions commend themselves to us because they save us pain and allow us to enjoy pleasure instead. We must therefore accept it without complaint when they sometimes collide with a bit of reality against which they are dashed to pieces.” – Sigmund Freud

In my last article Extend & Pretend Coming to an End, I addressed the commercial real estate debacle coming down the pike. I briefly touched upon the idiocy of retailers who have based their business and expansion plans upon the unsustainable dynamic of an ever expanding level of consumer debt doled out by Wall Street banks. One only has to examine the facts to understand the fallacy of a return to normalcy. We haven’t come close to experiencing normalcy. When retail sales, consumer spending and consumer debt return to a sustainable level of normalcy, the carcasses of thousands of retailers will litter the highways and malls of America. It will be a sight to see. The chart below details the two decade surge in retail sales, with the first ever decline in 2008. Retail sales grew from $2 trillion in 1992 to $4.5 trillion in 2007. The Wall Street created crisis in 2008/2009 resulted in a decline to $4.1 trillion in 2009, but the resilient and still delusional American consumer, with the support of their credit card drug pushers on Wall Street, set a new record in 2011 of $4.7 trillion.

A two decade increase in retail sales of 135% might seem reasonable and normal if wages and household income had grown at an equal or greater rate. But total wages only grew by 125% over this same time frame. Interestingly, the median household income only grew from $30,600 to $49,500, a 62% increase over twenty years. It seems the majority of the benefits accrued to the top 20%, with their aggregate share of the national income exceeding 50% today, versus 47% in 1992 and 43% in the early 1970s. The top 5% are taking home in excess of 21% of the national income versus less than 19% in 1992 and 16% in the early 1970s. It appears the financialization of America, after Nixon closed the gold window and allowed unlimited money printing by the Federal Reserve, has benefitted the few, at the expense of the many. The bottom 80% of households has seen their share of the national income steadily decrease since the early 1970s. There are 119 million households in the United States and 95 million of these households have seen their wages and income stagnate. One might wonder how the 80% were able to fuel a two decade surge in retail sales with such pathetic wage growth.

Your friendly Wall Street banker stepped into the breach and did their part to aid a vast swath of Americans to enslave themselves in debt. As the chart above reveals, the slave owners on Wall Street have been the chief beneficiary of the decades long debt deluge. It seems that charging 18% interest on hundreds of billions in credit card debt can be extremely profitable for the shyster charging the interest. Decades of mailing millions of credit card offers, inundating financially ignorant Americans with propaganda media messages convincing them they needed a bigger house, fancier car, or latest technological gadget and creating complex derivatives that permitted banks to market debt to people guaranteed not to pay them back but not care since they sold the packages of these toxic AAA rated loans to pension funds and little old ladies, has done wonders for earnings per share, stock option awards, executive salaries and bonus pools. It hasn’t done wonders for the net worth of the average American who has been entrapped in the chains of debt, forged link by link over decades of purposeful deception and willful delusion.

The 135% increase in retail sales over two decades may have been slightly enhanced by the 213% increase in consumer credit outstanding. Consumer revolving credit rose from $800 billion to the current level of $2.5 trillion over the last two decades. Those 15 credit cards in our possession were so easy to use that we financed our trips to Dollywood, Sandals, and Euro-Disney, in addition to financing our 72 inch 3D HDTVs, granite countertops, stainless steel appliances, decks, pools, recliners with a built in fridges, home theatre rooms, Coach pocketbooks, Jimmy Cho shoes, Rolex watches, yachts, bigger and better boobs, and of course our smokes and beer. Much has been made about the great de-leveraging by the American consumer. There’s just one inconvenient fact – it hasn’t happened – yet.

Total consumer credit outstanding peaked at $2.58 trillion in July 2008. Today it stands at $2.50 trillion. Revolving credit card debt peaked at $972 billion in September 2008 and subsequently declined to $790 billion by April 2011. It now stands at $801 billion, as living well beyond our means has resumed its appeal. Meanwhile, non-revolving credit for automobiles, boats, student loans, and mobile homes peaked at $1.61 trillion in July 2008 and “crashed” all the way down to $1.58 trillion in May 2010. Once Bennie fired up the printing presses, the government car companies decided to make subprime auto loans again and the Federal government started doling out student loans like a pez dispenser, all was well in the non-revolving consumer loan world. The debt outstanding has soared to $1.7 trillion, a full $90 billion above the pre-crash peak. So, after three and a half years of “austerity” and supposed deleveraging, consumer debt outstanding has fallen by 3%.

The Big Lie of austerity and consumer deleveraging is unquestioned by the talking heads in the mainstream media. They are incapable or unwilling to examine the actual data which substantiates the fact that Americans have NOT deleveraged and have NOT taken austerity to heart. The most basic facts fly in the face of consumers even having the wherewithal to pay down their debt. Median household income has declined from $50,300 in 2008 to $49,400 today. There are 5 million less people employed today than employed in 2008. Total wages in the country have only grown from $6.6 trillion in 2008 to $6.8 trillion today. This increase was concentrated among the .01%, who do not carry credit card debt. They profit from credit card debt. Real disposable personal income has fallen by 5% since the peak in 2008 as Bernanke’s Wall Street bailout zero interest rate policy has caused prices for everything except our houses to surge. The people carrying most of the credit card debt are the least able to pay it off. These are the same people who have swelled the food stamp rolls from 28 million in 2008 to 46.5 million today.

A CNBC bubble headed arrogant bimbo might sarcastically ask, “If the American consumer isn’t deleveraging, than how did revolving credit card debt drop by $182 billion over three years?” Rather than do the minimal research needed to find the answer, they would rather parrot the company/government line. The chart below, compiled from Federal Reserve data, provides the answer. The Wall Street banks have written off $193.3 billion of bad debt since 2008. Now for some basic math, that will probably be over the head of most Wall Street analysts and CNBC parrots. If you start with $972 billion of credit card debt and you write-off $200 billion (assuming another $7 billion in the 4th Quarter of 2011) and your ending balance is $801 billion, how much debt did the American consumer pay down? It’s a trick question. The American consumer ADDED $29 billion of credit card debt since 2008 to go along with the $90 billion of auto and student loan debt ADDED onto their aching backs. So much for the deleveraging storyline. It’s comforting to convince ourselves we’ve changed, but we haven’t. And the powers that be need you to keep believing, so they can continue to keep you enslaved and under their thumbs.

Consumer Credit Card Debt and Charge-off Data (in Billions):

Outstanding Revolving Consumer Debt Outstanding Credit Card Debt Quarterly Credit Card Charge-Off Rate Quarterly Credit Card Charge-Off in Dollars
Q3 2011 $793.4 $777.5 5.63% $10.9
Q2 2011 $787.4 $771.7 5.58% $10.8
Q1 2011 $779.6 $764.0 6.96% $13.3
2010 $826.7 $810.2 $75.1
Q4 2010 $825.7 $810.2 7.70% $15.6
Q3 2010 $806.9 $790.8 8.55% $16.9
Q2 2010 $817.4 $801.1 10.97% $22.0
Q1 2010 $828.5 $811.9 10.16% $20.6
2009 $894.0 $876.1 $83.2
Q4 2009 $894.0 $876.1 10.12% $22.2
Q3 2009 $893.5 $875.6 10.1% $22.1
Q2 2009 $905.2 $887.1 9.77% $21.6
Q1 2009 $923.3 $904.8 7.62% $17.2
Q4 2008 $989.1 $969.3

(Source: CardHub.com, Federal Reserve)

Loving Our Servitude

“There will be, in the next generation or so, a pharmacological method of making people love their servitude, and producing dictatorship without tears, so to speak, producing a kind of painless concentration camp for entire societies, so that people will in fact have their liberties taken away from them, but will rather enjoy it, because they will be distracted from any desire to rebel by propaganda or brainwashing, or brainwashing enhanced by pharmacological methods. And this seems to be the final revolution.” Aldous Huxley

The American people have come to love their servitude through a combination of self- delusion, corporate mass media propaganda, and an irrational desire to appear successful without making the necessary sacrifices required to become successful. The drug of choice used to corral the masses into their painless concentration camp of debt has been Wall Street peddled financing. Can you think of a better business model than being a Wall Street bank? You hand out 500 million credit cards to 118 million households, even though 60 million of the households make less than $50,000. You then create derivatives where you package billions of subprime credit card debt and convince clueless dupes to buy this toxic debt as if it was AAA credit. When the entire Ponzi scheme implodes, you write-off $200 billion of bad debt and have the American taxpayer pick up the tab by having your Ben puppet at the Federal Reserve seize $450 billion of interest income from senior citizens and re-gift it to you through his zero interest rate policy. You then borrow from the Federal Reserve at 0% and charge an average interest rate of 15% on the $800 billion of credit card debt outstanding, generating $120 billion of interest and charging an additional $22 billion of late fees. Much was made of the closing of credit card accounts after the 2008 financial implosion, but most of the accounts closed were old unused credit lines. Now that the American taxpayer has picked up the tab for the 2008 debacle, the Wall Street banks are again adding new credit card accounts.

With 40% of all credit card users carrying a revolving balance averaging $16,000, they are incurring interest charges of $2,400 per year. Some of the best financial analysts in the blogosphere have been misled by the propaganda spewed by the Wall Street media shills at Bloomberg and CNBC. The following chart, which includes mortgage and home equity debt, gives the false impression households are sensibly deleveraging, as household debt as a percentage of disposable personal income has fallen from 115% in June 2009 to 101% today. As I’ve detailed ad nauseam, $200 billion of the $1.2 trillion of “household deleveraging” was credit card write-offs. The vast majority of the remaining $1 trillion of “deleveraging” could possibly be related to the 5 million completed foreclosures since 2009. Of course, this pales in comparison to the unbelievably foolhardy mortgage equity withdrawal of $3 trillion between 2003 and 2008 by the 1% wannabes.  Bloomberg might be a tad disingenuous by excluding the $1 trillion of student loan from their little chart. If student loan debt is included, household debt outstanding surges to $11.5 trillion.

Based on the Bloomberg chart you would assume wrongly that American consumers are using their rising incomes to pay down debt. Besides not actually reducing their debts, the disposable personal income figure provided by the government drones at the BEA includes government transfer payments for Social Security, Medicare, Medicaid, unemployment compensation, food stamps, veterans benefits, and the all- encompassing “other”. Disposable personal income in the 2nd quarter of 2008 reached $11.2 trillion. It has risen by $500 billion, to $11.7 trillion by the end of 2011. Coincidentally, government social transfers have risen by $400 billion over this same time frame, a 20% increase. Excluding government transfers, disposable personal income has risen by a dreadful 1.1%. For the benefit of the slow witted in the mainstream media, every penny of the social welfare transfers has been borrowed. Only a government bureaucrat could believe that borrowing money from the Chinese, handing it out to unemployed Americans and calling it personal income is proof of deleveraging and austerity.

Household debt as a percentage of wages in 2008 was 185%. Today, after the banks have written off $1.2 trillion of debt, this figure stands at 169%. Meanwhile, total credit market debt in our entire system now stands at an all-time high of $54 trillion, up $3 trillion from 2007. It stands at 360% of GDP. In 1992, total credit market debt of $15.2 trillion equaled 240% of GDP ($6.3 trillion). Was it a sign of a rational balanced economic system that total credit market debt grew by 355% in the last two decades while GDP grew by only 238%? I think it is pretty clear the last two decades have not been normal or built upon a sustainable foundation. In the three decades prior to 1990 household debt as a percentage of disposable personal income stayed in a steady range between 60% and 80%. The current level of 101% is abnormal. In order to achieve a sustainable normal level of 80% will require an additional $2 trillion of debt destruction. No one is prepared for this inevitable end result. The impact of this “real” deleveraging will devastate our consumer dependent society.

The colossal accumulation of debt in the last two decades was the cause and abnormally large retail sales were the effect. The return to normalcy will not be pleasant for consumers, retailers, mall owners, local governments or bankers.

Demographics are a Bitch

In addition to an unsustainable level of debt, the pig in the python (also known as the Baby Boomer generation) will relentlessly impact the future of consumer spending and the approaching mass retail closures. Baby Boomers range in age from 51 to 68 today. The chart below details the retail spending by age bracket. Almost 50% of all retail spending is done by those between 35 years old and 54 years old. This makes total sense as these are the peak earnings years for most people and the period in their lives when they are forming households, raising kids and accumulating stuff. As you enter your twilight years, income declines, medical expenses rise, the kids are gone, and you’ve bought all the stuff you’ll ever need. Spending drops precipitously as you enter your 60’s. The spending wave that began in 1990 and reached its apex in the mid-2000s has crested and is going to crash down on the heads of hubristic retail CEOs that extrapolated unsustainable debt financed spending to infinity into their store expansion plans. The added kicker for retailers is the fact Boomers haven’t saved enough for their retirements, have experienced a twelve year secular bear market with another five or ten years to go, are in debt up to their eyeballs, and have seen the equity in their homes evaporate into thin air in the last seven years. This is not a recipe for a spending up swell.

Demographics cannot be spun by the corporate media or manipulated by BLS government drones. They are factual and unable to be altered. They are also predictable. The four population by age charts below paint a four decade picture of reality that does not bode well for retailers over the coming decade. The population by age data correlates perfectly with the spending spree over the last two decades.

  • 26% of the population in the prime spending years between 35 and 54 years old.
  • Only 14% of the population over 65 years old indicating reduced spending.

  • 31% of the population in the prime spending years between 35 and 54 years old.
  • Only 13% of the population over 65 years old indicating reduced spending.

  • 28% of the population in the prime spending years between 35 and 54 years old.
  • A rising 14% of the population over 65 years old indicating reduced spending.

  • 24% of the population in the prime spending years between 35 and 54 years old.
  • A rising 17% of the population over 65 years old indicating reduced spending.

The irreversible descent in the percentage of our population in the 35 to 54 year old prime spending age bracket will have and is already having a devastating impact on retail sales. In addition, the young people moving into the 25 to 34 year old bracket are now saddled with $1 trillion of student loan debt and worthless degrees from the University of Phoenix and the other for-profit diploma mills, luring millions with their Federal government easy loan programs. The fact that 40% of all 20 to 24 year olds in the country are not employed and 26% of all 25 to 34 year olds in the country are not working may also play a role in holding back spending, as jobs are somewhat helpful in generating money to buy stuff. Even with Obama as President they will have a tough time getting onto the unemployment rolls without ever having a job. The 55 and over crowd, who have lived above their means for three decades, will be lucky if they have the resources to put Alpo on the table in the coming years. The unholy alliance of debt, demographics and delusion will result in a retail debacle of epic proportions, unseen by retail head honchoes and the linear thinkers in the media and government.

We’re Not in Kansas Anymore Toto

“We tell ourselves we’re in an economic recovery, meaning we expect to return to a prior economic state, namely, a turbo-charged “consumer” economy fueled by easy credit and cheap energy. Fuggeddabowdit. That part of our history is over. We’ve entered a contraction that will seem permanent until we reach an economic re-set point that comports with what the planet can actually provide for us. That re-set point is lower than we would like to imagine. Our reality-based assignment is the intelligent management of contraction. We don’t want this assignment. We’d prefer to think that things are still going in the other direction, the direction of more, more, more. But they’re not. Whether we like it or not, they’re going in the direction of less, less, less. Granted, this is not an easy thing to contend with, but it is the hand that circumstance has dealt us. Nobody else is to blame for it.” – Jim Kunstler


The brilliant retail CEOs who doubled and tripled their store counts in the last twenty years and assumed they were geniuses as sales soared are getting a cold hard dose of reality today. What they don’t see is an abrupt end to their dreams of ever expanding profits and the million dollar bonuses they have gotten used to. I’m pretty sure their little financial models are not telling them they will need to close 20% of their stores over the next five years. They will be clubbed over the head like a baby seal by reality as consumers are compelled to stop consuming. As we’ve seen, just a moderation in spending has resulted in a collapse in store profitability. Retail CEOs have failed to grasp that it wasn’t their brilliance that led to the sales growth, but it was the men behind the curtain at the Federal Reserve. The historic spending spree of the last two decades was simply the result of easy to access debt peddled by Wall Street and propagated by the easy money policies of Alan Greenspan and Ben Bernanke. The chickens came home to roost in 2008, but the Wizard of Debt – Bernanke – has attempted to keep the flying monkeys at bay with his QE1, QE2, Operation Twist, and ZIRP. As the economy goes down for the count again in 2012, he will be revealed as a doddering old fool behind the curtain.

There are 1.1 million retail establishments in the United States, but the top 25 mega-store national chains account for 25% of all the retail sales in the country. The top 100 retailers operate 243,000 stores and account for approximately $1.6 trillion in sales, or 36% of all the retail sales in the country. They are led by the retail behemoth Wal-Mart and they dot the suburban landscape from Maine to Florida and New York to California. These super stores anchor every major mall in America. There are power centers with only these household names jammed in one place (example near my home: Best Buy, Target, Petsmart, Dicks, Barnes & Noble, Staples). These national chains had already wiped out the small town local retailers by the early 2000s as they sourced their goods from China and dramatically underpriced the small guys. The remaining local retailers have been closing up shop in record numbers in the last few years as the ability to obtain financing evaporated and customers disappeared. The national chains have more staying power, but their blind hubris and inability to comprehend the future landscape will be their downfall.

Having worked for one of the top 100 retailers for 14 years, I understand every aspect of how these mega-chains operate. They all approach retailing from a very scientific manner. They have regression models to project sales based upon demographics, drive times, education, average income, and the size of the market. They will build any store that achieves a certain ROI, based on their models. The scientific method works well when you don’t make ridiculous growth assumptions and properly take into account what your competitors are doing and how the economy will realistically perform in the future years. This is where it goes wrong as these retail chains get bigger, start believing their press clippings and begin ignoring the warnings of sober realists within their organizations. When the models show that cannibalization of sales from putting stores too close together will result in a decline in profits, the CEO will tweak the model to show greater same store growth and a larger increase in the available market due to higher economic growth. They assume margins will increase based upon nothing. At the same time, they will ignore the fact their competitor is building a store 2 miles away. Eventually, using foolhardy assumptions and ignoring facts leads to declining sales and profitability.

There is no better example of this than Best Buy. They increased their U.S. store count from 500 in 2002 to 1,300 today. That is a 160% increase in store count. For some perspective, national retail sales grew by 42% over this same time frame. Their strategy wiped out thousands of mom and pop stores and drove their chief competitor – Circuit City – into liquidation. But their hubris caught up to them. There sales per store has plummeted from $36 million per store in 2007 to less than $28 million per store today, a 24% decline in just five years. They have cannibalized themselves and have seen a $6 billion increase in revenue lead to $100 million LESS in profits. It appears the 444 stores they have built since 2007 have a net negative ROI. Top management is now in full scramble mode as they refuse to admit their strategic errors. Instead they cut staff and use upselling gimmicks like service plans, technical support and deferred financing to try and regain profitability. They will not admit they have far too many stores until it is too late. They will follow the advice of an earnings per share driven Wall Street crowd and waste their cash buying back stock. We’ve seen this story before and it ends in tears. I was in a Best Buy last week at 6:00 pm and there were at least 50 employees servicing about 10 customers. Tick Tock.

Best Buy - Annual Store Count Growth

Best Buy - Annual Sales per Store

You would have to be blind to not have noticed the decade long battles between the two biggest drug store chains and the two biggest office supply chains. Walgreens and CVS have been in a death struggle as they have each increased their store counts by 80% to 90% in the last 10 years. Both chains have been able to mask poor existing store growth by opening new stores. They are about to hit the wall. I now have six drug stores within five miles of my house all selling the exact same products. Every Wal-Mart and Target has their own pharmacy. At 2:00 pm on a Sunday afternoon I walked into the Walgreens near my house and there were six employees, a pharmacist and myself in the store. This is a common occurrence in this one year old store. It will not reach its 3rd birthday.

Walgreens - Annual Store Count Growth

CVS - Annual Retail Store Growth

Further along on the downward death spiral are Staples and Office Depot. They both increased their store counts by 50% to 60% in the last decade. Despite adding almost 200 stores since 2007, Staples has managed to reduce their profits. Sales per store have declined by 20% since 2006. Office Depot has succeeded in losing almost $2 billion in the last five years. These fools are actually opening new stores again despite overseeing a 36% decrease in sales per store over the last decade. These stores sell paper clips, paper, pens, and generic crap you can purchase at 100,000 other stores across the land or with a click of you mouse. Their business concept is dying and they don’t know it or refuse to acknowledge it.

Staples - Annual Store Count Growth

Office Depot - Annual Store Count Growth

Even well run retailers such as Kohl’s and Bed Bath & Beyond have hit the proverbial wall. Remember that total retail sales have only grown by 42% in the last ten years while Kohl’s has increased their store count by 180% and Bed Bath & Beyond has increased their store count by 175%. Despite opening 200 new stores since 2007, Kohl’s profits are virtually flat. Sales per store have deflated by 26% over the last decade as over-cannibalization has worked its magic. Bed Bath & Beyond has managed to keep profits growing as they drove Linens & Things into bankruptcy, but they risk falling into the Best Buy trap as they continue to open new stores. Their sales per store are well below the levels of 2002. Again, there is very little differentiation between these retailers as they all sell cheap crap from Asia, sold at thousands of other stores across the country. With home formation stagnant, where will the growth come from? Answer: It won’t come at all.

Kohl's - Annual Store Count Growth

Bed Bath & Beyond - Annual Store Count Growth

The stories above can be repeated over and over when analyzing the other mega-retailers that dominate our consumer crazed society. Same store sales growth is stagnant. The major chains have over cannibalized themselves. Their growth plans were based upon a foundation of ever increasing consumer debt and ever more delusional Americans spending money they don’t have. None of these retailers has factored a contraction in consumer spending into their little models. But that is what is headed their way. They saw the tide go out in 2009 but they’ve ventured back out into the surf looking for some trinkets, not realizing a tsunami is on the way. The great contraction began in 2008 and has been proceeding in fits and starts for the last four years. The increase in retail sales over the last two years has been driven by inflation, not increased demand. The efforts of the Federal Reserve and Wall Street to reignite our consumer society by pushing subprime debt once more will ultimately fail – again. The mega-retailers will be forced to come to the realization they have far too many stores to meet a diminishing demand.

The top 100 mega-retailers operate 243,000 stores. Will our contracting civilization really need or be able to sustain 14,000 McDonalds, 17,000 Taco Bells & KFCs, 24,000 Subways, 9,000 Wendys, 7,000 7-11s, 8,000 Walgreens, 7,000 CVS’, 4,000 Sears & Kmarts, 11,000 Starbucks, 4,000 Wal-Marts, 1,700 Lowes and 1,800 Targets in five years?  As our economy contracts and more of our dwindling disposable income is directed towards rising energy and food costs, retailers across the land will shut their doors. Try to picture the impact on this country as these retailers are forced to close 50,000 stores. Where will recent college graduates and broke Baby Boomers work? The most profitable business of the future will be producing Space Available and For Lease signs. Betting on the intelligence of the American consumer has been a losing bet for decades. They will continue to swipe that credit card at the local 7-11 to buy those Funions, jalapeno cheese stuffed pretzels with a side of cheese dipping sauce, cartons of smokes, and 32 ounce Big Gulps of Mountain Dew until the message on the credit card machine comes back DENIED.

There will be crescendo of consequences as these stores are closed down. The rotting hulks of thousands of Sears and Kmarts will slowly decay; blighting the suburban landscape and beckoning criminals and the homeless. Retailers will be forced to lay-off hundreds of thousands of workers. Property taxes paid to local governments will dry up, resulting in worsening budget deficits. Sales taxes paid to state governments will plummet, forcing more government cutbacks and higher taxes. Mall owners and real estate developers will see their rental income dissipate. They will then proceed to default on their loans. Bankers will be stuck with billions in loan losses, at least until they are able to shift them to the American taxpayer – again. No politician, media pundit, Federal Reserve banker, retail CEO, or willfully ignorant mindless consumer wants to admit the truth that the last three decades of debt delusion are coming to a tragic bitter end. The smarmy acolytes of Edward Bernays on Wall Street and in corporate America have successfully used propaganda and misinformation to lure generations of weak minded people into debt servitude. But, at the end of the day, you need cash to service the debt. Mind control doesn’t pay the bills.  We will eventually return to normal, just not the normal many had in mind.

“If we understand the mechanism and motives of the group mind, it is now possible to control and regiment the masses according to our will without them knowing it.” – Edward Bernays


EXTEND & PRETEND COMING TO AN END

The real world revolves around cash flow. Families across the land understand this basic concept. Cash flows in from wages, investments and these days from the government. Cash flows out for food, gasoline, utilities, cable, cell phones, real estate taxes, income taxes, payroll taxes, clothing, mortgage payments, car payments, insurance payments, medical bills, auto repairs, home repairs, appliances, electronic gadgets, education, alcohol (necessary in this economy) and a countless other everyday expenses. If the outflow exceeds the inflow a family may be able to fund the deficit with credit cards for awhile, but ultimately running a cash flow deficit will result in debt default and loss of your home and assets. Ask the millions of Americans that have experienced this exact outcome since 2008 if you believe this is only a theoretical exercise. The Federal government, Federal Reserve, Wall Street banks, regulatory agencies and commercial real estate debtors have colluded since 2008 to pretend cash flow doesn’t matter. Their plan has been to “extend and pretend”, praying for an economic recovery that would save them from their greedy and foolish risk taking during the 2003 – 2007 Caligula-like debauchery.

I wrote an article called Extend and Pretend is Wall Street’s Friend about one year ago where I detailed what I saw as the moneyed interest’s master plan to pretend that hundreds of billions in debt would be repaid, despite the fact that declining developer cash flow and plunging real estate prices would make that impossible. Here are a couple pertinent snippets from that article:

“A systematic plan to create the illusion of stability and provide no-risk profits to the mega-Wall Street banks was implemented in early 2009 and continues today. The plan was developed by Ben Bernanke, Hank Paulson, Tim Geithner and the CEOs of the criminal Wall Street banking syndicate. The plan has been enabled by the FASB, SEC, IRS, FDIC and corrupt politicians in Washington D.C. This master plan has funneled hundreds of billions from taxpayers to the banks that created the greatest financial collapse in world history.

Part two of the master cover-up plan has been the extending of commercial real estate loans and pretending that they will eventually be repaid. In late 2009 it was clear to the Federal Reserve and the Treasury that the $1.2 trillion in commercial loans maturing between 2010 and 2013 would cause thousands of bank failures if the existing regulations were enforced. The Treasury stepped to the plate first. New rules at the IRS weren’t directly related to banking, but allowed commercial loans that were part of investment pools known as Real Estate Mortgage Investment Conduits, or REMICs, to be refinanced without triggering tax penalties for investors.

The Federal Reserve, which is tasked with making sure banks loans are properly valued, instructed banks throughout the country to “extend and pretend” or “amend and pretend,” in which the bank gives a borrower more time to repay a loan. Banks were “encouraged” to modify loans to help cash strapped borrowers. The hope was that by amending the terms to enable the borrower to avoid a refinancing that would have been impossible, the lender would ultimately be able to collect the balance due on the loan. Ben and his boys also pushed banks to do “troubled debt restructurings.” Such restructurings involved modifying an existing loan by changing the terms or breaking the loan into pieces. Bank, thrift and credit-union regulators very quietly gave lenders flexibility in how they classified distressed commercial mortgages. Banks were able to slice distressed loans into performing and non-performing loans, and institutions were able to magically reduce the total reserves set aside for non-performing loans.

If a mall developer has 40% of their mall vacant and the cash flow from the mall is insufficient to service the loan, the bank would normally need to set aside reserves for the entire loan. Under the new guidelines they could carve the loan into two pieces, with 60% that is covered by cash flow as a good loan and the 40% without sufficient cash flow would be classified as non-performing. The truth is that billions in commercial loans are in distress right now because tenants are dropping like flies. Rather than writing down the loans, banks are extending the terms of the debt with more interest reserves included so they can continue to classify the loans as “performing.” The reality is that the values of the property behind these loans have fallen 43%. Banks are extending loans that they would never make now, because borrowers are already grossly upside-down.”

Master Plan Malfunction

You have to admire the resourcefulness of the vested interests in disguising disaster and pretending that time will alleviate the consequences of their insatiable greed, blatant criminality and foolish risk taking. Extending bad loans and pretending they will be repaid does not create the cash flow necessary to actually pay the interest and principal on the debt. The chart below reveals the truth of what happened between 2005 and 2008 in the commercial real estate market. There was an epic feeding frenzy of overbuilding shopping centers, malls, office space, industrial space and apartments. During the sane 1980’s and 1990’s, commercial real estate loan issuance stayed consistently in the $500 billion to $700 billion range. The internet boom led to a surge to $1.1 trillion in 2000, with the resultant pullback to $900 billion by 2004. But thanks to easy Al and helicopter Ben, the bubble was re-inflated with easy money and zero regulatory oversight. Commercial real estate loan issuance skyrocketed to $1.6 trillion per year by 2008. Bankers sure have a knack for doing the exact opposite of what they should be doing at the exact wrong time. They doled out a couple trillion of loans to delusional developers at peak prices just prior to a historic financial cataclysm.

The difference between bad retail mortgage loans and bad commercial loans is about 25 years. Commercial real estate loans usually have five to seven year maturities. This meant that an avalanche of loans began maturing in 2010 and will not peak until 2013. With $1.2 trillion of loans coming due between 2010 and 2013, disaster for the Wall Street Too Big To Fail banks awaited if the properties were valued honestly. A perfect storm of declining property values and plunging cash flows for developers should have resulted in enormous losses for Wall Street banks and their shareholders, resulting in executives losing not only their obscene bonuses but even their jobs. Imagine the horror for the .01%.

The fact is that commercial property prices are currently 42% below the 2007 – 2008 peak. The slight increase in the national index is solely due to strong demand for apartments, as millions of Americans have been kicked out of their homes by Wall Street bankers using fraudulent loan documentation to foreclose on them. The national index has recently resumed its fall. Industrial and retail properties are leading the descent in prices according to Moodys. The master plan of extend and pretend was implemented in 2009 and three years later commercial real estate prices are 10% lower, after the official end of the recession.

Part one of the “extend and pretend” plan has failed. Part two anticipated escalating developer cash flows as the economy recuperated, Americans resumed spending like drunken sailors and retailers began to rake in profits at record levels again. Reality has interfered with their desperate last ditch gamble. Office vacancies remain at 17.3%, close to 20 year highs, as 12.3 million square feet of new space came to market in 2011. Vacancies are higher today than they were at the end of the recession in December 2009. The recovery in cash flow has failed to materialize for commercial developers. Strip mall vacancies at 11% remain stuck at 20 year highs. Regional mall vacancies at 9.2% linger near all-time highs. Vacancies remain elevated, with no sign of decreasing. Despite these figures, an additional 4.9 million square feet of new retail space was opened in 2011. The folly of this continued expansion will be revealed as bricks and mortar retailers are forced to close thousands of stores in the next five years.

It is clear the plan put into place three years ago has failed. Extending and pretending doesn’t service the debt. Only cash flow can service debt.

Now What?

Extending and pretending that hundreds of millions in commercial loans were payable for the last three years is now colliding with a myriad of other factors to create a perfect storm in 2012 and 2013. The extension of maturities has now set up a far more catastrophic scenario as described by Chris Macke, senior real estate strategist at CoStar Group:

“As banks and property owners continue to partake in loan extensions amid a softening economy, commercial banks continue to “delay and pray” that property values will rise. Many loans are piled up and concentrated in this year, and at the same time, the economy is slowing. This dilemma has resulted in the widening of what is commonly termed the “loan maturity cliff,” which is attributed to the so called extend-and-pretend loans. During the market downturn, lenders extended the maturity dates of loans with properties that had current values below their balances. Instead, however the practice has resulted in a race for property values to try to catch up with the loan maturity dates.”

The Federal Reserve, Wall Street banks, Mortgage Bankers Association and the rest of the confederates of collusion will continue the Big Lie for as long as possible. They point to declining commercial default rates as proof of improvement. The chart below details the 4th quarter default rates for real estate loans over the last six years. Default rates in the 4th quarter of 2009 peaked for all real estate loan types. Still, today’s default rate is 450% higher than the rate in 2006. A critical thinker might ask how commercial default rates could fall from 8.75% to 6.12% when commercial vacancies have increased and commercial property values have fallen. It’s amazing how low default rates can fall when a bank doesn’t require payments or collateral to back up the loan and can utilize accounting gimmicks to avoid write-offs.


Real estate loans

All

Booked in domestic offices

Residential 

Commercial 

Farmland

2011:4

8.22

9.86

6.12

3.26

2010:4

9.07

10.11

7.98

3.61

2009:4

9.55

10.45

8.75

3.43

2008:4

6.03

6.64

5.49

2.28

2007:4

2.90

3.07

2.75

1.51

2006:4

1.70

1.95

1.32

1.41

The reality as detailed by honest analysts is much different than the numbers presented by Ben Bernanke and his banker cronies. A recent article from the Urban Land Institute provides some insight into the current state of the market:

 Ann Hambly, who previously ran the commercial servicing departments at Prudential, Bank of New York, Nomura, and Bank of America said a wave of defaults is coming in commercial mortgage–backed securities (CMBS). And Carl Steck, a principal in MountainSeed Appraisal Management, an Atlanta-based firm that deals in the commercial real estate space, said property values are still falling.

Noting that CMBS investors booked $6 billion in real losses in 2011 and have already taken on $2 billion more in losses so far this year, Hambly told reporters in a private briefing that “it’s going to take a miracle” for many borrowers to refinance their deals when they come due between now and 2017.

Carl Steck said that lenders who are taking over the portfolios of failed institutions are finding that the values of the loans “are coming in a lot lower than they ever thought they would.” And as a result, he thinks a “fire sale” of commercial loans is just over the horizon.

Analysts expect 2012 to be a record-setting year for commercial real estate defaults. Last week delinquencies for office and retail loans hit their highest-ever levels, according to Fitch Ratings. The value of all delinquent commercial loans is now $57.7 billion, according to Trepp, LLC. If you think the criminal Wall Street banks limited their robo-signing fraud to just poor homeowners, you would be mistaken. The fraud uncovered in the commercial lending orbit will dwarf the residential swindle. Research by Harbinger Analytics Group shows the widespread use of inaccurate, fraudulent documents for land title underwriting of commercial real estate financing. According to the report:

This fraud is accomplished through inaccurate and incomplete filings of statutorily required records (commercial land title surveys detailing physical boundaries, encumbrances, encroachments, etc.) on commercial properties in California, many other western states and possibly throughout most of the United States. In the cases studied by Harbinger, the problems are because banks accepted the work of land surveyors who “have committed actual and/or constructive fraud by knowingly failing to conduct accurate boundary surveys and/or failing to file the statutorily required documentation in public records.”


Your Ad Here

The Wall Street geniuses bundled commercial real estate mortgages and re-sold them as securities around the world. The suckers holding those securities, already staggering from the overabundance of empty office space, will be devastated if it turns out they have no claim to the properties. They will rightly sue the lenders for falsely representing the properties. Mortgage holders in these cases may also turn to their title insurance to cover any losses. It is unknown if the title insurance companies have the wherewithal to withstand enormous claims on costly commercial properties. It looks like that light at the end of the tunnel is bullet train headed our way.

One of the fingers in the dyke of the “extend and pretend” dam has been removed by the FASB. The new leak threatens to turn into a gusher.


Andy Miller, cofounder of Miller Frishman Group, and one of the few analysts who saw the real estate crash coming two years before it surprised Bernanke and the CNBC cheerleaders sees a flood of defaults on the horizon. In a recent interview with The Casey Report Miller details a dramatic turn for the worse in the commercial real estate market he has witnessed in the last few months. His company deals with distressed commercial real estate. This segment of his business was booming in 2009 and into the middle of 2010. Then magically, there was no more distress as the “extend and pretend” plan was implemented by the governing powers. The distressed market dried up completely until November 2011. Miller describes what happened next:

“All of a sudden, right after Thanksgiving in 2011, the floodgates opened again. In the last six weeks we probably picked up seven or eight receiverships – and we’re now seeing some really big-ticket properties with major loans on them that have gone into distress, and they’re all sharing some characteristics in common. In 2008 and 2009, these borrowers were put on a workout or had a forbearance agreement put into place with their lenders. In 2009, their lenders were thinking, “Let’s do a two- or three-year workout with these guys. I’m sure by 2012 this market is going to get a lot better.” Well, 2012 is here now, and guess what? It’s not any better. In fact I would argue that it’s still deteriorating.”

Why the sudden surge in distressed properties coming to market in late 2011? It seems the FASB finally decided to grow a pair of balls after being neutered by Bernanke and Geithner in 2009 regarding mark to market accounting. They issued an Accounting Standards Update (ASU) that went into effect for all periods after June 15, 2011called Clarifications to Accounting for Troubled Debt Restructurings by Creditors. Essentially, if a lender is involved in a troubled debt restructuring with a debtor, including a forbearance agreement or a workout, the property MUST be marked to market. Andy Miller understands this is the beginning of the end for “extend and pretend”:

“I believe it’s a huge deal because it means you don’t have carte blanche anymore to kick the can down the road. After all, kicking the can down the road was a way to avoid taking a big hit to your capital. Well, you can’t do that anymore. It forces you to cut through the optical illusions by writing this asset to its fair market value.”

Ben Bernanke and the Wall Street banks are running out tricks in their bag of deception. Wall Street banks created billions in profits by using accounting entries to reduce their loan loss reserves. They’ve delayed mortgage foreclosures for two years to avoid taking the losses on their loan portfolios. They’ve pretended their commercial loan portfolios aren’t worth 50% less than their current carrying value. Bernanke has stuffed his Federal Reserve balance sheet with billions in worthless commercial mortgage backed securities. The Illusion of Recovery is being revealed as nothing more than a two bit magician’s trick. In the end it always comes back to cash flow. The debt cannot be serviced and must be written off. Thinking the American consumer will ride to the rescue is a delusional flight of the imagination.

Apocalypse Now – The Future of Retailers & Mall Owners


When I moved to my suburban community in 1995 there were two thriving shopping centers within three miles of my home and a dozen within a ten mile radius. Seventeen years later the population has increased dramatically in this area, and these two shopping centers are in their final death throes. The shopping center closest to my house has a vacant Genuardi grocery store(local chain bought out and destroyed by Safeway), vacant Blockbuster, vacant Sears Hardware, vacant Donatos restaurant, vacant book store, and soon to be vacant Pizza Pub. It’s now anchored by a near bankrupt Rite Aid and a Dollar store. This ghost-like strip mall is in the midst of a fairly thriving community. Anyone with their eyes open as they drive around today would think Space Available is the hot new retailer. According to the ICSC there are 105,000 shopping centers in the U.S., occupying 7.3 billion square feet of space. Total retail square feet in the U.S. tops 14.2 billion, or 46 square feet for every man, woman and child in the country. There are more than 1.1 million retail establishments competing for every discretionary dollar from consumers.

Any retailer, banker, politician, or consumer who thinks we will be heading back to the retail glory days of 2007 is delusional. Retail sales reached a peak of $375 billion per month in mid 2008. Today, retail sales have reached a new “nominal” peak of $400 billion per month. Even using the highly questionable BLS inflation figures, real retail sales are still below the 2008 peak. Using the inflation rate provided by John Williams at Shadowstats, as measured the way it was in 1980, real retail sales are 15% below the 2008 peak. The unvarnished truth is revealed in the declining profitability of major retailers and the bankruptcies and store closings plaguing the industry. National retail statistics and recent retailer earnings reports paint a bleak picture, and it’s about to get bleaker.

Retail sales in 1992 totaled $2.0 trillion. By 2011 they had grown to $4.7 trillion, a 135% increase in nineteen years. A full 64% of this rise is solely due to inflation, as measured by the BLS. In reality, using the true inflation figures, the entire increase can be attributed to inflation. Over this time span the U.S. population has grown from 255 million to 313 million, a 23% increase. Median household income has grown by a mere 8% over this same time frame. The increase in retail sales was completely reliant upon the American consumers willing to become a debt slaves to the Wall Street bank slave masters. It is obvious we have learned to love our slavery. Credit card debt grew from $265 billion in 1992 to a peak of $972 billion in September of 2008, when the financial system collapsed. The 267% increase in debt allowed Americans to live far above their means and enriched the Wall Street banking cabal. The decline to the current level of $800 billion was exclusively due to write-offs by the banks, fully funded by the American taxpayer.

Credit cards are currently being used far less as a way to live beyond your means, and more to survive another day. This can be seen in the details underlying the monthly retail sales figures. On a real basis, with inflation on the things we need to live like energy, food and clothing rising at a 10% clip, retail sales are declining. Gasoline, food and medicine are the drivers of retail today. The surge in automobile sales is just another part of the “extend and pretend” plan, as Bernanke provides free money to banks and finance companies so they can make seven year 0% interest loans to subprime borrowers. Easy credit extended to deadbeats will not create the cash flow needed to repay the debt. The continued penetration of on-line retailers does not bode well for the dying bricks and mortar zombie retailers like Sears, JC Penny, Macys and hundreds of other dead retailers walking. With gas prices soaring, the economy headed back into recession and the Federal Reserve out of ammunition, Andy Miller sums up the situation nicely:

“Well, I think we’re headed into an economy right now where there’s just not a lot of upside. Do we think, for example, in the shopping center business, that retail and consumer spending is going to go way up? Certainly not. I think that as times get tougher and unemployment remains high, it’s going to have a negative impact on consumer spending. In almost in any city in America right now, it doesn’t take a genius to see how much retail space has been constructed and is sitting there empty. Vacancy rates are as high as I’ve seen them in almost every venue that I visit. I’m very concerned about the retail business, and I think it’s extremely dangerous right now.”

The major big box retailers have been reporting their annual results in the last week. The results have been weak and even those whose results are being spun as positive by the mainstream media are performing dreadfully compared to 2007. A few examples are in order:

  • Home Depot was praised for their fantastic 2011 result of $70 billion in sales and $6.7 billion of income. The MSM failed to mention that sales are $7 billion lower than 2007, despite having 18 more stores and profit exceeded $7.2 billion in 2007. Sales per square foot have declined from $335 to $296, a 12% decline in four years.
  • Target made $2.9 billion on revenue of $67 billion in 2011. $953 million of this profit was generated from their credit card this year versus $744 million last year because they reduced their loan loss reserve by $260 million. Target is supposedly a retailer, but 33% of their bottom line comes from a credit card they desperately tried to sell in 2009. They have increased their store count from 1,600 to 1,800 since 2007 and their profit is flat. Sales per square foot have declined from $307 to $280 since 2007.
  • J.C. Penney is a bug in search of a windshield. Their sales have declined from $20 billion in 2007 to $17 billion in 2011 despite increasing their store count from 1,067 to 1,114. Their profits have plunged from $1.1 billion to a loss of $152 million. Their sales per square foot have plunged by 14% since 2007. Turning to a former Apple marketing guru as their new CEO will fail. Everyday low pricing is not going to work on Americans trained like monkeys to salivate at the word SALE.
  • The death spiral of Sears/Kmart is a sight to see. As the anchor in hundreds of dying malls across the land, this retail artifact will be joining Montgomery Ward on the scrap heap of retail history in the next few years. Its eventual bankruptcy and liquidation will leave over 4,000 rotting carcasses to spoil our landscape. The one-time genius and heir to the Warren Buffett mantle – Eddie Lampert – has proven to be as talented at retailing as his buddy Jim Cramer is at picking stocks. He has managed to decrease sales by $10 billion, from $53 billion to $43 billion in the space of four years despite opening 247 new stores. That is not an easy feat to accomplish. At least he was able to reduce profits from $1.5 billion to $133 million and drive the sales per square foot in his stores down by 15%.
  • Widely admired Best Buy has screwed the pooch along with the other foolish retailers that have massively over expanded in the last decade. They have increased their domestic sales from $31 billion to $37 billion, a 19% increase in four years. This increase only required a 444 store expansion, from 873 stores to 1,317 stores. A 51% increase in store count for a 19% increase in sales seems to be a bad trade-off. Their chief competitor – Circuit City – went belly-up during this time frame, making the relative sales increase even more pathetic. The $6 billion increase in sales resulted in a $100 million decline in profits and a 13% decrease in sales per square foot since 2007. It might behoove the geniuses running this company to stop building new stores.
  • The retailer that committed the greatest act of suicide in the last decade is Lowes. Their act of hubris, as Home Depot struggled in the mid 2000’s, is coming home to roost today. They increased their store count from 1,385 to 1,749 over four years. This 26% increase in store count resulted in an increase in sales from $47 billion to $49 billion, a 4% boost. Profitability has plunged from over $3 billion to under $2 billion over this same time frame. They’ve won the efficiency competition by seeing their sales per square feet fall by an astounding 21% over the last four years. I’ve witnessed their ineptitude as they opened four stores within 10 miles of each other in Montgomery County, PA and cannibalized themselves to death. The newest store, three miles from my house, is a pleasure to shop as there is generally more staff than customers even on a Saturday afternoon. This beautiful new store will be vacant rotting hulk within three years.

Do the results of these retail giants jive with the retail recovery stories being spun by the corporate mainstream media? When you see some stock shill on CNBC touting one of these retailers, realize he is blowing smoke up your ass. These six struggling retailers account for over 1.1 billion square feet of retail space in the U.S. One or more of them anchor every mall in America. Wal-Mart (600 million square feet in the U.S.) and Kohl’s (82 million square feet) continue to struggle as their lower middle class customers can barely make ends meet. The perfect storm is developing and very few people see it coming. Extend and pretend has failed. Americans are tapped out. Home prices continue to fall. Energy and food prices continue to rise. Wages are stagnant. Job growth is weak. Middle and lower class Americans are using credit cards just to pay their basic living expenses. The 99% are not about to go on a spending binge.

As consumers reduce consumption, retailers lose profits and will be forced to close stores. It is likely that at least 150,000 retail stores will need to close in the next five years. Less stores means less rent for mall developers. Less rent means the inability to service their debt as the value of their property declines with the outcome of Ghost Malls haunting your community. Maybe good old American ingenuity will come to the rescue as we convert ghost malls into FEMA prison camps for uncharged Ron Paul supporters, Obamacare death panel implementation centers, TSA groping educational facilities, housing for the millions kicked out of their homes by the Wall Street .01%ers, and bomb shelters for the imminent Iranian invasion.

Debt default means huge losses for the Wall Street criminal banks. Of course the banksters will just demand another taxpayer bailout from the puppet politicians. This repeat scenario gives new meaning to the term shop until you drop. Extending and pretending can work for awhile as accounting obfuscation, rolling over bad debts, and praying for a revival of the glory days can put off the day of reckoning for a couple years. Ultimately it comes down to cash flow, whether you’re a household, retailer, developer, bank or government. America is running on empty and extending and pretending is coming to an end.