THE WORSE THINGS GET FOR YOU, THE BETTER THEY GET FOR WALL STREET

On October 2 the BLS reported absolutely atrocious employment data, with virtually no job growth other than the phantom jobs added by the fantastically wrong Birth/Death adjustment for all those new businesses springing up around the country. The MSM couldn’t even spin it in a positive manner, as the previous two months of lies were adjusted significantly downward. What a shocker. At the beginning of that day the Dow stood at 16,250 and had been in a downward trend for a couple months as the global economy has been clearly weakening. The immediate rational reaction to the horrible news was a 250 point plunge down to the 16,000 level. But by the end of the day the market had finished up over 200 points, as this terrible news was immediately interpreted as good news for the market, because the Federal Reserve will never ever increase interest rates again.

Over the next three weeks, the economic data has continued to deteriorate, corporate earnings have been crashing, and both Europe and China are experiencing continuing and deepening economic declines. The big swinging dicks on Wall Street have programmed their HFT computers to buy, buy, buy. The worse the data, the bigger the gains. The market has soared by 1,600 points since the low on October 2. A 10% surge based upon lousy economic info, as the economy is either in recession or headed into recession, is irrational, ridiculous, and warped, just like our financial system. This is what happens when crony capitalism takes root like a foul weed and is bankrolled by a central bank that cares only for Wall Street, while throwing Main Street under the bus.

Continue reading “THE WORSE THINGS GET FOR YOU, THE BETTER THEY GET FOR WALL STREET”

EXISTING HOME SALES SURGE – YEAH RIGHT!!!

It seems the NAR goes to the BLS school of reporting fake numbers. Sales didn’t really plunge by 6.5% in September, once you adjust them in your excel spreadsheet. They soared!!!

Same shit, different day.

So it goes.


LIES, DAMNED LIES & STATISTICS

The government released their monthly CPI report this week. Even though it came in at an annualized rate of 3.6%, they and their mouthpieces in the corporate mainstream media dutifully downplayed the uptrend. They can’t let the plebs know the truth. That might upend their economic recovery storyline and put a crimp into their artificial free money, zero interest rate, stock market rally. If they were to admit inflation is rising, the Fed would be forced to raise rates. That is unacceptable in our rigged .01% economy. There are banker bonuses, CEO stock options, corporate stock buyback earnings per share goals and captured politician elections at stake.

The corporate MSM immediately shifted the focus to the annual CPI figure of 0.1%. That’s right. Your government keepers expect you to believe the prices you pay to live your everyday life have been essentially flat in the last year. Anyone who lives in the real world, not the BLS Bizarro world of models, seasonal adjustments, hedonic adjustments, and substitution adjustments, knows this is a lie. The original concept of CPI was to measure the true cost of maintaining a constant standard of living. It should reflect your true inflation of out of pocket costs to live a daily existence in this country.

Instead, it has become a manipulated statistic using academic theories as a cover to systematically under-report the true level of inflation. The purpose has been to cut annual cost of living adjustments to Social Security and other government benefits, while over-estimating the true level of GDP. Artificially low inflation figures allow the mega-corporations who control the country to keep wage increases to workers low. Under-reporting the true level of inflation also allows the Federal Reserve to keep their discount rate far lower than it would be in an honest free market. The Wall Street banks, who own and control the Federal Reserve, are free to charge 18% on credit card balances while paying .25% to savers. The manipulation of the CPI benefits the vested interests, impoverishes the masses, and slowly but surely contributes to the destruction of our economic system.

A deep dive into Table 2 from the BLS reveals some truth and uncovers more lies. Their weighting of everyday living expenditures is warped and purposefully misleading. Let’s look at the annual increases in some food items we might consume in the course of a month, living in this empire of lies:

  • Ground Beef – 10.1%
  • Roast Beef – 11.8%
  • Steak – 11.1%
  • Eggs – 21.8%
  • Chicken – 3.7%
  • Coffee – 3.4%
  • Sugar – 4.2%
  • Candy – 4.6%
  • Snacks – 3.5%
  • Salt & Seasonings – 5.3%
  • Food Away From Home – 3.0%

Continue reading “LIES, DAMNED LIES & STATISTICS”

WALL STREET HEDGE FUNDS FLEE HOUSING MARKET

Yes, the housing recovery storyline keeps being pushed back month after month. Existing home sales plunged by 6.1% in one month. Existing home sales are 8% LOWER than they were in July of 2013. Does that happen in a recovery? Sales of existing homes were up 2% over last year, but the distribution of sales tells the real story. Homes selling for less than $100k crashed by 16%. Homes selling between $100k and $250k fell by 1%. These two categories account for 61% of all home sales.

The NAR touts the fact that home prices were 5% higher than last year. What they did not tell you is that home prices have fallen for the 5th month in a row and are now 7.5% LOWER than they were in June. Is that a sign of a housing recovery?

Good old Larry Yun, the latest NAR shill who will write a book after he leaves about how it was his job to lie, assures us this is just a one month aberration caused by the stock market going down for a few days in October. Everyone knows that you make a home purchase decision based upon the day to day fluctuations in the stock market. So this douchebag blames the plunge in home sales on the stock market. Let’s test his hypothesis.

Dow on Oct 1 – 16,801

Dow on Oct 31 – 17,390

Dow on Dec 1 – 17,776

So the Dow was up about 1,000 points in October and November and this pitiful excuse for a human being blames the housing plunge on the stock market?

Here is the facts jack. Blackrock and the rest of the Wall shysters see the writing on the wall. Their master plan to drive prices higher with free money from the Fed worked to perfection. The investors and flippers are exiting stage left. At one point cash sales reached 36% of all transactions. It has plunged to 25% of all transactions as Wall Street sells before the flippers and average people left holding the bag. It’s no coincidence prices are falling. The fake housing recovery is over. Sales and prices will continue to fall.

Real people have lower real wages than they did at the depths of the recess ion in 2009. Fannie and Freddie are attempting to use your tax dollars to create another subprime mortgage bubble, but it’s too late. The recession is under way and housing is headed back into the toilet. I wonder what Larry Yun will do when he resigns from the NAR in disgrace like David Lereah?

Existing Home Sales Collapse Most Since July 2010, Downtick In Stock Market Blamed

Tyler Durden's picture

Having exuberantly reached its highest level since September 2013 last month (despite the total collapse in mortgage applications), it appears the ugly reality of the housing market has peeked its head out once again. As prices rose, existing home sales plunged 6.1% – the most since July 2010 (against an expected 1.1% drop) to 4.93mm SAAR (the lowest in 6 months).

So what was it this time: the polar vortex, the crude collapse, the crude vortex? Neither: According to the NAR’s endlessly amusing Larry Yun, this time it was the stock market:

 “The stock market swings in October may have impacted some consumers’ psyche and therefore led to fewer November closings. Furthermore, rising home values are causing more investors to retreat from the market.”

Supposedly he is referring to the tumble, not the resulting Bullard “QE4” mega-explosion in stocks that pushed everyhting to new all time highs.

In other words, according to the NAR, even the tiniest downtick in stocks, and the housing market gets it.

Sure enough, it is time to boost confidence in a rigged, manipulated ponzi scheme:

  • DROP IN NOVEMBER COULD BE ONE-MONTH ‘ABERRATION,” YUN SAYS

Unless, of course, stocks drop again, in which case all bets are off.

Meanwhile, it appears investors have left the building…


Every part of America saw a collapse:

November existing-home sales in the Northeast declined 4.2 percent to an annual rate of 680,000, but are still 4.6 percent above a year ago. The median price in the Northeast was $246,100, which is 1.3 percent above a year ago.

In the Midwest, existing-home sales fell 8.9 percent to an annual level of 1.13 million in November, and are now 1.7 percent below November 2013. The median price in the Midwest was $160,500, up 7.0 percent from a year ago.

Existing-home sales in the South decreased 3.2 percent to an annual rate of 2.09 million in November, but remain 5.0 percent above November 2013. The median price in the South was $176,500, up 5.2 percent from a year ago.

Existing-home sales in the West dropped 9.6 percent to an annual rate of 1.03 million in November, and remain 1.0 percent below a year ago. The median price in the West was $292,700, which is 3.5 percent above November 2013.

Some more amusing details from the report:

The median existing-home price2 for all housing types in November was $205,300, which is 5.0 percent above November 2013. This marks the 33rd consecutive month of year-over-year price gains.


Total housing inventory3 at the end of November fell 6.7 percent to 2.09 million existing homes available for sale, which represents a 5.1-month supply at the current sales pace – unchanged from last month. Despite the tightening in supply, unsold inventory remains 2.0 percent higher than a year ago, when there were 2.05 million existing homes available for sale.


“Lagging homebuilding activity continues to hamstring overall housing supply and is still too low in relation to this year’s promising job growth,” says Yun. “Much faster price and rent appreciation – easily exceeding wage growth – will occur next year unless new construction picks up measurably.”


All-cash sales were 25 percent of transactions in November, down from 27 percent in October and 32 percent in November of last year.


Individual investors, who account for many cash sales, purchased 15 percent of homes in November, unchanged from last month and below November 2013 (19 percent). Sixty-one percent of investors paid cash in November.


The percent share of first-time buyers in November climbed to 31 percent, up from October (29 percent) and is the highest share since October 2012 (also 31 percent). First-time buyers have represented an average of 29 percent of buyers through November of this year.


Distressed sales – foreclosures and short sales – were unchanged in November from October (9 percent) and remained in the single digits for the fourth month this year; they were 14 percent a year ago. Six percent of November sales were foreclosures and 3 percent were short sales. Foreclosures sold for an average discount of 17 percent below market value in November (15 percent in October), while short sales were discounted 13 percent (10 percent in October).


Properties typically stayed on the market in November longer (65 days) than last month (63 days) and a year ago (56 days). Short sales were on the market the longest at a median of 116 days in November, while foreclosures sold in 65 days and non-distressed homes took 63 days. Thirty-two percent of homes sold in November were on the market for less than a month.

But don’t worry about all that: the NAR couldn’t be happier that just like in the last housing bubble, so too now Fannie and Freddie’s new 3% down payment initiative, means the bubble is about to get bigger than ever:

NAR President Chris Polychron, executive broker with 1st Choice Realty in Hot Springs, Ark., says Fannie Mae and Freddie Mac’s new low downpayment program should improve access to credit for responsible buyers. “NAR applauds Fannie and Freddie’s commitment to homeownership by serving creditworthy borrowers who lack the resources for substantial downpayments plus closing costs with its new downpayment program,” he said. “The new program mitigates risk with strong underwriting and ensures that responsible buyers have access to safe and affordable mortgage credit. Furthermore, NAR believes lenders must do their part to ensure loans are prudently underwritten and are made available to qualified borrowers.”

And since the taxpayers will be left to bail out the excesses of this latest incipient housing bubble, what’s not to like?

But the punchline: the median price of existing homes dropped to $205,300…

… because, well, there is a “lack of supply.

Nov existing home sales fell 6.1% to 4.93M-the lowest level since last May (4.91M). Lack of supply continues to weigh on the market

yep – that must be it…

RIDICULOUS HOUSING PROPAGANDA FROM NAR & MSM

I’ve told myself to not even look at the highly manipulated statistical drivel put out by the government, corrupt organizations, and regurgitated and spun in a positive manner by the captured corporate media. Just when I thought I was out, they pull me back in.

I see Marketwatch with this blaring headline:


Existing-home sales rise 2.4% in July


They are breathlessly describing how this was better than expected, as if it proves we are in a housing recovery. Existing home sales always rise in July versus June because people need to move before school starts. This is a meaningless data point. The important data point is how it compares with the prior July. That is buried deep in the NAR press release.

Surprise, Surprise. Existing home sales FELL by 4.3% versus July of last year. That means the housing market is in decline.

Of course the scumbags at the NAR touted the 4.9% price increase over last July. They use annual data when it suits them. 

What they did not report is that home prices FELL between June and July from $223,300 to $222,900. They have been falling for months. Housing inventory grew by 3.5% over June and by 5.8% over last July. So you have declining sales and rising inventory on a year over year basis. That sure sounds like a recovery to me.

Investors still account for 29% of all sales, but that percentage is declining. The hedge funds are exiting and the flippers are panicking. Wait until prices fall another 5%. The rush for the exits will be on. First time buyers are still near historic long-term lows and will remain there for years.

Yes the MSM and the NAR are actually cheering for negative year over year sales results that put existing home sales at 1999 levels. Yippee. Let’s buy the all-time fucking high in the stock market.


EXISTING HOME SALES FALL IN JUNE VERSUS LAST JUNE – MSM TOUTS RISE

Look at that amazing housing recovery. The usual housing propaganda being spewed this morning by the NAR and the MSM. Existing homes sales are all the way back to October levels, even though this is prime home sales season. The MSM buries the FACT that existing home sales are 2.3% LOWER than last June. The monthly change is meaningless. Home sales always are higher in the summer because families move while kids are out of school.

Let’s get real. Existing home sales are currently at 1999 levels when the working age population in this country numbered 208 million. Today the working age population numbers 248 million. We’ve got 40 million, or 19% more adults int he country, and existing home sales are exactly the same. They are still 30% below 2005 levels and destined to languish and decline over the coming years. Inventory rose 6.5% over last year. So sales are falling and inventory is rising. I wonder what that will do to prices?


You get nothing but feel good optimistic drivel from the faux journalists in the MSM. Their job is to keep you in the dark. Some facts from the NAR report:

  • First time home buyers still near record lows of 28%. In a healthy non-manipulated housing market this number is 40%.
  • Investors purchased 32% of all the houses sold. This number is closer to 15% in a normal market.
  • Mortgage applications remain at fourteen year lows.
  • Wall Street banks continue to withhold foreclosures and not foreclose on homes that should be foreclosed upon to prop up prices.

The entire housing recovery storyline has been a scam and a fraud. Now sales are falling and prices will follow. Look out below.

Existing-home sales rise 2.6% in June

WASHINGTON (MarketWatch) — Rising for a third month, sales of existing homes grew 2.6% in June to a seasonally adjusted annual rate of 5.04 million, reaching the highest level since October, the National Association of Realtors reported Tuesday. Economists polled by MarketWatch had expected the sales rate to increase to 5 million in June from an originally reported 4.89 million in May, driven by a strengthening labor market, more homes on the market, and cooling price growth. On Tuesday NAR revised May’s sales rate to 4.91 million. Market conditions are becoming more balanced, but anecdotes still point to a shortage of homes on the market, said Lawrence Yun, NAR’s chief economist. The median sales price of used homes hit $223,300 in June, up 4.3% from the year-earlier period. June’s inventory was 2.3 million existing homes for sale, a 5.5-month supply at the current sales pace. The number of homes available for sale was up 6.5% from the year-earlier period. Including June’s increase, the pace of sales was down 2.3% from a year earlier.

WARPED, DISTORTED, MANIPULATED, FLIPPED HOUSING MARKET

The report from RealtyTrac last week proves beyond the shadow of a doubt the supposed housing market recovery is a complete and utter fraud. The corporate mainstream media did their usual spin job on the report by focusing on the fact foreclosure starts in 2013 were the lowest since 2007. Focusing on this meaningless fact (because the Too Big To Trust Wall Street Criminal Banks have delayed foreclosure starts as part of their conspiracy to keep prices rising) is supposed to convince the willfully ignorant masses the housing market is back to normal. It’s always the best time to buy!!!

The talking heads reading their teleprompter propaganda machines failed to mention that distressed sales (short sales & foreclosure sales) rose to a three year high of 16.2% of all U.S. residential sales, up from 14.5% in 2012. The economy has been supposedly advancing for over four years and sales of distressed homes are at 16.2% and rising. The bubble headed bimbos on CNBC don’t find it worthwhile to mention that prior to 2007 the normal percentage of distressed home sales was less than 3%. Yeah, we’re back to normal alright. We are five years into a supposed economic recovery and distressed home sales account for 1 out of 6 all home sales and is still 500% higher than normal.

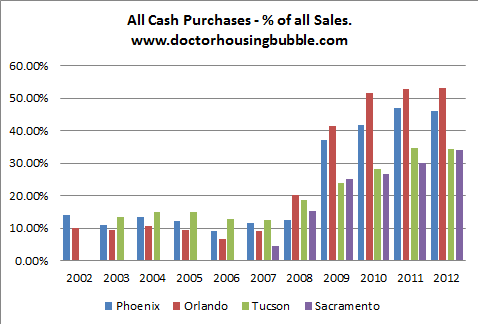
The distressed sales aren’t even close to the biggest distortion of this housing market. The RealtyTrac report reveals that all-cash purchases accounted for 42% of all U.S. residential sales in December, up from 38% in November, and up from 18% in December 2012. Does that sound like a trend of normalization? There were five states where all-cash transactions accounted for more than 50% of sales in December – Florida (62.5%), Wisconsin (59.8%), Alabama (55.7%), South Carolina (51.3%), and Georgia (51.3%). In the pre-crisis days before 2008, all-cash sales NEVER accounted for more than 10% of all home sales. NEVER. This is all being driven by hot Wall Street money, aided and abetted by Bernanke, Yellen and the rest of the Fed fiat heroine dealers.

Source: Realty Trac

The fact that Wall Street is running this housing show is borne out by mortgage applications languishing at 1997 levels, down 65% from the 2005 highs. Real people in the real world need a mortgage to buy a house. If mortgage applications are near 16 year lows, how could home prices be ascending as if there is a frenzy of demand? Besides enriching the financial class, the contrived elevation of home prices and the QE induced mortgage rate increase has driven housing affordability into the ground. First time home buyers account for a record low percentage of 27%. In a normal non-manipulated market, first time home buyers account for 40% of home purchases.     

Price increases that rival the peak insanity of 2005 have been manufactured by Wall Street shysters and the Federal Reserve commissars. Doctor Housing Bubble sums up the absurdity of this housing market quite well.

The all-cash segment of buyers has typically been a tiny portion of the overall sales pool.  The fact that so many sales are occurring off the typical radar suggests that the Fed’s easy money eco-system has created a ravenous hunger with investors to buy up real estate.  Why?  The rentier class is chasing yields in every nook and cranny of the economy.  This helps to explain why we have such a twisted system where home ownership is declining yet prices are soaring.  What do we expect when nearly half of sales are going to investors?  The all-cash locusts flood is still ravaging the housing market.

The Case-Shiller Index has shown price surges over the last two years that exceed the Fed induced bubble years of 2001 through 2006. Does that make sense, when new homes sales are at levels seen during recessions over the last 50 years, and down 70% from the 2005 highs? Even with this Fed/Wall Street induced levitation, existing home sales are at 1999 levels and down 30% from the 2005 highs. So how and why have national home prices skyrocketed by 14% in 2013 after a 9% rise in 2012? Why are the former bubble markets of Las Vegas, Los Angeles, San Diego, San Francisco and Phoenix seeing 17% to 27% one year price increases? How could the bankrupt paradise of Detroit see a 17.3% increase in prices in one year? In a normal free market where individuals buy houses from other individuals, this does not happen. Over the long term, home prices rise at the rate of inflation. According to the government drones at the BLS, inflation has risen by 3.6% over the last two years. Looks like we have a slight disconnect.

http://www.zerohedge.com/sites/default/files/images/user5/imageroot/2014/01-overflow/Case%20Shiller%20NSA.jpg

This entire contrived episode has been designed to lure dupes back into the market, artificially inflate the insolvent balance sheets of the Too Big To Trust banks, enrich the feudal overlords who have easy preferred access to the Federal Reserve easy money, and provide the propaganda peddling legacy media with a recovery storyline to flog to the willingly ignorant public. The masses desperately want a feel good story they can believe. The ruling class has a thorough understanding of Edward Bernays’ propaganda techniques.

“The conscious and intelligent manipulation of the organized habits and opinions of the masses is an important element in democratic society. Those who manipulate this unseen mechanism of society constitute an invisible government which is the true ruling power of our country. …We are governed, our minds are molded, our tastes formed, our ideas suggested, largely by men we have never heard of.”  

Ben Bernanke increased his balance sheet by $3.2 trillion (450%) since 2008, and it had to go somewhere. We know it didn’t trickle down to the 99%. It was placed in the firm clutches of the .1% billionaire club. Bernanke sold his QE schemes as methods to benefit Main Street Americans, when his true purpose was to benefit Wall Street crooks. 30 year mortgage rates were 4.25% before QE2. 30 year mortgage rates were 3.5% before QE3. Today they stand at 4.5%. QE has not benefited average Americans. They are getting 0% on their savings, mortgage rates are higher, and their real household income has fallen and continues to fall.

But you’ll be happy to know banking profits are at all-time highs, Blackrock and the rest of the Wall Street Fed front running crowd have made a killing in the buy and rent ruse, and record bonuses are being doled out to the men who have wrecked our financial system in their gluttonous plundering of the once prosperous nation. Their felonious machinations have added zero value to society, while impoverishing a wide swath of America. Bernanke, Yellen and their owners have used their control of the currency, interest rates, and regulatory agencies to create the widest wealth disparity between the haves and have-nots in world history. Their depraved actions on behalf of the .1% will mean blood.


Just as Greenspan’s easy money policies of the early 2000’s created a housing bubble, inspiring low IQ wannabes to play flip that house, Bernanke’s mal-investment inducing QEternity has lured the get rich quick crowd back into the flipping business. The re-propagation of Flip that House shows on cable is like a rerun of the pre-bubble bursting frenzy in 2005. RealtyTrac’s recent report details the disturbing lemming like trend among greedy institutions and dullard brother-in-laws across the land.

  • 156,862 single family home flips — where a home is purchased and subsequently sold again within six months — in 2013, up 16% from 2012 and up 114% from 2011.
  • Homes flipped in 2013 accounted for 4.6% of all U.S. single family home sales during the year, up from 4.2% in 2012 and up from 2.6% in 2011     

Source: Realty Trac

The easy profits just keep flowing when the Fed provides the easy money. What could possibly go wrong? Home prices never fall. A brilliant Ivy League economist said so in 2005. The easy profits have been reaped by the early players. Wall Street hedge funds don’t really want to be landlords. Flippers need to make a quick buck or their creditors pull the plug. Home prices peaked in mid-2013. They have begun to fall. The 35% increase in mortgage rates has removed the punchbowl from the party. Anyone who claims housing will improve in 2014 is either talking their book, owns a boatload of vacant rental properties, teaches at Princeton, or gets paid to peddle the Wall Street propaganda on CNBC.

Reality will reassert itself in 2014, with lemmings, flippers, and hedgies getting slaughtered as the housing market comes back to earth with a thud. The continued tapering by the Fed will remove the marginal dollars used by Wall Street to fund this housing Ponzi. The Wall Street lemmings all follow the same MBA created financial models. They will all attempt to exit the market simultaneously when their models all say sell. If the economy improves, interest rates will rise and kill the housing market. If the economy tanks, the stock market will plunge, creating fear and killing the housing market. Once it becomes clear that prices have begun to fall, the flippers will panic and start dumping, exacerbating the price declines. This scenario never grows old.

Real household income continues to fall and nearly 25% of all households with a mortgage are still underwater. Young people are saddled with $1 trillion of government peddled student loan debt and will not be buying homes in the foreseeable future. Dodd-Frank rules will result in fewer people qualifying for mortgages. Mortgage insurance is increasing. Obamacare premium increases are sucking the life out of potential middle class home buyers. Retailers have begun firing thousands. The financial class had a good run. They were able to re-inflate the bubble for two years, but the third year won’t be a charm. In a normal housing market 85% of home sales would be between individuals using a mortgage, 10% would be all cash transactions, less than 5% of sales would be distressed, and 40% would be first time buyers. In this warped market only 40% of home sales are between individuals using a mortgage, 42% are all cash transactions, 16% are distressed sales, 5% are flipped, and only 27% are first time buyers. The return to normalcy will be painful for shysters, gamblers, believers, paid off economists, Larry Yun, and CNBC bimbos. 

AVAILABLE

“Facts do not cease to exist because they are ignored.” – Aldous Huxley


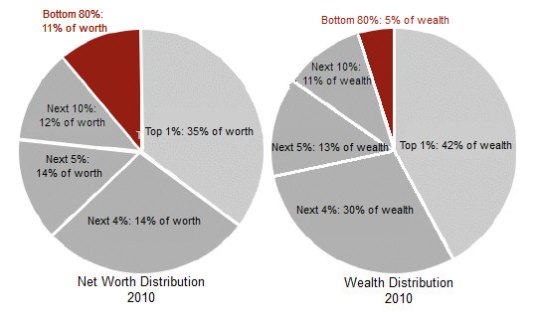
Six months ago I wrote an article called Are You Seeing What I’m Seeing?, describing my observations while traveling along Ridge Pike in Montgomery County, PA and motoring to my local Lowes store on a Saturday. My observations were in conflict with the storyline portrayed by the mainstream media pundits, Ivy League PhD economists, Washington politicians, and Wall Street shills. It is clear now that I must have been wrong. No more proof is needed than the fact the Dow has gone up 1,500 points, or 11%, since I wrote the article. Everyone knows the stock market reflects the true health of the nation – multi-millionaire Jim Cramer and his millionaire CNBC talking head cohorts tell me so. Ignore the fact that the bottom 80% only own 5% of the financial assets in this country and are not benefitted by the stock market in any way.
The mainstream corporate media that is dominated by six mega-corporations (Time Warner, Disney, Murdoch’s News Corporation, Comcast, Viacom, and Bertelsmann), has one purpose as described by the master of propaganda – Edward Bernays:

“The conscious and intelligent manipulation of the organized habits and opinions of the masses is an important element in democratic society. Those who manipulate this unseen mechanism of society constitute an invisible government which is the true ruling power of our country. …We are governed, our minds are molded, our tastes formed, our ideas suggested, largely by men we have never heard of. This is a logical result of the way in which our democratic society is organized. Vast numbers of human beings must cooperate in this manner if they are to live together as a smoothly functioning society. …In almost every act of our daily lives, whether in the sphere of politics or business, in our social conduct or our ethical thinking, we are dominated by the relatively small number of persons…who understand the mental processes and social patterns of the masses. It is they who pull the wires which control the public mind.

These media corporations’ task is to use propaganda and misinformation to protect the interests of the status quo. The ruling class has the power to manipulate public opinion, obscure the truth, alter government data, and outright lie, but they can’t control the facts and reality smacking the average person in the face every day. Based on the performance of the stock market and the storyline of economic recovery being peddled by the corporate media, the facts must surely support their contention. Here are a few facts about what has really happened in the last six months since I wrote my article:

  • The working age population has grown by 1.1 million, the number of employed Americans is up 500k, while the number of people who have left the labor force has gone up by 600k. The BLS reports the unemployment rate has fallen without blinking an eye or turning red with embarrassment.
  • The number of Americans entering the Food Stamp Program in the last six months totaled 1 million, bringing the total to 47.8 million, or 20% of all households (up 15 million since the Obama economic recovery began in December 2009).
  • Existing home sales have increased by a scintillating 2.9% on a seasonally adjusted annual basis and average prices have fallen by 6% in the last six months. It is surely a great sign that 32% of all home sales are to Wall Street investors and 25% are either foreclosure sales or short sales. A large percentage of the remaining sales are funded by 3% down FHA government backed loans.
  • There were 31,000 new homes sales in January versus 34,000 new home sales six months prior. Through the magic of seasonal adjustment, this translates into a 15% increase.
  • Single family housing starts were 41,600 in February versus 51,400 six months prior. Even using seasonal adjustments, the government drones can only report a pathetic 4.7% annualized increase and flat starts over the last three months, with mortgage rates at all-time lows.
  • The National Debt has gone up by $750 billion in the last six months, while Real GDP has gone up by less than $150 billion.
  • Real hourly earnings have not increased in the last six months.
  • Consumer debt has risen by $65 billion as the Federal Government has doled out student loans like candy and auto loans (through the 80% government owned Ally Financial – aka GMAC, aka Ditech, aka ResCap) like crack dealer in West Philly.
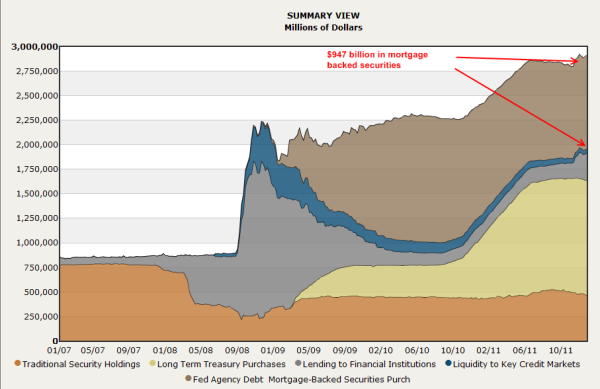
  • The Federal Reserve has increased their balance sheet by $385 billion in the last six months by buying toxic mortgages from Wall Street banks and the majority of Treasuries issued by the government to fund the $1 trillion annual deficits being produced by the Obama administration. It now totals $3.2 trillion, up from $900 billion in September 2008, and headed to $4 trillion before this year is out.
  • Retail sales have increased by less than 2% over the last six months and are barely 1% above last February. On an inflation adjusted basis, retail sales are falling. Other than internet sales and government financed auto sales, every other retail category is negative year over year. This is reflected in the poor sales and earnings reports from JC Penney, Sears, Best Buy, Wal-Mart, Target, Lowes, Kohl’s, Darden, McDonalds, and Yum Brands. I’m sure next quarter will be gangbusters, with the Obama payroll tax increase, Obamacare premium increases, 15% surge in gasoline prices, and continued inflation in food and energy.

Considering that 71% of GDP is dependent upon consumer spending (versus 62% in 1979 before the financialization of America), the dreadful results of retailers and restaurants even before the Obama tax increases confirms the country has been in recession since the second half of 2012. In 1979 the economy was still driven by domestic investment that accounted for 19% of GDP. Today, it wallows at all-time lows of 13%. In addition, our trade deficits, driven by debt fueled consumption, subtract 3.5% from GDP. These facts are reflected in the depressed outlook of small business owners who are the backbone of growth, hiring and entrepreneurship in this country. Small businesses of 500 employees or less employ half of all the private industry workers in the country and account for 65% of all new jobs created. There are approximately 27 million small businesses versus 18,000 large businesses. The chart below does not paint an improving picture. The small business optimism has dropped from an already low 92.8 in September 2012 to 90.8 in March 2013.

Small business optimism report for March 2013

The head of the NFIB couldn’t make the situation any clearer:

While the Fortune 500 is enjoying record high earnings, Main Street earnings remain depressed. Far more firms report sales down quarter over quarter than up. Washington is manufacturing one crisis after another—the debt ceiling, the fiscal cliff and the Sequester. Spreading fear and instability are certainly not a strategy to encourage investment and entrepreneurship. Three-quarters of small-business owners think that business conditions will be the same or worse in six months. Until owners’ forecast for the economy improves substantially, there will be little boost to hiring and spending from the small business half of the economy. NFIB chief economist Bill Dunkelberg

If consumers, who account for 71% of the economy, aren’t spending, and small business owners, who do 65% of all the hiring in the country, are petrified with insecurity, why is the stock market hitting all-time highs and the corporate media proclaiming happy days are here again? It can be explained by the distribution of wealth and income in this country. Every media pundit, politician, Wall Street shill, Ivy League PhD economist, and corporate titan you see on CNBC, Fox or any corporate media outlet is a 1%er or better. The chart below shows the bottom 99% saw their real incomes decline between 2009 and 2011, while the top 1% reaped the stock market gains and corporate bonuses for using “creative” accounting to generate record corporate profits. The trend in 2012 through today has only widened this gap, as real worker wages have continued to decline and the stock market has advanced another 20%.

The feudal financial industry lords are feasting on caviar and champagne in their mountaintop manors while the serfs and peasants scrounge in the gutters for scraps and morsels. This path has been chosen by the king (Obama) and enabled by his court jester (Bernanke). Money printing and inflation are their weapons of choice. We are living in a 21st Century version of the Dark Ages.

On the Road Again

I’ve been baffled by a visible disconnect between deteriorating data and the storyline being sold to the ignorant masses by the financial elitists that run the show. The websites and truthful analysts that I respect and trust (Zero Hedge, Mish, Jesse, Karl Denninger, John Hussman, David Stockman, Financial Sense and a few others) provide analytical evidence on a daily basis that confirm my view that our economic situation is worsening. We are all looking at the same data, but the pliable faux journalists that toil for their corporate masters spin the data in a manner designed to mislead and manipulate in order to mold public opinion, as Edward Bernays taught the invisible ruling class. As you can see, numbers and statistical data can be spun, adjusted, and manipulated to tell whatever story you want to depict. I prefer to confirm or deny my assessment with my observations out in the real world. I spend 12 hours per week cruising the highways and byways of Montgomery County and Philadelphia as I commute to and from work and shuttle my kids to guitar lessons, friends’ houses, and local malls. I can’t help but have my antenna attuned to what I’m seeing with my own eyes.

As I detailed in my previous article, Montgomery County is relatively affluent area with the dangerous urban enclaves of Norristown and Pottstown as the only blighted low income, high crime areas in the 500 square mile county of 800,000 people. The median household income and median home prices are 50% above the national averages. Major industries include healthcare, pharmaceuticals, insurance and information technology. It is one of only 30 counties in the country with a AAA rating from Standard & Poors (as if that means anything). On paper, my county appears to be thriving and healthy, with white collar professionals living an idyllic suburban existence. One small problem – the visual evidence as you travel along Welsh Road towards Montgomeryville or Germantown Pike towards Plymouth Meeting reveals a decaying infrastructure, dying retail meccas, and miles of empty office complexes.

I don’t think my general observations as I drive around Montgomery County are colored by any predisposition towards negativity. I see a gray winter like pallor has settled upon the land. I see termite pocked wooden fences with broken and missing slats. I see sagging porches. I see leaky roofs with missing tiles. I see vacant dilapidated hovels. I see mold tainted deteriorating siding on occupied houses. I see weed infested overgrown yards. I see collapsing barns and crumbling farm silos. I see houses and office buildings that haven’t been painted in 20 years. I see clock towers in strip malls with the wrong time. I see shuttered gas stations. I see retail stores with lights out in their signs. I see trees which fell during Hurricane Sandy five months ago still sitting in yards untouched. I see potholes not being filled. I see disintegrating highway overpasses and bridges. I constantly see emergency repairs on burst water mains. I see malfunctioning stoplights. I see fading traffic signage. I see regional malls with rust stained walls beneath their massive unlit Macys, JC Penney and Sears logos. I see hundreds of Space Available, For Lease, For Rent, Vacancy, For Sale and Store Closing signs dotting the suburban landscape. These sights are in a relatively affluent suburban county. When I reach West Philly, it looks more like Dresden in 1945.

                      Dresden – 1945                                                     Philadelphia – 2013


I moved to my community in 1995 when the economy was plodding along at a 2.5% growth rate. The housing market was still depressed from the early 90s recession. The retail strip centers and larger malls in my area were 100% occupied. Office parks were bustling with activity. Office vacancy rates were the lowest in twenty years during the late 1990s. National GDP has grown by 112% (only 50% after adjusting for inflation) since 1995, with personal consumption rising 122%. Domestic investment has only grown by 80%, but imports skyrocketed by 204%. If the economy has more than doubled in the last 18 years, how could retail strip centers in my affluent community have 40% to 70% vacancy rates and office parks sit vacant for years? The answer is that Real GDP has not even advanced by 50%. Using a true rate of inflation, not the bastardized, manipulated, tortured BLS version, shows the country has essentially been in contraction since the year 2000.

The official government sanctioned data does not match what I see on the ground, but the Shadowstats version of the data explains it perfectly.

My observations also don’t match up with the data reported by the likes of Reis, Trepp, Moody’s and the Federal Reserve. Reis reports a national vacancy rate of 17.1% for offices, barely below its peak of 17.6% in late 2010. Vacancy rates are 35% above 2007 levels and more than double the rates in the late 1990s. But what I realized after digging into the methodology of these reported figures is the true rates are significantly higher. First you must understand that Reis and Trepp are real estate companies who are in business to make money from commercial real estate transactions. It is in their self -interest to report data in the most positive manner possible – they’ve learned the lessons of Bernays. These mouthpieces for their industry slice and dice the numbers according to major markets, minor markets, suburban versus major cities, and most importantly they only measure Class A office space.

I didn’t realize the distinctions between classes when it comes to office space. The Building Owners and Managers Association describes the classes:

Class A office buildings have the “most prestigious buildings competing for premier office users with rents above average for the area.” Class A facilities have “high quality standard finishes, state of the art systems, exceptional accessibility and a definite market presence.” Class B office buildings as those that compete “for a wide range of users with rents in the average range for the area.” Class B buildings have “adequate systems” and finishes that “are fair to good for the area,” but that the buildings do not compete with Class A buildings for the same prices. Class C buildings are aimed towards “tenants requiring functional space at rents below the average for the area.”

So we have landlords self-reporting Class A vacancy rates in big markets to a real estate company that reports them without verification. Is it in a landlord’s best interest to under-report their vacancy rate? You bet it is. If potential tenants knew the true vacancy rates, they would be able to negotiate much lower rents. There is a beautiful Class A 77,000 square foot building near my house that was built in 2004. Nine years later there is still a huge Space Available sign in front of the building and it appears at least 50% vacant.

I pass another Class A property on Welsh Road called the Gwynedd Corporate Center that consists of three 40,000 square foot buildings in a 13 acre office park. It was built in 1998 and is completely dark. The vacancy rate is 100%. As I traveled down Germantown Pike last week I noted dozens of Class A office complexes with Space Available signs in front. I’m absolutely certain that vacancy rates in Class A offices in Montgomery County exceed 25%. When you expand your horizon to Class B and Class C office space, vacancy rates exceed 50%. The only booming business in my suburban paradise is Space Available sign manufacturing. We probably import those from China too. Despite the spin put on the data by the real estate industry, Moody’s reported data supports my estimates:

  • The values of suburban offices in non-major markets are 43% below 2007 levels.
  • Industrial property values in non-major markets are 28% below 2007 levels.
  • Retail property values in non-major markets are 35% below 2007 levels.

The data being reported by Reis regarding vacancies in strip malls and regional malls is also highly questionable, based on my real world observations. The reported vacancy rates of 8.6% for regional malls and 10.7% for strip malls, barely below their 2011 peaks, are laughable. Again, there is no benefit for a landlord to report their true vacancy rate. The truth will depress rents further. This data is gathered by surveying developers and landlords. We all know how reputable and above board real estate professionals are – aka David Lereah, Larry Yun. A large strip mall near my house has a 70% vacancy rate, with another, one mile away, with a 50% vacancy rate. Anyone with two eyes and functioning brain that has visited a mall or driven past a strip mall knows that vacancy rates are at least 15%, the highest in U.S. history. These statistics don’t even capture the small pizza joints, craft shops, antique outlets, candy stores, book stores, gas stations and myriad of other family run small businesses that have been forced to close up shop in the last five years.

The disconnect between reality, the data reported by the mouthpieces of the status quo, and financial markets is as wide as the Grand Canyon. Even the purveyors of false data can’t get their stories straight. Trepp has been reporting steadily declining commercial delinquency rates since July 2012, when they had reached 10.34%, the highest level since the early 1990s. The decline is being driven solely by apartment complexes and hotels. Industrial and retail delinquencies continue to rise and office delinquencies are flat over the last three months. Again, the definition of delinquent is in the eye of the beholder.

The quarterly delinquency rates on commercial loans reported by the Federal Reserve is less than half the rate being reported by Trepp, at 4.13%. Bennie and his band of Ivy League MBA economists have reported 10 consecutive quarters of declining commercial loan delinquency rates. This is in direct contrast to the data reported by Trepp that showed delinquencies rising during 2012.

Real estate loans

All

Booked in domestic    offices

Residential 1

Commercial 2

Farmland

2012:4

7.57

10.07

4.13

2.67

2011:4

8.48

10.34

6.11

3.26

2010:4

9.12

10.23

7.96

3.59

2009:4

9.59

10.54

8.73

3.42

2008:4

6.04

6.67

5.49

2.28

2007:4

2.91

3.08

2.75

1.51

2006:4

1.70

1.95

1.32

1.41

The data being reported doesn’t pass the smell test. Commercial vacancy rates are at or above the levels seen during the last Wall Street created real estate crisis in the early 1990’s. During 1991/1992 commercial loan delinquency rates ranged between 10% and 12%. Today, with the same or higher levels of vacancy, the Federal Reserve reports 4% delinquency rates. When the latest Wall Street created financial collapse struck in 2008 and commercial property values crashed while vacancy rates soared, there were dire predictions of huge loan losses between 2010 and 2012. Commercial real estate loans generally rollover every 5 to 7 years. The massive issuance of dodgy subprime commercial loans between 2005 and 2007 would come due between 2010 and 2012. But miraculously delinquency rates have supposedly plunged from 8.78% in mid-2010 to 4.13% today. The Federal Reserve decided in 2009 to look the other way when assessing whether a real estate loan would ever be repaid. A loan isn’t considered delinquent if the lender decides it isn’t delinquent. The can’t miss strategy of extend, pretend and pray was implemented across the country as mandated by the Federal Reserve. This pushed out the surge in loan maturities to 2014 – 2016.

In an economic system that rewarded good choices and punished those who took ridiculous undue risks and lost, real estate developers, mall owners, and office landlords would be going bankrupt in large numbers and loan losses for Wall Street Too Stupid to Succeed banks would be in the billions. Developers took out loans in the mid-2000’s which were due to be refinanced in 2012. The property is worth 35% less and the rental income with a 20% vacancy rate isn’t enough to cover the interest payments on the loan. The borrower would have no option but to come up with 35% more cash and accept a higher interest rate because the risk of default had risen, or default. Instead, the lenders have pretended the value of the property hasn’t declined and they’ve extended the term of the loan at a lower interest rate. This was done on the instructions of the Federal Reserve, their regulator. The plan is dependent on an improvement in the office and retail markets. It seems the best laid plans of corrupt sycophant central bankers are going to fail.

Eyes Wide Open

There are 1,300 regional malls in this country, with most anchored by a JC Penney, Sears, Barnes & Noble, or Best Buy. The combination of declining real household income, aging population, lackluster employment growth, rising energy, food and healthcare costs, mounting tax burdens, and escalating on-line purchasing will result in the creation of 200 or more ghost malls over the next five years. The closure of thousands of big box stores is baked in the cake. The American people have run out of money. They have no equity left in their houses to tap. The average worker has only $25,000 of retirement savings and they are taking loans against it to make the mortgage payment and put food on the table. They can’t afford to perform normal maintenance on their property and are one emergency away from bankruptcy. In a true cycle of doom, most of the jobs “created” since 2009 are low skill retail jobs with little or no benefits. As storefronts go dark and more “Available” signs are erected in front of these weed infested eyesores, more Americans will lose their jobs and be unable to do their 71% part in our economic Ponzi scheme.

The reason office buildings across the land sit vacant, with mold and mildew silently working its magic behind the walls and under the carpets, is because small businesses are closing up shop and only a crazy person would attempt to start a new business in this warped economic environment of debt dependent diminishing returns. The 27 million small businesses in the country are fighting a losing battle against overbearing government regulations, increasingly heavy tax burdens, operating cost inflation, Obamacare mandates, a low skill poorly educated workforce, and customers with diminishing resources and declining disposable income. Small business owners are not optimistic about the future because they don’t have a sugar daddy like Bernanke to provide them with free money and a promise to bail them out if their high risk investments go bad. With small businesses accounting for 65% of all new hiring in this country and looming healthcare taxes, mandates, regulations and penalties approaching like a freight train, there is absolutely zero probability that office buildings will be filling up with new employees in the next few years. With hundreds of billions in commercial real estate loans coming due over the next three years, over 60% of the loans in the office and retail category, vacancy rates at record levels, and property values still 30% to 40% below the original loan values, a rendezvous with reality awaits. How long can bankers pretend to be paid on loans by developers who pretend they are collecting rent from non-existent tenants who are selling goods to non-existent customers? The implosion in the commercial real estate market will also blow a gaping hole in the Federal Reserve balance sheet, which is leveraged 55 to 1.
federal reserve balance sheet

I regularly drive along Schoolhouse Road in Souderton. It is a winding country road with dozens of small manufacturing, warehousing, IT, aerospace, auto repair, bus transportation, retail and landscaping businesses operating and trying to scratch out a small profit. Most of these businesses have been operating for decades. I would estimate that most have annual revenue of less than $2 million and less than 100 employees. It is visibly evident they have not been thriving, as their facilities are looking increasingly worn down and in disrepair. Their access to credit has been reduced since the 2008 crisis, as only the Wall Street banks and mega-corporations with Washington lobbyists received Bennie Bucks and Obama stimulus pork. These small businesses have been operating on razor thin margins and unable to invest in their existing facilities or expand their businesses. The tax increases just foisted upon small business owners and their employees, along with Obamacare mandates which will drive healthcare costs dramatically higher, and waning demand due to lack of income, will surely push some of these businesses over the edge. There will be some harsh lessons learned on Schoolhouse Road over the next few years. I expect to see more of these signs along Schoolhouse Road and thousands of other roads in the next few years.

The mainstream media pawns, posing as journalists, have not only gotten the facts wrong regarding the current situation, but their myopia extends into the near future. The perpetual optimists that always see a pot of gold at the end of the rainbow are either willfully ignorant or a product of our government run public education system and can’t perform basic mathematical computations. As pointed out previously, consumer spending drives 71% of our economy. As would be expected, the highest level of annual spending occurs between the ages of 35 to 54 years old when people are in their peak earnings years. Young people are already burdened with $1 trillion of government peddled student loan debt and are defaulting at a 20% rate because there are no decent jobs available. Millions of Boomers are saddled with underwater mortgages, prodigious levels of credit card and auto loan debt, with retirement savings of $25,000 or less. Anyone expecting the young or old to ramp up spending over the next decade must be a CNBC pundit, University of Phoenix MBA graduate or Ivy League trained economist.

There will be 10,000 Boomers per day turning 65 years old for the next 18 years. Consumers in the 65-74 age segment spend 28% less on average than during their peak years. It is estimated that between 2010 and 2020 there will be approximately 14.5 million more consumers aged 65 or older. The number of Americans in their peak spending years will crash over the next decade. This surely bodes well for our suburban sprawl, mall based, cheap energy dependent, debt fueled society. Do you think this will lead to a revival in retail and office commercial real estate?

We’ve got $1 trillion annual deficits locked in for the next decade. We’ve got total credit market debt at 350% of GDP. We’ve got true unemployment exceeding 20%. We’ve had declining real wages for thirty years and no change in that trend. We’ve got an aging, savings poor, debt rich, obese, materialistic, iGadget distracted, proudly ignorant, delusional populace that prefer lies to truth and fantasy to reality. We’ve got 20% of households on food stamps. We’ve got food pantries, thrift stores and payday loan companies doing a booming business. We’ve got millions of people occupying underwater McMansions in picturesque suburban paradises that can’t make their mortgage payments or pay their utility bills, awaiting their imminent eviction notice from one of the Wall Street banks that created this societal catastrophe.

We’ve got a government further enslaving the middle class in student loan debt with the false hope of new jobs that aren’t being created. We’ve got a shadowy unaccountable organization, owned and controlled by the biggest banks in the world, that has run a Ponzi scheme called a fractional reserve lending system for 100 years, and inflated away 96% of the purchasing power of the U.S. dollar. We’ve got a self-proclaimed Ivy League academic expert on the Great Depression (created by the Federal Reserve) who has tripled the Federal Reserve balance sheet on his way to quadrupling it by year end, who has promised QE to eternity with the sole purpose of enriching his benefactors while impoverishing senior citizens and the middle class. He will ultimately be credited in history books as the creator of the Greater Depression that destroyed the worldwide financial system and resulted in death, destruction, chaos, starvation, mayhem and ultimately war on a grand scale. But in the meantime, he serves the purposes of the financial ruling class as a useful idiot and will continue to spew gibberish and propaganda to obscure their true agenda.

It is time to open your eyes and arise from your stupor. Observe what is happening around you. Look closely. Does the storyline match what you see in your ever day reality? It is them versus us. Whether you call them the invisible government, ruling class, financial overlords, oligarchs, the powers that be, ruling elite, or owners; there are powerful wealthy men who call the shots in this global criminal enterprise. Their names are Dimon, Corzine, Blankfein, Murdoch, Buffett, Soros, Bernanke, Obama, Romney, Bloomberg, Fink, among others. They are using every means at their disposal to retain their control and power over the worldwide economic system and gorge themselves like hyenas upon the carcasses of a crippled and dying middle class. They have nothing but contempt and scorn for the peasants. They’re your owners and consider you as their slaves. They don’t care about you. They think the commoners are unworthy to be in their presence. Time is growing short for these psychopathic criminals. No amount of propaganda can cover up the physical, economic, social, and psychological descent afflicting our world. There’s a bad moon rising and trouble is on the way. The time for hard choices is coming. The words of Edward Bernays represent the view of the ruling class, while the words of George Carlin represent the view of the working class.

“There’s a reason that education sucks, and it’s the same reason it will never ever be fixed. It’s never going to get any better, don’t look for it. Be happy with what you’ve got. Because the owners of this country don’t want that. I’m talking about the real owners now, the big, wealthy, business interests that control all things and make the big decisions. Forget the politicians, they’re irrelevant.

Politicians are put there to give you that idea that you have freedom of choice. You don’t. You have no choice. You have owners. They own you. They own everything. They own all the important land, they own and control the corporations, and they’ve long since bought and paid for the Senate, the Congress, the State Houses, and the City Halls. They’ve got the judges in their back pockets. And they own all the big media companies so they control just about all the news and information you get to hear. They’ve got you by the balls.

They spend billions of dollars every year lobbying to get what they want. Well, we know what they want; they want more for themselves and less for everybody else. But I’ll tell you what they don’t want—they don’t want a population of citizens capable of critical thinking. They don’t want well informed, well educated people capable of critical thinking. They’re not interested in that. That doesn’t help them. That’s against their interest. You know something, they don’t want people that are smart enough to sit around their kitchen table and figure out how badly they’re getting fucked by a system that threw them overboard 30 fucking years ago.” George Carlin


IT’S ALWAYS THE BEST TIME TO BUY

“The continuing shortages of housing inventory are driving the price gains. There is no evidence of bubbles popping.”David Lereah, NAR mouthpiece/economist – August 2005

“The steady improvement in home sales will support price appreciation despite all the wild projections by academics, Wall Street analysts, and others in the media.” David Lereah, NAR mouthpiece/economist – January 10, 2007

“Buyer traffic is continuing to pick up, while seller traffic is holding steady. In fact, buyer traffic is 40 percent above a year ago, so there is plenty of demand but insufficient inventory to improve sales more strongly. We’ve transitioned into a seller’s market in much of the country. We expect a seasonal rise of inventory this spring, but it may be insufficient to avoid more frequent incidences of multiple bidding and faster-than-normal price growth.” – Lawrence Yun – NAR mouthpiece/economist – February 21, 2013

I really need to stop being so pessimistic. I’m getting richer by the day. My home value is rising at a rate of 1% per month according to the National Association of Realtors. At that rate, my house will be worth $1 million in less than 10 years. My underwater condo (figuratively – not literally) in Wildwood will resurface and make me rich beyond my wildest dreams. Larry Yun, the brilliant economic genius employed by the upstanding and truth telling NAR, reported that median home prices soared by 12.3% in January (down 3.7% from December) over the prior year and there is virtually no inventory left to sell – with a mere 1.75 million homes in inventory – the lowest level since 1999. The median sales price of $173,600 is up “dramatically” from last year’s $154,500 level. I’m sure the NAR meant to mention that home prices are still down 25% from the 2005 high of $230,000. Every mainstream media newspaper, magazine, and news channel is telling me the “strong” housing recovery is propelling the economy and creating millions of new jobs. Keynesian economists, Wall Street bankers, government apparatchiks and housing trade organizations are all in agreement that the wealth effect from rising home prices will be the jumpstart our economy needs to get back to the glory days of 2005. Who am I to argue with such honorable men with degrees from Ivy League schools and a track record of unquestioned accuracy as we can see in the chart below? 


Mr. Lereah added to his sterling reputation with his insightful prescient book Why the Real Estate Boom Will Not Bust—And How You Can Profit from It, which was published in February 2006. I understand Ben Bernanke has a signed copy on his nightstand. According to David, he voluntarily decided to leave the NAR in mid-2007 as home prices began their 40% plunge over the next four years. He then admitted in an interview with Money Magazine in 2009 that he was nothing but a shill for the real estate industry, no different than a whore doing tricks for $20. Except he was whoring himself for millions of dollars and contributing to the biggest financial fraud in world history:

“I was pressured by executives to issue optimistic forecasts — then was left to shoulder the blame when things went sour. I was there for seven years doing everything they wanted me to. I worked for an association promoting housing, and it was my job to represent their interests. If you look at my actual forecasts, the numbers were right in line with most forecasts. The difference was that I put a positive spin on it. It was easy to do during boom times, harder when times weren’t good. I never thought the whole national real estate market would burst.”

After Mr. Lereah slithered away from his post he was replaced by the next snake – Lawrence Yun. He proceeded to put the best face possible on the greatest housing collapse in recorded history, assuring the public it was the best time to buy during the entire slide. Five million foreclosures later he’s still telling us it’s the best time to buy. Why shouldn’t we believe the National Association of Realtors and the mainstream media that report their propaganda as indisputable fact? These noble realtooors only have the best interests of their clients at heart. Remember when they warned people about the dangers of liar loans, negative amortization loans, appraisal fraud, nefarious mortgage brokers, criminal bankers, corrupt ratings agencies and the fact that home prices had reached a high two standard deviations above the normal trend? Oh yeah. They didn’t make a peep. They disputed and ridiculed Robert Shiller and anyone else who dared question the healthy “strong” housing market storyline. In late 2011 this superb, above board, truth telling organization admitted what many financial analysts and “crazy” bloggers had been pointing out for years. They were lying about home sales. Their data was false. Between 2007 and 2010, the NAR reported 2.95 million more home sales than had actually occurred. This was not a rounding error. This was not a flaw in their methodology, as they claimed. It was an outright fraudulent attempt to convince the public that the housing market was not in free fall. These guys make the BLS look accurate and above board.   


We are now expected to believe their monthly reports as if they are gospel. The mainstream media continues to report their drivel about the lowest inventory level in 14 years without the slightest hint of skepticism.

The Incredible Shrinking Inventory

We are told by good old Larry Yun that there are only 1.74 million homes left for sale in this country and at current sales rates we’ll run out of inventory in 4.2 months. Oh the horror. You better buy now, before it’s too late. We must be running out of houses. Someone call Bob Toll. We need more houses built ASAP, before this becomes a crisis. But there seems to be problem with this storyline. Existing home sales are falling. Even using the NAR seasonally manipulated numbers, sales in January were lower than in November. In a country with 133 million housing units, there were 291,000 existing home sales in January. If there is an inventory shortage, why have new home sales fallen every month since May of 2012? There were a total of 10,000 completed new homes sold in December in the entire country. Housing starts plunged by 8.5% in January. Does this happen when you have a strong housing market? Do you believe the NAR inventory figure of 1.74 million homes for sale? The last time the months of supply was this low was early 2005 – during the good old days.


Let’s examine a few facts to determine the true nature of this shocking inventory shortage. According to the U.S. Census Bureau:

  • There are 133 million housing units in the United States
  • There are 115 million occupied housing units in the country, with 75 million owner occupied and 40 million renter occupied.
  • For the math challenged this means that 13.5%, or 18 million housing units, are vacant.
  • Only 4.3 million are considered summer homes, and 3.9 million are available for rent. That leaves 9.8 million homes completely vacant.
  • The Census Bureau specifically identifies 1.6 million of these vacant housing units as up for sale.

So, with 9.8 million vacant housing units in the country and 1.6 million of these identified as for sale, the NAR and media mouthpieces have the balls to report only 1.74 million homes for sale in the entire U.S. This doesn’t even take into account the massive shadow inventory stuck in the foreclosure pipeline. Of the 75 million owner-occupied housing units in the country, 50 million have a mortgage. Of these houses, a full 10.9% are either delinquent or in the foreclosure process. This totals 5.4 million households, with 1.9 million of these households already in the foreclosure process. The number of distressed households is still double the long-term average, even with historically low mortgage rates, multiple government mortgage relief programs (HARP), and Fannie, Freddie and the FHA guaranteeing 90% of all mortgages. Do you think the NAR is including any of these 5.4 million distressed houses in their inventory numbers?


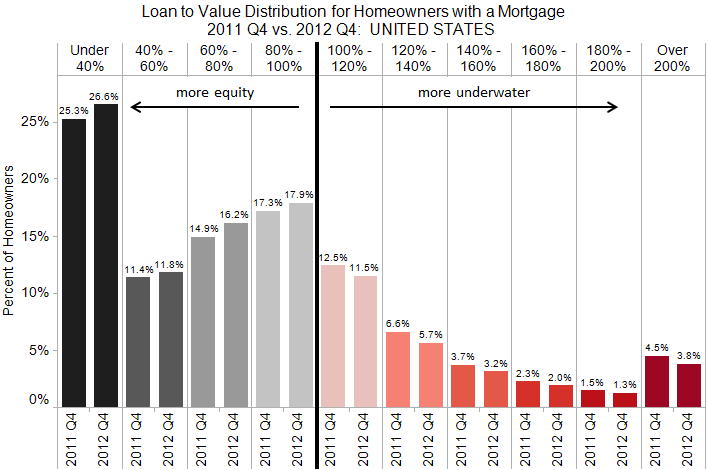
Then we have the little matter of a few home occupiers still underwater on their mortgages. After this fabulous two year housing recovery touted by shills and shysters, only 27.5% of ALL mortgage holders are underwater on their mortgage. This means 13.8 million households are in a negative equity position. Those with 5% or less equity are effectively underwater since closing costs usually exceed 6% of the house’s value. That adds another 2.2 million households to the negative equity bucket. Do you think any of these 16 million households would be selling if they could?  

U.S. homeowners with a mortgage are slowly gaining equity back in their homes. 

The negative equity position of millions of homeowners gets at the gist of the effort to re-inflate the housing bubble. By artificially pumping up home prices, the Wall Street titans and their co-conspirators at the Federal Reserve and Treasury Department are attempting to repair insolvent Wall Street bank balance sheets, lure unsuspecting dupes back into the housing market, reignite the economy through the old stand-by wealth effect, and of course enrich themselves and their crony capitalist friends. The artificial suppression of home inventory has been working wonders, as 2 million homeowners were freed from negative equity in 2012. If they can only lure enough suckers back into the pool, all will be well. Phoenix must have an inordinate number of chumps with home prices rising by 22.5% in 2012 as investors and flippers poured into the market with cheap debt and big dreams. Of course everything is relative, as prices are still down 44% from the peak and 40% of mortgages remain underwater. I strongly urge everyone without a functioning brain to pour their life savings into the Phoenix housing market. Larry Yun says it’s a can’t miss path to riches.  

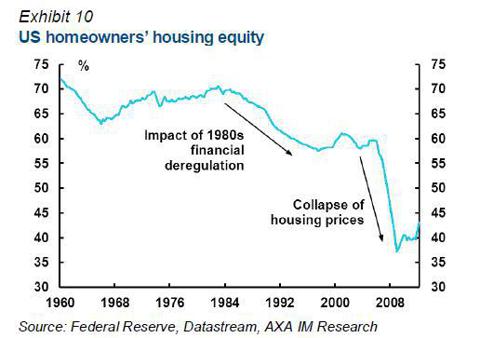
Despite the propaganda, hyperbole, and cheerleading from the corporate media, the fact remains that national homeowner’s equity is barely above its all-time low of 38%, down from 62% in 2000 and 70% in 1980. The NAR shills, Federal Reserve drug pushers, Wall Street shysters, and pliant media lured the middle class into the false belief that housing was an asset class that could make you rich. Homes became the major portion of middle class net worth. As prices were driven higher from 2000 through 2006, the middle class took the bait hook line and sinker and borrowed billions against their ever increasing faux housing wealth. This set up the impending collapse of middle class net worth, created by the 1%ers on Wall Street, in Washington DC, and in corporate executive suites across the land.  The median American household lost 47% of its wealth between 2007 and 2010. Average household wealth, which is skewed dramatically by the richest Americans, declined by only 18%. Real estate only accounts for 30% of the net worth of the rich. For the middle 60%, housing has risen from 62% to 67% of total wealth since 1983. Middle class families’ saw their cash cushion fall from 21% in 1983 to 8% before the crash. They were convinced that living on Wall Street peddled debt was the path to prosperity. After the crash, the middle class has been left with no cash, underwater mortgages, declining real wages, less jobs, and a mountain of credit card debt. Delusions have been crushed. But an on-line degree from the University of Phoenix funded by a Federal student loan of $20,000 will surely revive the fortunes of the average unemployed middle class worker.  


Despite the destruction of middle class hopes, dreams, and net worth, the ruling plutocracy has decided the best way to revive their fortunes is to lure the ignorant masses into more student loan debt, auto debt and mortgage debt.

Don’t Look Behind the Curtain

“The real hopeless victims of mental illness are to be found among those who appear to be most normal. Many of them are normal because they are so well adjusted to our mode of existence, because their human voice has been silenced so early in their lives that they do not even struggle or suffer or develop symptoms as the neurotic does. They are normal not in what may be called the absolute sense of the word; they are normal only in relation to a profoundly abnormal society. Their perfect adjustment to that abnormal society is a measure of their mental sickness. These millions of abnormally normal people, living without fuss in a society to which, if they were fully human beings, they ought not to be adjusted.” Aldous Huxley – Brave New World Revisited


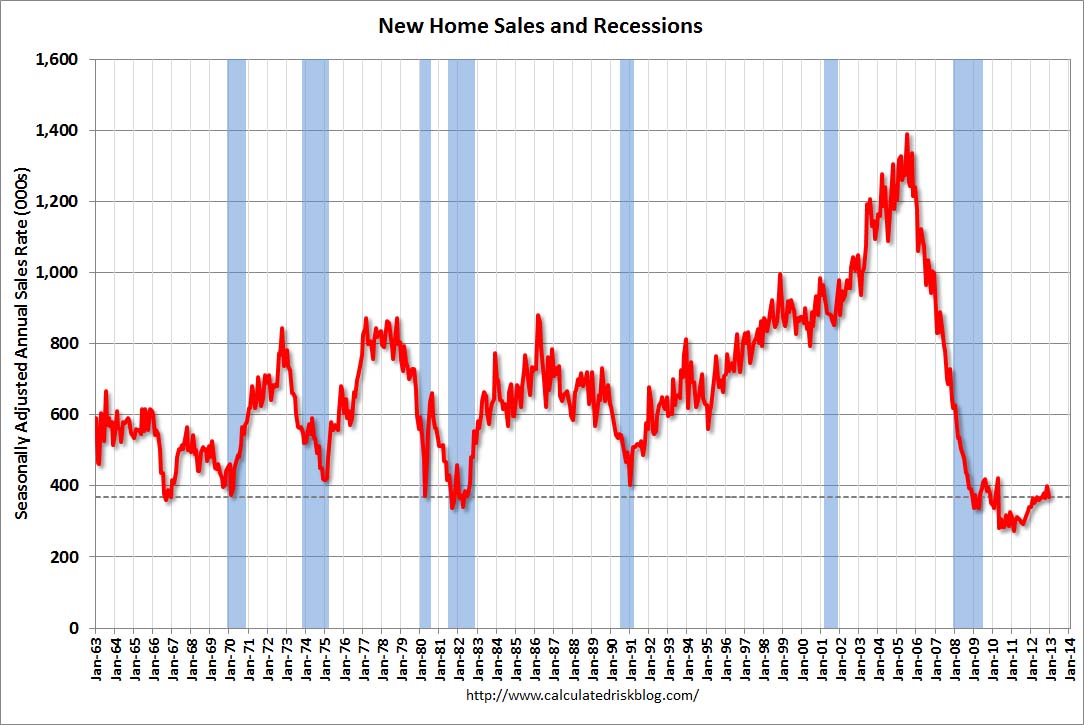
What is normal in a profoundly abnormal, manipulated, propaganda driven society? The NAR and Federal government issue their public relations announcements every month and attempt to spin straw into gold. The media then fulfill their assigned role by touting the results as unequivocal proof of an economic recovery. This is all designed to revive the animal spirits of the clueless public. Statistics in the hands of those who have no regard for the truth can be manipulated to portray any storyline that serves their corrupt purposes. When I see a story about the housing market referencing a percentage increase as proof of a recovery I know it’s time to check the charts. You see, even a fractional increase from an all-time low will generate an impressive percentage increase. So let’s go to the charts in search of this blossoming housing recovery.

The media, NAHB, and certain bloggers look at this chart and declare that new home sales are up 20% from 2011 levels. Sounds awesome. I look at this chart and note that 2011 was the lowest number of new home sales in U.S. history. I look at this chart and note that new home sales are 75% below the peak in 2005. I look at this chart and note that new home sales are lower today than at the bottom of every recession over the last fifty years. I look at this chart and note that new home sales are lower today than they were in 1963, when the population of the United States was a mere 189 million, 40% less than today’s population. Do you see any signs of a strong housing recovery in this chart?    


The housing cheerleaders look at the chart below and crow about a 75% increase in housing starts. I look at this chart and note that housing starts in 2009 were the lowest in recorded U.S. history. I look at this chart and note that total housing starts are down 60% and single family starts are down 70% from 2006 highs. I look at this chart and note the “surge” in housing starts is completely being driven by apartment construction, because the student loan indebted youth can’t afford to buy houses. I look at this chart and note that housing starts are 40% below 1968 levels. Do you see any signs of a strong housing recovery in this chart?   


Those trying to lure the gullible non-thinking masses into paying inflated prices for the “few” houses available for sale declare that existing home sales are up 50% in the last two years. Of course, the 3.3 million low in 2010 was the lowest level in decades. Existing home sales are still 30% below the 2005 high of 7.2 million and the abnormal structure of these home sales is dramatically different than the normal sales of yesteryear.


The wizards behind the curtain don’t want you to understand how the 50% increase in existing home sales has been achieved. They just want you to be convinced that a return to normalcy has happened and it’s the best time to buy. The NAR wizards and the media wizards don’t publicize the composition of these skyrocketing sales. At the end of the NAR “buy a home before it’s too late” monthly press release you find out that distressed homes (foreclosed & short sales) now make up 23% of all home sales and have accounted for well over 30% of all home sales since 2010. Another 28% of home sales are all-cash sales to investors looking to turn them into rental units or flip them for a quick buck. Lastly, 30% of homes are being bought by first time home buyer pansies who have been lured into the market by 3.5% down payment loans through the FHA, with the future losses born by middle class taxpayers who had no say in the matter. Prior to the housing crash, normal buyers who just wanted a place to live, accounted for 90% of all home purchases. Today they make up less than 30% of home buyers. Does this chart portray a normal market or a profoundly abnormal market? Does it portray a healthy housing recovery based upon sound economic fundamentals?      

 all cash buyers

The answer is NO. The contrived elevation of home sales and home prices has been engineered by the very same culprits who crashed our financial system in the first place. This has been planned, coordinated and implemented by a conspiracy of the ruling oligarchy – the Federal Reserve, Wall Street, U.S. Treasury, NAR, and the corporate media conglomerates. Ben’s job was to screw senior citizens and drive interest rates low enough that everyone in the country could refinance, attract investors & flippers into the market, and propel home prices higher. Wall Street has been the linchpin to the whole sordid plan. They were tasked with drastically limiting the foreclosure pipeline, therefore creating a fake shortage of inventory. Next, JP Morgan, Blackrock, Citi, Bank of America, and dozens of other private equity firms have partnered with Fannie Mae and Freddie Mac, using free money provided by Ben Bernanke, to create investment funds to buy up millions of distressed properties and convert them into rental properties, further reducing the inventory of homes for sale and driving prices higher. Only the connected crony capitalists on Wall Street are getting a piece of this action. The Wall Street big hanging dicks have screwed the American middle class coming and going. The NAR and media are tasked with what they do best – spew propaganda, misinform, lie, cheerlead and attempt to create a buying frenzy among the willfully ignorant masses. The chart below reveals the truth about the strong sustainable housing recovery. It doesn’t exist. Mortgage applications by real people who want to live in a home are no higher than they were in 2010 when home sales were 33% lower than today. Mortgage applications are lower than they were in 1997 when 4 million existing homes were sold versus the 5 million pace today. The housing recovery is just another Wall Street scam designed to bilk the American middle class of what remains of their net worth.


The multi-faceted plan to keep this teetering edifice from collapsing is being executed according to the mandates of the financial class:

  • Distribute hundreds of billions in student loans to artificially suppress the unemployment rate, while the BLS adjusts millions more out of the labor force – CHECK
  • Have Ally Financial (80% owned by Obama) and Wall Street banks dole out subprime auto loans to millions and offer 7 year financing at 0%, while GM (Government Motors) channel stuffs its dealers, to create the appearance of an auto recovery – CHECK
  • Drive mortgage rates down, restrict home supply through foreclosure market manipulation, shift the risk of losses to the taxpayer, and allow Wall Street to control the housing market – CHECK
  • Have the corporate mainstream media continuously spout optimistic, positive puff pieces designed to convince an ignorant, apathetic public that the economy is improving, jobs are being created, and housing has recovered – CHECK

Free money, government subsidies, no regulation, Wall Street hubris, get rich quick schemes, media propaganda, and an ignorant public – what could possibly go wrong?   

Here is what could and will go wrong. Everyone in the country that could refinance to a mortgage rate of 4% or lower has done so. Contrary to Bernanke’s rhetoric that “QE to Infinity” would lower mortgage rates, they have just risen to a six month high as the 10 Year Treasury rose 60 basis points from its 2012 low. If mortgage rates just rose to a modest 5% the housing market would come to a grinding halt as no one would trade a 3.5% mortgage for a 5% mortgage. As I’ve detailed earlier, there are 3.9 vacant housing units available for rent. Almost half of the new housing units under construction are apartments. The Wall Street shysters are converting millions of foreclosed homes into rental units. This avalanche of rental properties will depress rents and destroy the modeled ROI calculations of the brilliant Wall Street Ivy league MBAs. These lemmings will all attempt to exit their “investments” at the same time. The FHA is already broke. The mounting losses from their 3.5% down payment to future deadbeats program will force them to curtail this taxpayer financed debacle. There will be few first time home buyers, as young people saddled with a trillion dollars of student loan debt are incapable of buying a home.

These are the facts. But why trust facts when you can believe Baghdad Ben and the NAR? It’s always the best time to buy.

    08-08-12c_baghdad_bob.jpg

“All that said, given the fundamental factors in place that should support the demand for housing, we believe the effect of the troubles in the subprime sector on the broader housing market will likely be limited, and we do not expect significant spillovers from the subprime market to the rest of the economy or to the financial system.  The vast majority of mortgages, including even subprime mortgages, continue to perform well.  Past gains in house prices have left most homeowners with significant amounts of home equity, and growth in jobs and incomes should help keep the financial obligations of most households manageable.” – Ben Bernanke – May 17, 2007


2011 – CATCH-22 YEAR IN REVIEW

“It ain’t what you don’t know that gets you into trouble. It’s what you know for sure that just ain’t so.” – Mark Twain


I published my predictions for 2011 on January 3, 2011 in my article 2011 – The Year of Catch-22. Humans evidently enjoy being embarrassed by how pitiful they are at predicting the future, because we continue to do it year after year. The mainstream media pundits don’t dare look back at their predictions or the predictions of the Wall Street shills that parade on CNBC and get quoted in the Wall Street Journal, eternally predicting 10% to 15% stock market gains. The multi-millionaire Wall Street strategists like the spawn of the squid, Abbey Joseph Cohen, have used all of their Ivy League brain power to predict at least a 10% stock price gain every year since 1999. The S&P 500 stood at 1,272 on January 6, 1999. As of this writing it currently stands at 1,261. ZERO appreciation over the last twelve years.

The Wall Street mantra of stocks for the long run is beginning to get a little stale. If Abbey Joseph Cohen had been right for the last twelve years, the S&P 500 would be 4,000. For this level of accuracy, she is paid millions. Her 2011 prediction of 1,500 only missed by16%. The S&P 500 began the year at 1,258 and hasn’t budged. The lowest prediction from the Wall Street shysters at the outset of the year was 1,333, with the majority between 1,400 and 1,500.

The same Wall Street clowns are now being quoted in the mainstream media predicting a 10% to 15% increase in stock prices in 2012, despite the fact we are headed back into recession, China’s property bubble has burst, and Europe teeters on the brink of dissolution. They lie on behalf of their Too Big To Tell the Truth employers by declaring stocks undervalued, when honest analysts such as Jeremy Grantham, John Hussman and Robert Shiller truthfully report that stocks are overvalued and will provide pitiful returns over the next year and the next decade.

I will take my chances with a few predictions for 2012 after reviewing my lack of foresight regarding 2011. I declared 2011 the year of Catch-22 because no matter what happened, it would not translate into a positive result for the American people. This was my thesis:

The United States and its leaders are stuck in their own Catch 22. They need the economy to improve in order to generate jobs, but the economy can only improve if people have jobs. They need the economy to recover in order to improve our deficit situation, but if the economy really recovers long term interest rates will increase, further depressing the housing market and increasing the interest expense burden for the US, therefore increasing the deficit. A recovering economy would result in more production and consumption, which would result in more oil consumption driving the price above $100 per barrel, therefore depressing the economy. Americans must save for their retirements as 10,000 Baby Boomers turn 65 every day, but if the savings rate goes back to 10%, the economy will collapse due to lack of consumption. Consumer expenditures account for 71% of GDP and need to revert back to 65% for the US to have a balanced sustainable economy, but a reduction in consumer spending will push the US back into recession, reducing tax revenues and increasing deficits. You can see why Catch 22 is the theme for 2011.

My predictions for 2011 were as follows:

  • The first half of 2011 is guaranteed to give the appearance of recovery. The lame-duck Congress ”compromise” will pump hundreds of billions of borrowed dollars into the economy. The continuation of unemployment benefits for 99 weeks (supposedly to help employment) and the 2% payroll tax cut will goose consumer spending. Ben Bernanke and his QE2 stimulus for poor Wall Street bankers is pumping $75 billion per month ($3 to $4 billion per day) directly into the stock market. Since Ben gave Wall Street the all clear signal in late August, the NASDAQ has soared 25%. Despite the fact that there are 362,000 less Americans employed than were employed in August 2010, the mainstream media will continue to tout the jobs recovery. The goal of all these efforts is to boost confidence and spending. Everything being done by those in power has the seeds of its own destruction built in. The Catch 22 will assert itself in the 2nd half of 2011.

The payroll tax cut, extension of unemployment benefits and Bernanke’s gift to Wall Street criminal banks did nothing to help real Americans in the real world. The government manipulated GDP has languished between 0.4% and 1.8% in the first three quarters of 2011. Using a true measure of inflation, as detailed by John Williams at www.shadowstats.com, GDP has remained at a recessionary level of -2% to -3%.


Easy Ben accomplished his goal of pumping up the stock market with his QE2 gift to Wall Street bankers during the first six months of 2011, with the S&P 500 peaking at 1,364 in late April. The market began to fall the second Ben stopped handing Jamie Dimon and his friends $4 billion per day, with the market dropping 18% in three months. The market has risen back near the breakeven level for the year based on Ben’s promise to keep interest rates at zero forever and the hope of QE3.

  • A new perfect storm is brewing for housing in 2011 and will not subside until late 2012. You may have thought those bad mortgages had been all written off. You would be wrong. There will be in excess of $200 billion of adjustable rate mortgages that reset between 2011 and 2012, with in excess of $125 billion being the dreaded Alt-A mortgages. This is a recipe for millions of new foreclosures.

The brainless twits on CNBC will dutifully report the number of completed foreclosure sales plunged by 24% in 2011, giving the impression to their non-critical thinking viewership that all is well on the housing front. What they will fail to point out is that the number of foreclosures in process went up in 2011 and now stands 59% ABOVE the level in 2009 at the height of our recession. The reason that completed foreclosures have fallen is twofold. The criminal Wall Street banks can’t prove they hold the mortgage notes on hundreds of thousands of homes and they have a few legal issues related to the massive robo-signing fraud they committed. Kicking old ladies and Iraq War veterans out into the street using fraudulent documentation has caused the Wall Street Too Evil To Believe Banks some public relations issues. Secondly, the Wall Street Plutocrats have these mortgage loans valued at 100% on their balance sheets due to the FASB gift of mark to fantasy accounting rules. Foreclosing actually reveals their assets to be overvalued by at least 50%. This may explain why millions of Americans are still in their homes after not making a mortgage payment for two years, as detailed by economist Tom Lawler:

Given the number of loans either seriously delinquent or in the process of foreclosure at the beginning of the year, the number of completed foreclosure sales in 2011 is almost absurdly low, reflecting the complete screw-up of the mortgage servicing industry, and the resulting dramatic slowdown in foreclosure resolutions. As of the end of October, 2011 LPS estimated that there were 1.759 million seriously delinquent loans with the average number of days delinquent at 388 (compared to 192 days in January 2008), and there were 2.210 million loans in the foreclosure process that had been on average delinquent for 631 days.

Completed Foreclosure Sales And Short Sales/DILs (thousands, estimates)
  2008 2009 2010 2011(E)
Completed Foreclosure Sales 914 949 1,070 815
Owner-occupied N.A. N.A. 785 608
Non-owner-occupied N.A. N.A. 285 207
Short Sales/DILs 105 270 354 380
Foreclosures plus Short Sales/DILs 1,019 1,219 1,424 1,195
Outstanding first liens: Jan-08 Jan-09 Jan-10 Jan-11
Seriously Delinquent (90+) 1,016 1,983 3,061 2,168
In Process of Foreclosure 860 1,386 2,110 2,203
 
The concerted effort to not complete foreclosures did nothing to slow the continued descent in home prices. As you can see in the chart below from http://www.calculatedriskblog.com/, real home prices will have fallen another 5% in 2011. Obama and his minions threw $50 billion of your tax dollars at the housing market in 2009 – 2010 with tax credits, loan modification programs, homebuilder tax loss carry-backs, and a myriad of other Keynesian claptrap solutions. They succeeded in pissing your tax dollars down the toilet as prices have declined another 12% in the last 18 months. Prices have fallen 42% nationally since 2006. I wonder who missed the boat on that development?
 
“We’ve never had a decline in house prices on a nationwide basis. So, what I think what is more likely is that house prices will slow, maybe stabilize, might slow consumption spending a bit.” – Ben Bernanke – July 2005


There are approximately 48.5 million homes with mortgages in the United States and 10.7 million of them have negative equity. Another 2.4 million have less than 5% equity. Considering it costs more than 5% in closing costs to sell a house that means 27% of home occupiers with a mortgage are trapped like rats in a cage. With 2.2 million foreclosures still in the pipeline and a looming recession, home prices will continue to fall another 10% to 20% over the next two years and one third of all home occupiers will be underwater. That sounds like a recipe for 10% to 15% stock market gains.

  • Quantitative easing has benefited only Wall Street bankers and the 1% wealthiest Americans. The $1.4 trillion of toxic mortgage backed securities on The Fed’s balance sheet are worth less than $700 billion. How will they unload this toxic waste? The Treasuries they have bought drop in value as interest rates rise. Quantitative easing’s Catch 22 is that it can never be unwound without destroying the Fed and the US economy.

Bennie and his Inkjets did a bang up job in 2011. He was able to expand his balance sheet from $2.47 trillion to $2.95 trillion in twelve short months. According to Ben and his Federal Reserve friends, increasing your balance sheet by $480 billion isn’t really printing money out of thin air and handing it to their Wall Street owners for free, so they can prop up the stock market and enrich their executives. Ben is now leveraged 57 to 1. He should move to Europe, where this level of leverage is commonplace. In comparison, Lehman Brothers and Bear Stearns were leveraged 40 to 1 when they went belly up.

There is absolutely no way that Ben Bernanke could ever reduce the Federal Reserve balance sheet to the pre-crisis level without destroying the U.S. economy. He knows that and will never sell off those toxic mortgage assets. Not only won’t he reduce the Fed balance sheet, but by mid-2012 he will institute QE3 and buy another $600 billion of mortgage debt. His hubris knows no bounds, as his reckless illegal actions thus far have not driven interest rates sky high – YET. He has only destroyed the finances of senior citizens, savers and people who eat food and use gasoline. He will surely go down in history, but not the way he envisions.

  • The rise in oil to $91 a barrel will not be a top. The Catch-22 of a declining dollar is that prices of all imported goods go up. If the dollar falls another 10%, the price of oil will rise above $120 a barrel and push the economy back into recession.

As Bernanke printed like a drunken sailor during the first six months of 2011, the USD fell by 9% and the price of oil did exactly as expected, rising to a peak above $125. The NATO “intervention” in Libya also added a few bucks to the price of a barrel of sweet crude.

                  DXY

One-Year Chart for DOLLAR INDEX SPOT (DXY:IND)

The complete implosion of Europe and the ensuing weakness of the Euro have given the false impression that the U.S. dollar is a safe haven. The USD has regained its losses and will end the year exactly as it started versus a Euro heavy basket of world currencies. With annual deficits equaling 10% of GDP, a national debt now exceeding 100% of GDP, and Ben Bernanke in perpetual printing mode, the USD is destined to reach its intrinsic value of zero. With Brent crude still above $108 a barrel, employment still weak, and double digit food and energy inflation slowing consumer spending, the ECRI knows a recession during 2012 is baked in the cake.  


  • The imminent collapse of the European Union as Greece, Ireland, Portugal and Spain are effectively bankrupt. Spain is the size of the other three countries combined and has a 20% unemployment rate. The Germans are losing patience with these spendthrift countries. Debt does matter.

It seems I was wrong about Europe. It turned out to be much worse than anyone envisioned, with Italy now the likely fuse that blows the whole thing sky high. The ECB has made Ben Bernanke look like a lightweight by increasing their balance sheet by 44% to over $3.5 trillion in a futile effort to solve a debt crisis with more debt. It seems central bankers are programmed to print until the very end (see Weimar). The European Union will not survive 2012. Too many countries, too much government debt, too many zombie banks, too many bureaucrats, too much austerity rammed down the throats of citizens, and not enough honesty or reality based solutions.

  • State and local governments were able to put off hard choices for another year, as Washington DC handed out hundreds of billions in pork. California will have a $19 billion budget deficit; Illinois will have a $17 billion budget deficit; New Jersey will have a $10.5 billion budget deficit; New York will have a $9 billion budget deficit. A US Congress filled with Tea Party newcomers will refuse to bailout these spendthrift states. Substantial government employee layoffs are a lock.

State and local governments have laid off 535,000 workers since 2008. With borrowed Federal government stimulus handouts evaporating into thin air during 2011 – 2012, this total will reach 800,000 by the end of the next year. The U.S. Postal Service will do their part by cutting 28,000 jobs in 2012, even though they need to cut 100,000. States and municipalities based their budgets on the revenues produced by the fake debt driven housing boom from 2003 – 2007. The tax revenue dried up, but the union jobs added are a gift that keeps on costing taxpayers billions. States and localities can’t print, so layoffs will continue.   


  • There is a growing probability that China will experience a hard landing as their own quantitative easing has resulted in inflation surging to a 28 month high of 5.1%, with food inflation skyrocketing to 11.7%. Poor families spend up to half of their income on food. Rapidly rising prices severely burden poor people and can spark civil unrest if too many of them can’t afford food.

According to official government statistics China’s economy continued to boom in 2011. But, of course Chinese government reports make the BLS look honest. The fact is the Chinese stock market has fallen 28% since April as the property bubble deflates. If their economy has truly grown at an annual rate of 8% to 10% over the last five years, why is their stock market down 62% from its 2007 high?

   SHANGHAI INDEX

One-Year Chart for Shanghai Stock Exchange Composite Index (SHCOMP:IND)

The price inflation in food and energy prices, along with the property bubble bursting has led to breakouts of civil unrest across China. China’s two biggest markets – Europe & the United States – are in or near recession and are buying less of their crap. They can only build so many vacant cities and shopping malls to create the appearance of growth. The hard landing is about to get harder in 2012.

  • The Tea Party members of Congress are likely to cause as much trouble for Republicans as Democrats. If they decide to make a stand on raising the debt ceiling early in 2011, all hell could break loose in the debt and stock markets. 

It seems I got the timing wrong on this prediction, but the August showdown was a doozy. The threat of a government shutdown resulted in the stock market collapsing by 18% in a matter of weeks in August. Our beloved politicians then came up with another bullshit non-solution by creating a commission which, after months of negotiations, failed to do anything. The $1.2 trillion of automatic spending cuts will never happen. The slime that inhabit the hallowed halls of Congress will pretend to cut, while actually increasing spending. And so it goes. The stock market has risen from its October low based on Easy Ben’s assurances to keep interest rates at zero forever and the anticipation of QE3 in the new year.

  • Will the consensus forecast of a growing economy, rising corporate profits, 10% to 15% stock market gains, 2 million new jobs, and a housing recovery come true in 2011? No it will not. By mid-year confidence in Ben’s master plan will wane.

Corporate profits did rise, mostly due to Ben Bernanke providing free money to the Wall Street Mega-Banks so they could generate risk free profits on the backs of senior citizens getting .15% on their savings. It also helps when the same Wall Street banks can make accounting entries declaring that future loan losses will be minimal and the toxic mortgages on their books aren’t really worthless. Who knew accountants could do so much for America? Abbey Joseph Cohen only missed her stock market projection by a smidgeon. The S&P 500 is essentially unchanged for the year, while the NASDAQ and Russell 2000 will finish in the red.

The country did not add 2 million new jobs. It added 1.4 to 1.5 new jobs. Too bad the working age population went up by 1.7 million people. But our friends at the BLS, when they aren’t manipulating away the inflation that real people in the real world experience every day, have the gall to declare the unemployment rate has fallen from 9.8% to 8.6% in the last twelve months. How could this be you might ask, since the working age population went up by more than the number of people who found jobs. Easy if you are a BLS government drone. Everyone knows that things are so good out in the real world that 1.8 million Americans decided to kick back and enjoy the good life by leaving the workforce. It wasn’t because they gave up looking for the jobs that were shipped to the Far East by the mega-corporations making record profits and paying record bonuses to their executives. It’s just a rumor that those long lines at food banks around the country have a few of these “lucky” non-members of the workforce in them.

The housing recovery is just around the corner. Larry Yun, chief liar for the National Association of Realtors, assures us that it’s the best time to buy. We all know that the NAR is a bastion of honesty and truth. Just because they reported 3 MILLION more home sales than actually occurred between 2007 and 2010, you can’t scorn, ignore and treat everything they say as a bald faced lie. If Larry says the housing recovery has arrived, it must be true.

  Revised Previous % Change
2007 5,022,000 5,652,000 -11.1%
2008 4,124,000 4,913,000 -16.1%
2009 4,334,000 5,156,000 -15.9%
2010 4,182,000 4,907,000 -14.8%

When the pundits on CNBC sum up the year, they will not be touting the fact that gasoline prices went up 10% in the past year and the average price for a gallon of gas was the highest in U.S. history. They will not be proclaiming that even the government manipulated CPI shows food prices up 6% and clothing prices up 5% in the last year. I’m sure glad Ben Bernanke doesn’t see any inflation on his radar. Maybe he should ask his chauffer about his inflation. Lastly, the stocks for the long run crowd will not be yakking about the fact that gold finished up 10% for the year and has been up for TEN consecutive years. I wonder whether the numbskulls on CNBC can look at the chart below and figure out why gold is up ten years in a row. The national debt reaching $20 trillion by 2015 is a given. I wonder whether the price of gold will be higher. Maybe I’ll give Abbey Joseph Cohen a call and ask for her prediction.

Overall, my assessment of what would happen in 2011 wasn’t too far off. But, it was the things that I and virtually everyone on the planet missed that will reverberate in 2012 and for the next ten years. Our 20 year Crisis deepened, became more violent, and clearly revealed that the establishment will use all their power to put down protests and crush opposition to their corrupt crony capitalistic policies. The major developments I missed regarding 2011 included:

  • The self-immolation of a young Tunisian man set off revolutions around the globe, toppling U.S. supported dictators in Tunisia and Egypt. Dictators attempted to retain power by killing citizens by the thousands. The self-immolation of a man in New Hampshire in front of a courthouse was completely ignored by the mainstream media. I wonder why.
  • The Arab Spring has resulted in revolutions in Yemen, Bahrain, Syria and Libya. Depending upon how much oil was at stake, the U.S. has supported the dictator or the people whenever it suited them. This is called democratic principles.
  • Young people across the U.S. were inspired by the Arab Spring and began to Occupy Wall Street and many other streets in 97 other U.S. cities this past Fall. The spirit of these protests was against Wall Street criminality, Washington corruption, and corporate malfeasance. Peaceful civil disobedience by citizens of this country was met with beatings, tear gas, mass arrests and bulldozing their encampments. Students were maced while sitting in front of a college building. Ultimately a Department of Homeland Security coordinated attack on all the protests squashed the movement. The American people were too distracted by Dancing With the Stars and the latest iGadget to notice. The corporate media did their part by spewing misinformation and propaganda about the Occupy Movement, while the Wall Street Elite giggled with delight from their NYC penthouse suites.
  • Shockingly, no bankers were prosecuted despite clear unequivocal evidence of the greatest financial fraud in world history. The former head of Goldman Sachs, U.S. Senator, and NJ Governor continues to eat caviar and drink champagne in his glorious mansion after stealing $1.2 billion directly from customers’ accounts. These funds now reside in the pocket of Jamie Dimon and his upstanding JP Morgan institution.
  • The Federal government methodically moved closer to a totalitarian regime by passing legislation that will enable them to imprison U.S. citizens without charges. The only remaining area that has allowed critical thinking Americans to find the truth – the Internet – is on the verge of being locked down by the Feds. Pending legislation will allow them to shut down any website that may inconvenience their agenda. We inch ever closer to Orwell’s vision of the future.
  • No one in the MSM or government anticipated that the only truthful, honest, forthright politician in Washington D.C. – Ron Paul – could possibly win the Iowa caucus. His message of freedom, liberty, self reliance, and non-interventionism has struck a chord with young people and those capable of distinguishing between MSM propaganda and reality. The establishment is terrified of Ron Paul and is now on a mission to destroy him. What they don’t realize is their time is coming to an end. The existing social order will be swept away in a violent manner. The youth of this country will lead the charge. 2012 should be a real doozy.

I’ll take another shot at predicting the unpredictable with my next article:  2012 – The Year of Living Dangerously.

JOHN PAULSON WILL BE WRONG THIS TIME (Featured Article)

We have arrived at critical juncture in the ongoing financial crisis. Have the government actions of the last year successfully spurred the animal spirits of Americans, resulting in a self-sustaining recovery?

The Obama administration and most of the mainstream media would answer yes. GDP has been positive for the last four quarters. Consumer spending has increased in five consecutive months. Corporate profits have been relatively strong. The country has stopped losing jobs. The missing piece has been a housing recovery.

No need to worry. Famous or infamous (depending on your point of view) $15 billion man John Paulson has assured the world that house prices will rise 8% to 10% in 2011. His basis for this forecast is that California prices have rebounded 8% to 10% in the last year, and this recovery will spread to the rest of the nation.

Maybe Paulson has teamed up with his buddies at Goldman Sachs to develop a product that guarantees a housing recovery. I tend to not believe anything that comes out of the mouth of anyone associated with Wall Street, but let’s assess the facts and see if they point to an impressive housing recovery in 2011.

The man who has been right on housing for the last ten years has been Yale Professor Robert Shiller. His analysis of U.S. housing prices from 1890 until present, which he first published in 2005, unequivocally proved that we were in the midst of the greatest housing bubble in history. At the same time, David Lereah, the chief economist (shill) for the National Association of Realtors, was pronouncing it was the best time to buy. He published his masterpiece of market tops, Are You Missing the Real Estate Boom? at the 2005 housing peak. He called a bottom in January 2007, and the NAR has continued to tell Americans it is the best time to buy for the last five years as prices have dropped 36% nationally.

Dr. Shiller continues to be the voice of reason when it comes to the housing market. He is doubtful that the recent “recovery” will continue:

    “Recent polls show that economic forecasters are largely bullish about the housing market for the next year or two. But one wonders about the basis for such a positive forecast. Momentum may be on the forecasts’ side. But until there is evidence that the fundamental thinking about housing has shifted in an optimistic direction, we cannot trust that momentum to continue.”

Whom do you believe? The paid mouthpiece for the National Association of Realtors, the Wall Street shill, or an impartial economics professor who has done rigorous analysis using 120 years of housing data?

Continue reading “JOHN PAULSON WILL BE WRONG THIS TIME (Featured Article)”