

The number of oil rigs operating in North Dakota was already declining before the epic plunge in oil prices. That was when Bakken crude was fetching $60 to $70 per barrel. It sells at a steep discount to WTI. Guess what it is selling for today? How about $41.75. How many heavily indebted oil drillers can make money at $41.75? A helluva lot less than two months ago.
What I love about the internet is you can find serious research done by people who understand an industry, but are not being paid to sell a story. The report below is filled with data, facts and truth. You will get none of that from the shills and morons paraded on CNBC or quoted in the Wall Street Journal. They are selling bullshit and propaganda.
I am no expert on shale oil extraction, but I understand supply, demand, extreme debt levels, and mal-investment. The great shale oil boom is over. It was created by Wall Street and the Federal Reserve. All booms go bust. This bust might be the trigger for a bigger bust. Get ready for another taxpayer bailout.
A commenter on Zero Hedge named Cooter describes exactly what I believe will happen. Enjoy this momentary relief in energy prices because this bust will insure much higher prices later.
Just to put the current US oil boom into further perspective, over the past five years global oil production has increased by 3.85 million bpd. During that same time span, US production increased by 3.22 million bpd — 83.6 percent of the total global increase. Had the US shale oil boom never happened and US production continued to decline as it had for nearly 40 years prior to 2008, the global price of oil might easily be at $150 to $200 a barrel by now. Without those additional barrels on the market from (primarily) North Dakota and Texas, the price of crude would have risen until supply and demand were in balance.
While the speculation about prices is just that, the role of the frack industry in proping up global production is not. That oil is coming off the market going forward. So, we are setting up for a double whammy … prices go down and take out all the marginal production … and then if there is even a whiff of recovery, prices are going way back up as supply won’t be able to track demand globally.
Bakken and North Dakota Production Report
The North Dakota Industrial Commission just published their Bakken Monthly Oil Production Statistics and also their ND Monthly Oil Production Statistics.
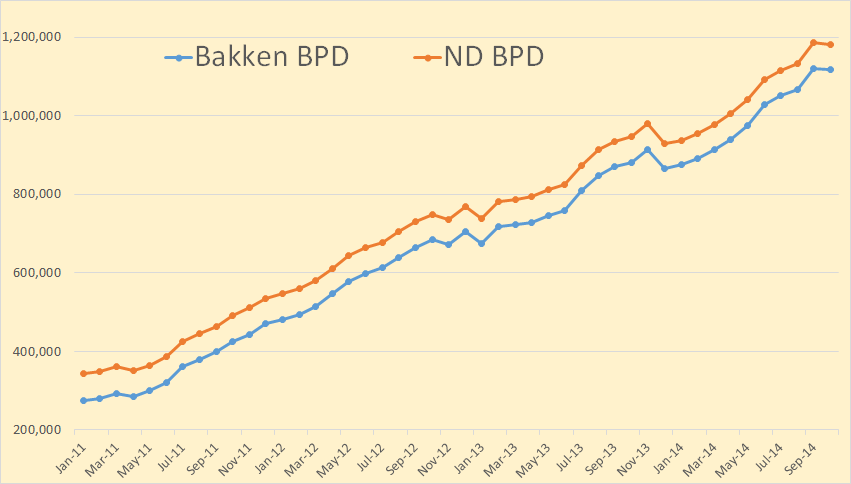
Bakken production was down 1,598 barrels per day to 1,118,010 bpd. All North Dakota production was down 4,054 bpd to 1,182,174 bpd.
From the Director’s Cut, bold mine:
The drilling rig count dropped 2 from September to October, an additional 3 from October to November, and has since fallen 5 more from November to today. The number of well completions decreased from 193(final) in September to 134(preliminary) in October. Three significant forces are driving the slow-down: oil price, flaring reduction, and oil conditioning. Several operators have reported postponing completion work to achieve the NDIC gas capture goals. There were no major precipitation events, but there were 9 days with wind speeds in excess of 35 mph (too high for completion work).
The drillers outpaced completion crews in October. At the end of October there were about 650 wells waiting on completion services, an increase of 40.
Crude oil take away capacity is expected to remain adequate as long as rail deliveries to coastal refineries keep growing.
Rig count in the Williston Basin is set to fall rapidly during the first quarter of 2015. Utilization rate for rigs capable of 20,000+ feet is currently about 90%, and for shallow well rigs (7,000 feet or less) about 60%.
Sep rig count 193
Oct rig count 191
Nov rig count 188
Today’s rig count is 183
Sep Sweet Crude Price = $74.85/barrel
Oct Sweet Crude Price = $68.94/barrel
Nov Sweet Crude Price = $60.61/barrel
Today Sweet Crude Price = $41.75/barrel (lowest since March 2009)
I just checked Rig Count. It now stands at 181 but one of them is drilling a salt water disposal well. So they have 180 rigs drilling for oil right now.
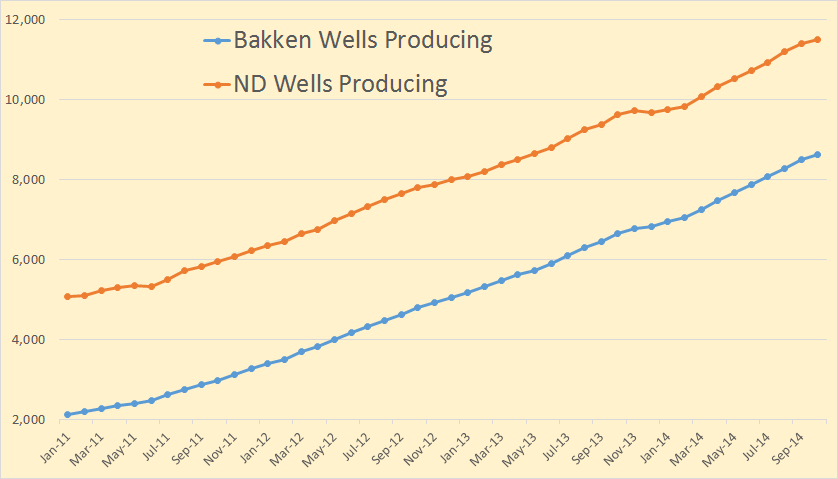
Bakken wells producing increased by 118 to 8,602 while North Dakota wells producing increased by 92 to 11,507. Since Bakken wells are included in the North Dakota count this means at least 26 wells outside the Bakken had to be shut down.
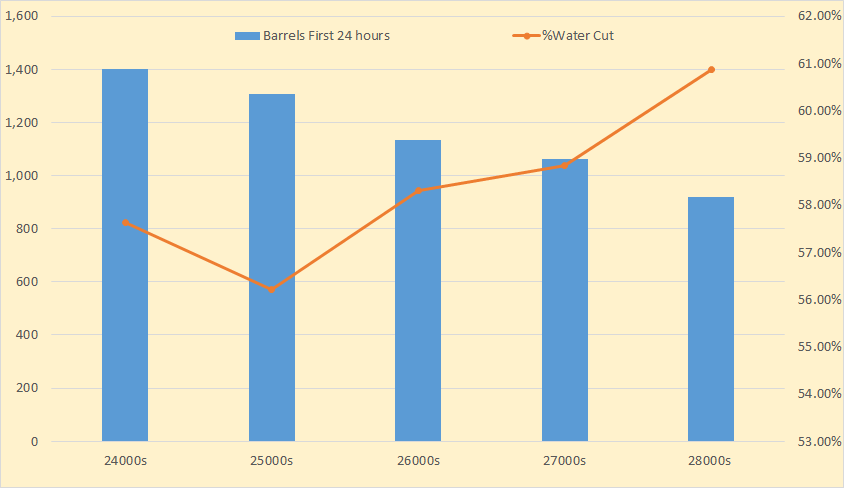
I am still tracking first 24 hours production by well numbers. I am now more convinced than ever that the first 24 hours production is a significant indicator of future production of that well. So far there are only 73 wells in the 28000s however.
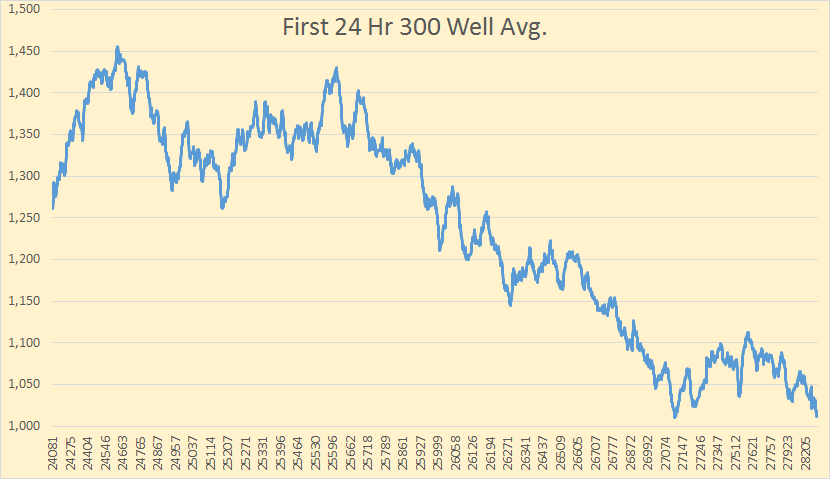
Using a 300 well average and sorting by well number you can see how the BOPD falls off as the well number gets higher. The 27000s seems to have leveled out but I believe it will keep falling as more higher well numbers come on line.
I have 2 weeks worth of data for December. There are 121 wells brought on line so far in December. But concerning the first 24 hours of water cut.
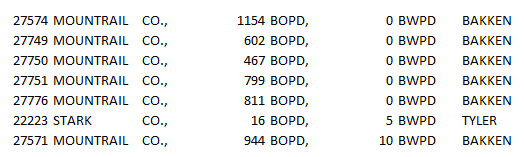
Everyone is telling me the first 24 hours is all fracking water so it means nothing. Welllll… I think the drillers have some way of accounting for that. I sorted the 121 wells I have so far for December by barrels of water per day. Above you see the seven wells with the lowest water cut. If the water that comes up the first 24 hours is all fracking water then there is a problem here. I am willing to hear opinions of what that problem is because I haven’t a clue.
Incidentally at the other end of the sort, the seven wells with the highest water in the first 24 hours, averaged 5,396 barrels of water per well and 1,898 barrels of oil per well.
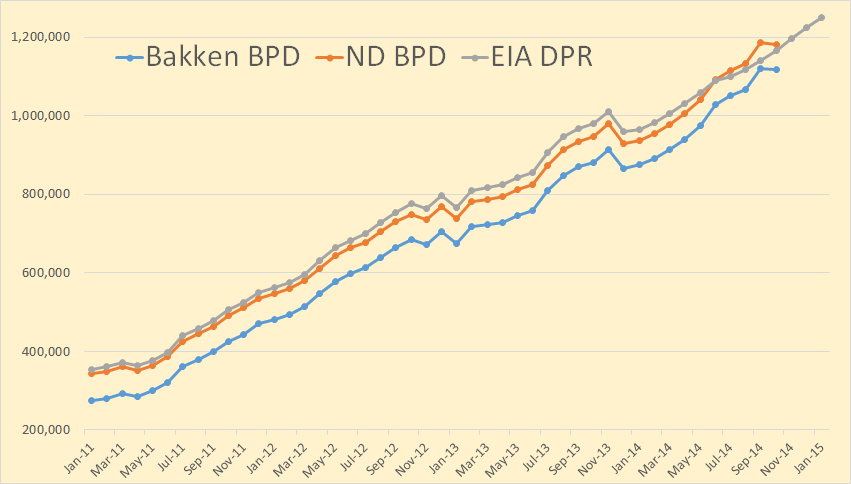
I have included the the Bakken data from the EIA’s Drilling Productivity Report here. Their data is for all the Bakken, including the Montana part, but not the non Bakken part of North Dakota. Their data goes through January 2015. The last six months of the DPR data is nothing but a wild guess.
I wanted to show the DPR data because people and the media keep pointing to it as if it were gospel as to what will be produced from all shale fields within the next two months. For instance this article: EIA: Despite lower crude oil prices, U.S. crude oil production expected to grow in 2015.
The recent decline in crude oil prices has created the potential for weaker crude oil production. EIA’s Drilling Productivity Report (DPR) includes indicators that provide details on the effect low prices may have on tight oil production, which accounts for 56% of total U.S. oil production. Analyzing these indicators and the changes in oil production following the drop in crude oil prices during the 2008-09 recession may offer some insight into possible near-term oil production trends.
They are expecting great things, at least through January 2015. From their report:

They are expecting light tight oil to be up 116,000 barrels per day in January. They think the Bakken will be up 27,000 bpd in January and Texas’ Eagle Ford and the Permian to be up a whopping 76,000 barrels per day.
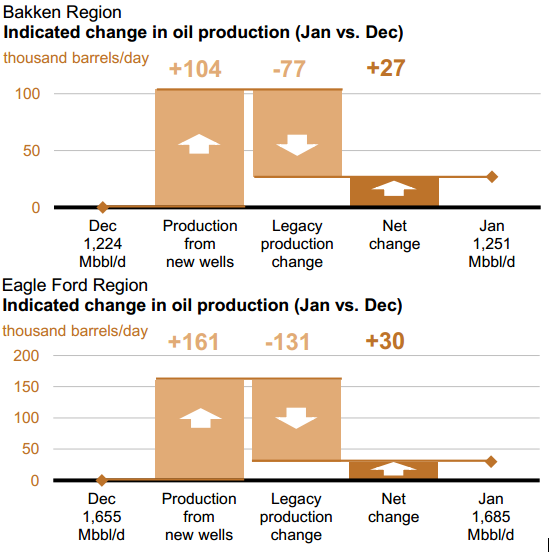
I did the math. If these decline rates are right, then in January, these two fields will decline by 208,000 barrels per day. That is they will have to produce 208,000 barrels of new oil in January just to break even. Or if production declines by just 21.5% they will just break even. I expect new well production from these two fields, for most months next year, to be well below 208,000 barrels per day
The IEA has lowered their expectations for 2015 but only slightly.
Oil Market Report
Global production fell by 340 kb/d in November to 94.1 mb/d on lower OPEC supplies. Annual gains of 2.1 mb/d were split evenly between OPEC and non-OPEC. Surging US light tight oil supply looks set to push total non-OPEC production to record growth of 1.9 mb/d this year, but the pace is expected to slow to 1.3 mb/d in 2015.
Note: I send an email notice when I publish a new post. If you would like to receive that notice then email me at DarwinianOne at Gmail.com.


“This $550 Billion Mania Ends Badly,” Energy Companies Are “Shut Out Of The Credit Market”
Submitted by Tyler Durden on 12/12/2014 21:00 -0500
“Anything that becomes a mania — it ends badly,” warns one bond manager, reflecting on the $550 billion of new bonds and loans issued by energy producers since 2010, “and this is a mania.” As Bloomberg quite eloquently notes, the danger of stimulus-induced bubbles is starting to play out in the market for energy-company debt – as HY energy spreads near 1000bps – all thanks to the mal-investment boom sparked by artificially low rates manufactured by The Fed. “It’s been super cheap,” notes one credit analyst. That is over!! As oil & gas companies are “virtually shut out of the market” and will have to “rely on a combination of asset sales” and their credit lines. Welcome to the boom-induced bust…
As Bloomberg reports, with oil prices plunging, investors are questioning the ability of some issuers to meet their debt obligations. Research firm CreditSights Inc. predicts the default rate for energy junk bonds will double to eight percent next year.
“Anything that becomes a mania — it ends badly,” said Tim Gramatovich, who helps manage more than $800 million as chief investment officer of Santa Barbara, California-based Peritus Asset Management. “And this is a mania.”
The Fed’s decision to keep benchmark interest rates at record lows for six years has encouraged investors to funnel cash into speculative-grade securities to generate returns, raising concern that risks were being overlooked. A report from Moody’s Investors Service this week found that investor protections in corporate debt are at an all-time low, while average yields on junk bonds were recently lower than what investment-grade companies were paying before the credit crisis.
Borrowing costs for energy companies have skyrocketed in the past six months…
Energy companies are no longer able to access credit…
“It’s been super cheap” for energy companies to obtain financing over the past five years, said Brian Gibbons, a senior analyst for oil and gas at CreditSights in New York. Now, companies with ratings of B or below are “virtually shut out of the market” and will have to “rely on a combination of asset sales” and their credit lines, he said.
The Fed’s three rounds of bond buying were a gift to small companies in the capital-intensive energy industry that needed cheap borrowing costs to thrive, according to Chris Lafakis, a senior economist at Moody’s Analytics in West Chester, Pennsylvania.
Quantitative easing “has been one of the keys to the fast, breakneck pace of the growth in U.S. oil production which requires abundant capital,” Lafakis said.
One of those to take advantage was Energy XXI, an oil and gas explorer, which has raised more than $2 billion in the bond market in the past four years.
The Houston-based company’s $750 million of 9.25 percent notes, issued in December 2010, have tumbled to 64 cents on the dollar from 106.3 cents in September, according to Trace, the bond-price reporting system of the Financial Industry Regulatory Authority. They yield 27.7 percent.
Energy XXI got its lenders in August to waive a potential violation of its credit agreement because its debt had risen relative to its earnings, according to a regulatory filing. In September, lenders agreed to increase the amount of leverage allowed.
And the blowback is coming…
“There are distortions in multiple markets,” said Lawrence Goodman, president of the Center for Financial Stability, a monetary research group in New York. “It is like a Whac-A-Mole game: You don’t know where it is going to pop up next.”
…
“Oil companies that have high funding costs in the Eagle Ford and the Bakken shale plays are the ones that are most exposed right now due to lower crude prices,” Gary C. Evans, chief executive officer of Magnum Hunter Resources (MHR) Corp., said in a phone interview.
…
For other energy borrowers at risk, “the liquidity squeeze” will probably occur in March or April when banks re-calculate hoe much they may borrow under their credit lines based on the value of their oil reserves.
Deutsche Bank analysts predicted in a Dec. 8 report that about a third of companies rated B or CCC may be unable to meet their obligations should oil prices drop to $55 a barrel.
“If you keep oil prices low enough for long enough, there is a pretty good case that some of the weakest issuers in the high-yield space will run into cash-flow issues,” Oleg Melentyev, a New York-based credit strategist at Deutsche Bank, said in a telephone interview.
* * *
As we noted previously, here is Deutsche Bank’s most granular research:
Here are the details:
So how big of an impact on fundamentals should we expect from the move in oil price so far and where is the true tipping point for the sector? Let’s start with some basic datapoint describing the energy sector – it is the largest single industry component of the USD DM HY index, however, given this market’s relatively good sector diversification, it only represents 16% of its market value (figure 2). Energy is noticeably tilted towards higher quality, with BB/B/CCC proportions at 53/35/12, compared to overall market at 47/37/17. We find further confirmation to this higher-quality tilt by looking at Figure 3 below, which shows its leverage being around 3.4x compared to 4.0x for overall market. Similarly, their interest coverage stands at noticeably higher levels, even having declined substantially in recent years (Figure 4).
Energy issuer leverage has increased faster than that of the rest of the market in recent years, but this trend has largely exhausted itself in recent quarters. As Figure 5 demonstrates, growth rates in total debt outstanding among US HY energy names have been only slightly higher relative to the rest of HY market. It is almost certain in our mind that with the current shakeout in this space further incremental leverage will be a lot harder to come by going forward.
Perhaps the most unsustainable trend that existed in energy going into this episode shown in Figure 6, which plots the sector’s overall capex expenditure, as a pct of EBITDAs. The graph averaged 150% level over the past four years, clearly the kind of development that could not sustain itself over a longer-term horizon. Our 45%-full sample of issuers reporting Q3 numbers has shown this figure coming down to 110%, a move in the right direction, and yet a level that suggests further capacity for decline. This chart also shows, perhaps better than any other we have seen, the extent to which current economic recovery in the US has in fact been driven by the energy development story alone.
The next question we would like to address here is to what extent the move in oil so far could translate into actual credit losses across the energy sector. To help us approach this question we are borrowing from the material we are going to discuss in-depth in next week’s report on our views on timing/extent of the upcoming default cycle. For the purposes of the current exercise we will limit ourselves to saying that we have identified total debt/enterprise value (D/EV) as an important factor helping us narrow down the list of potential defaulters. Specifically, our historical analysis shows that names that go into restructuring, on average, have their D/EV ratio at 65% two years prior to default, and, expectedly, this ratio rises all the way to 100% at the time of restructuring. From experiences in 2008-09 credit cycle we have also determined that there was a 1:3 relationship between the number of defaulting issuers and the number of issuers trading at 65%+ D/EV prior to the cycle. Again, we are going to present detailed evidence behind these assumptions in the next week’s report.
For the time being, we will limit ourselves to applying these metrics to current valuations in the US HY energy sector, and specifically, its single-B/CCC segment. At the moment, average D/EV metric here is 55%, up from 43% in late June, before the 26% move lower in oil. About 28 pct of energy B/CCC names are trading at 65%+ D/EV, implying an 8.5% default rate among them, assuming historical 1/3rd default probability holds. This would translate into a 4.3% default rate for the overall US HY energy sector (including BBs), and 0.7% across the US HY bond market.
Looking at the bond side of valuation picture, we find that energy Bs/CCCs are trading at a 270bp premium over non-Energy Bs/CCCs today (Figure 7). This premium implies incremental default rate of 4.5% (= spread * (1 – recovery) = 270 * (1-0.4) = 4.5%). Actual default rate among US HY Bs/CCCs is currently running at 3%, a level that we expect to increase to 5% next year (not to be confused with overall US HY default rate, currently running at 1.7% and expected to increase to 3.0% next year).
The bottom line is hardly as pretty as all those preaching that the lower the oil the better for the economy:
In the next step we are attempting to perform a stress-test on oil, defined this way: what would it take for overall US energy Bs/CCCs segment to start trading at 65%+ total debt/enterprise value? Our logic in modeling this scenario goes along the following lines: if a 25% drop in WTI since June 30th was sufficient to push their average D/EV from 43 to 55, then it would take a further 0.8x similar move in oil to get the whole sector to average 65 = (65-55)/(55-43) = 0.8x, which translates into another 20% decline in WTI from its recent low of $77 to roughly $60/bbl. If this scenario were to materialize, based on historical default incidence, we would expect to see 1/3rd of US energy Bs/CCCs to restructure, which would imply a 15% default rate for overall US HY energy, and a 2.5% contribution to the broad US HY default rate.
How should one trade an ongoing collapse in oil prices? Simple: sell B/CCC-rated energy bonds and wait to pick up 10%.
If this scenario were to materialize, the US energy Bs/CCCs would have to trade at spreads north of 1,800bp, or about a 1,000bps away from its current levels. Such a spread widening translates into a 40pt drop in average dollar price from its current level of 92pts for energy Bs/CCCs.
It gets worse, because energy CapEx is about to tumble, which means far less exploration (and US fixed investment thus GDP), far less supply, and ultimately a higher oil price.
As the market adjusts to realities of sharply lower oil prices, it is important for to remember that the US HY energy sector is a higher quality part of the market. Higher credit quality will help many of them absorb an oil price shock without jeopardizing production plans or ability to service debt. Their capex rates, expressed as a pct of EBITDAs, have already declined from an average of 150% over the past four years to roughly 110% today. We still consider this level to be high and thus subject to further pressures. This in turn should work towards slower rates of supply growth, and thus ultimately towards supporting a new floor for oil prices. A 25% in oil price so far has pushed debt/enterprise valuations among US energy B/CCC names to a point suggesting 8.5% future default probability, while their bonds are pricing in a 9.5% default probability.
And the scariest conclusion of all:
Finally, our stress-test shows that a further 20% drop in WTI to $60/bbl is likely to push the whole sector into distress, a scenario where average B/CCC energy name will start trading at 65% D/EV, implying a 30% default rate for the whole segment. A shock of that magnitude could be sufficient to trigger a broader HY market default cycle, if materialized.
And now back to the old “plunging oil prices are good for the economy” spin cycle.
An additional, big picture view of the future of oil:
http://russia-insider.com/en/2014/12/13/1782?page=0%2C0
It ain’t a pretty picture.