DOW PRICED IN GOLD IS 65% OFF ITS HIGH

“You can’t print gold.”

For some perspective on the long-term performance of the stock market, today’s chart presents the Dow priced in another global currency — gold. Today’s chart illustrates how it currently takes 15.7 ounces of gold to ‘buy the Dow’ (i.e. the Dow / gold ratio) — well off the 44.8 ounces it took back at its peak in 1999. From the 1990 peak until 2011, the Dow (priced in gold) endured a massive bear market. Since 2011, gold has struggled while the Dow has continued to rally. All of this has resulted in the Dow (priced in gold) rallying in a well-defined, upward sloping trend channel. Despite this strong rally, however, the Dow (priced in gold) remains well below its 1999 peak and is currently testing support of its four-year upward sloping trend channel.


Chart of the Day


CHINA JUST SHIT THE BED

China shit the bed overnight. The shit is now hitting the fan. Shit is fucked up and bullshit. I’m not shitting you.

Stock markets don’t fall by 8.5% in one day unless there is some major shit happening beneath the surface. A comparable drop in the US stock market would be 1,500 points. Do you think a few Wall Street assholes would shit their pants if that happened? Do you think there would be a few margin calls as that shitty scenario played out?

Here’s the deal. The Chinese authorities have attempted everything they could possibly do to stop their over-leveraged, over-bought, over-hyped, corrupt, fraudulent markets from falling. They have threatened imprisonment for selling, disallowed short selling, stopped allowing trading on thousands of company stocks, and propped up their markets with trillions of yuan poured into the gaping hole.

Between the end of June and early July, the Chinese government announced at least 40 measures to prop up the market, including an interest-rate cut by the central bank and establishing a stabilization fund to outright buy stocks. All together, Chinese authorities are estimated to have mobilized as much as 5 trillion yuan, almost 10% of the gross domestic product, to halt panic sales.

It’s all been for naught. Fear is now trumping greed. The infallibility of central bank manipulators is being revealed to be false. They are nothing but money printing academic fools doing the bidding of greedy bankers and corrupt politicians. This is only the beginning of the end. There are thousands of points to go, billions to vaporize, and millions of lives to be ruined.

Welcome to the Fourth Turning. No shit.

Chinese Stocks Suffer Second Biggest Crash In History, 1,500 Companies Halted Limit Down

Tyler Durden's picture

This was not supposed to happen.

After pledging, investing and otherwise guaranteeing the Chinese stock market to the tune of 10% of GDP, and intervening on at least 40 different occasions in the past month ever since China’s stock bubble burst in late June, with the subsequent crash nearly taking the Shanghai Composite red for the year, overnight China officially lost control for the second time, when after a weak start to the Monday trading session, things turned very ugly in the last hour, when the Shanghai Composite plunged by 8.48%, closing nearly at the lows, and tumbling some 345 points for its biggest one-day drop since February 2007 and its second biggest crash in history!

The selling was steady throughout the day, but spiked in the last hour on concerns China would rein in its market-supporting programs following IMF demands to normalize its relentless market intervention. According to Bloomberg’s Richard Breslow: “fear that the extraordinary support measures employed to hold up the market may be scaled back caused heavy afternoon selling resulting in a down 8.5% day.” Of course, one can come up with any number of theories to explain the plunge: for example the PBOC did not buy enough to offset the relentless selling.


The last thing the communist party and the PBOC wanted was another massive sell off after having not only fired the “bazooka” but come up with a different bazooka to halt “malicious sellers” virtually every day, including threats of arrest.

Continue reading “CHINA JUST SHIT THE BED”

DOW REALLY UP 12% IN THE LAST 16 YEARS

Yeah. They won’t be telling you this on CNBC. The Wall Street shyster banks won’t have this in their marketing material. And now the kicker. This pitiful return is after a QE induced bubble that is about to pop. I’ll be able to put up the same chart in 2025 showing the Dow no higher than it was in 1999 on an inflation adjusted basis.


Chart of the Day

32 YEARS TO BREAKEVEN

Interesting long-term inflation adjusted chart of the Dow below. You can clearly see the secular bull and bear markets.

  • If you had bought and held at the 1929 high, it would have taken 32 years to breakeven on an inflation adjusted basis.
  • If you had bought and held at the 1966 high, it would have taken 32 years to breakeven on an inflation adjusted basis.

The stock market reached a secular high in 2000. Extreme monetary easing by the Fed delayed the secular bear market and the Dow got back to its 2000 high in 2007. After another crash, the Fed has provided unprecedented monetary stimulation and succeeded in pushing the Dow back up to the all-time high. It still took someone who invested in the Dow in 1999, fifteen years to get back to breakeven.

Now the real question. Can you have a secular bull market with valuations at record highs and having never allowed the secular bear market to actually happen? My humble guess is that 32 years from now, the inflation adjusted Dow will be no higher than it is today.

If I’m still alive, I’ll be 84 years old and I’ll tell everyone on TBP – I told you so!!!


Chart of the Day

Continue reading “32 YEARS TO BREAKEVEN”

IT AIN’T OVER ‘TIL IT’S OVER

It ain’t over until it’s over. The lows were not reached in 2009. Central bank manipulations and schemes temporarily delayed reaching a true bottom. They have failed. A true secular bottom would be 60% to 80% below today’s levels. Are you prepared for that? That would put the Dow at 7,000 or below. Do you think that is impossible? It was trading at 6,500 in March of 2009. If Bernanke and Geithner hadn’t forced the FASB to allow Wall Street bankers to value their worthless assets as if they were worth 100 cents on the dollar, the 4,000 secular low would have been reached. Now we will pay the price with a far worse scenario. The Fed has shot their load. Fourth Turnings are relentless and nasty.

Are We About to Enter a Secular Bear Market?

Guest Post by Chris Hunter


Wall_Street_bubbles_-_Always_the_same_-_Keppler_1901_1

Source: wikimedia

Today’s chart, from the folks at Crestmont Research, speaks volumes about current investor behavior.

In particular, it calls into question claims being bandied about in the mainstream media that we could be at the start of a new secular bull market in US stocks.

It shows that previous secular (long-term) bear market cycles tend to start when the US stock market is trading on a Shiller P/E – a price-to-earnings ratio is based on average inflation-adjusted earnings from the previous 10 years – of between 20 and 25 (blue-shaded area on the chart).

Continue reading “IT AIN’T OVER ‘TIL IT’S OVER”

DOW STILL 66% BELOW ITS 1999 PEAK

You won’t hear the bimbos, boobs, and shysters on CNBC talking about this chart. It seems even after a couple of rough years for the barbaric relic, its 12 year bull market has helped it retain its supremacy over the stock market. Now the real question. Over the next ten years, will the Dow/Gold ratio go back to 44 or to 5 or lower? The Dow is at an all-time high and valuations are at levels of 1929, 2000, and 2007. Gold is down 37% from its 2011 highs.

For the ratio to go back to 44 would require gold to drop to $600 and the Dow to soar past 26,000, or some combination thereof. Does that sound likely?

For the ratio to go back to 5 would require gold to hit $2,000 and the Dow to drop to 10,000, or some combination thereof. That would be a 67% increase in gold and a 45% drop in the Dow. Does that sound reasonable?


For some perspective on the long-term performance of the stock market, today’s chart presents the Dow priced in another global currency — gold. Today’s chart illustrates how it currently takes approximately 15.3 ounces of gold to ‘buy the Dow’ (i.e. the Dow / gold ratio) — well off the 44.8 ounces it took back at its peak in 1999. From the 1990 peak until 2011, the Dow (priced in gold) endured a massive bear market. Since 2011, gold has struggled while the Dow has continued to rally. All of this has resulted in the Dow (priced in gold) rallying in a well-defined, upward sloping trend channel. Despite this strong rally, however, the Dow (priced in gold) remains well below its 1999 peak.

Chart of the Day

“Regardless of the dollar price involved, one ounce of gold would purchase a good-quality man’s suit at the conclusion of the Revolutionary War, the Civil War, the presidency of Franklin Roosevelt, and today.”Peter A. Burshre

NO ONE TOLD YOU WHEN TO RUN, YOU MISSED THE STARTING GUN

Ticking away the moments that make up a dull day
You fritter and waste the hours in an offhand way.
Kicking around on a piece of ground in your home town
Waiting for someone or something to show you the way.

Tired of lying in the sunshine staying home to watch the rain.
You are young and life is long and there is time to kill today.
And then one day you find ten years have got behind you.
No one told you when to run, you missed the starting gun.

Pink Floyd – Time

I stumbled across two mind blowing charts yesterday that had me pondering how generations of Americans had frittered their lives away, spending money they didn’t have  on things they didn’t need, utilizing easy to acquire debt, and saving virtually nothing for their futures or a rainy day. We are a nation of Peter Pans who never grew up. While I was driving home from work, one of my favorite Pink Floyd tunes came on the radio and the lyrics to Time seemed to fit perfectly with the charts I had just discovered.

We were all young once. Old age and retirement don’t even enter your thought process when you are young. Most people aren’t sure what they want to do for the rest of their lives when they are in their early twenties. Slaving away at your entry level low paying job, chasing the opposite sex, getting drunk, and having fun on the weekends is the standard for most young people. But you eventually have to grow up. Because one day you find ten years have got behind you. No one tells you when to grow up. And based on the charts below, tens of millions missed the starting gun.

I graduated college in 1986 and started my entry level CPA firm job, making $18,000 per year. I did live at home for a year and a half before getting an apartment with a friend. I was able to buy a car, pay off my modest student loan debt, go out on the weekends, and still save some money. I was in my early 20’s and had opened a mutual fund account at Vanguard. Anyone who entered the job market from the mid 1970s through the mid 1980’s, which would be the late Baby Boomers and early Generation Xers, had job opportunities and the benefit of low stock market valuations.

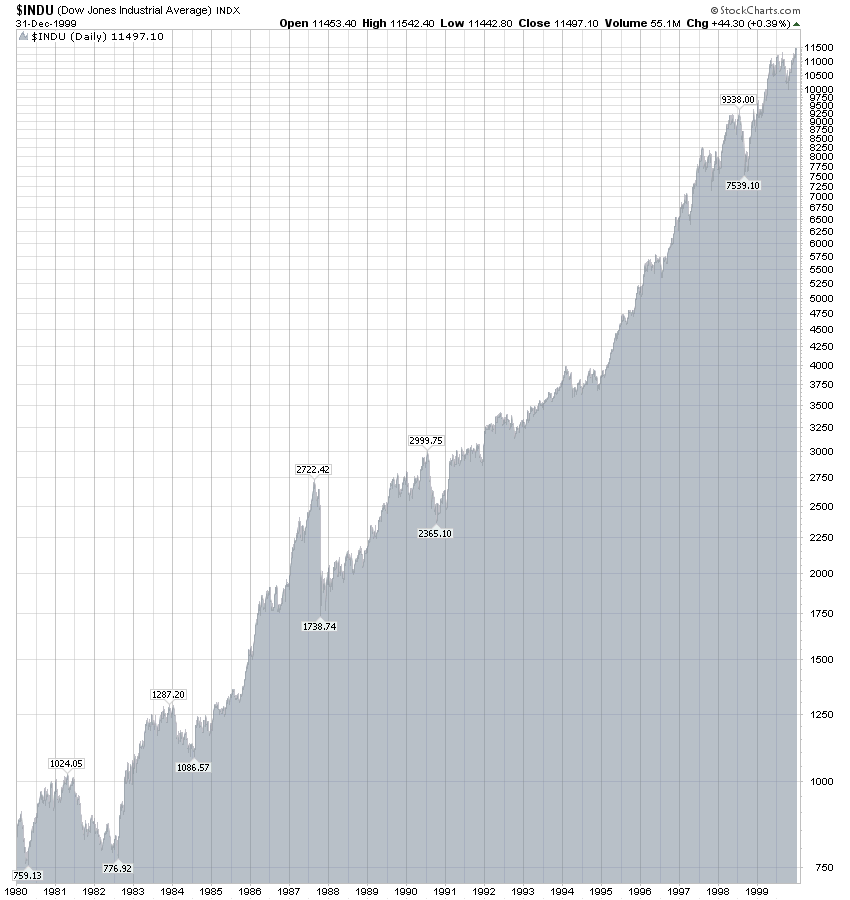
P/E ratios of the market were single digits in the late 70s and early 80s, versus 20 today. Dividend yields on stocks averaged 5% for the S&P 500, versus 1.9% today. The Dow bottomed out at 759 in 1980, while the S&P 500 bottomed at 98. A 20 year secular bull market was about to get under way. Baby Boomers and Generation Xers had the opportunity of a lifetime. Even after six years of the bull, when I graduated from college the Dow stood at 1,786 and the S&P 500 stood at 521. I had just begun to invest when the 1987 crash wiped out 20% in one day. It meant nothing to me. I didn’t have much to lose, so I just kept investing.

The 20 year bull market took the Dow from 759 to 11,722 by January 2000. The S&P 500 rose from 98 to 1,552 by March 2000. You also averaged about a 3% dividend yield per year over the entire 20 years. Your average annual return, including reinvested dividends, exceeded 17%. Anyone who even saved a minimal amount of money on a monthly basis, would have built a substantial nest egg for retirement. If you had invested in 10 Year Treasuries, your annual return would have exceeded 11% over the 20 years. Even an ultra-conservative investor who only put their money into 5 year CDs would have averaged better than 7% per year over the 20 years.

Even with the two stock market collapses since 2000, your average annual return in the stock market since 1980 still exceeds 11%. That’s 34 years with an average annual total return of better than 11%. Every person who had a job over this time frame should have accumulated a decent level of retirement savings. That is why the chart below is so shocking. Over 15% of all people 60 and older and 23% of people 45 to 59 years old have NO retirement savings. None. Nada. Zilch. This means 25 million Boomers and Xers are stuck living off a Social Security pittance and choosing between keeping the heat on or eating a feast of Ramen noodles and Friskies. It seems they let 30 years get behind them. They missed the starting gun.

http://www.mybudget360.com/wp-content/uploads/2014/11/retirement-savings.png

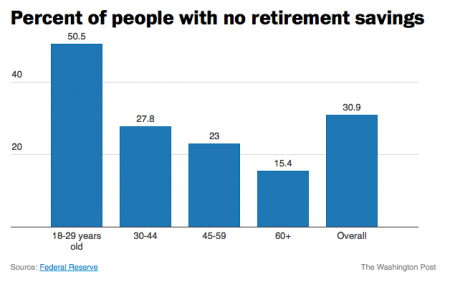
I’m not shocked that over 50% of 18 to 29 year olds have no retirement savings. With the terrible job market, declining real wages, massive levels of student loan debt, two stock market crashes in the space of eight years, and 4% annual returns since 2000, young people today have neither the means nor trust in the system to save for retirement. Their elders had no such excuse. Just a minimal amount per paycheck saved over the last 30 years would have compounded to well over $100,000, even at modest salary levels. It is disgraceful that 25 million people over the age of 45 have saved nothing for their retirement. Far more disgraceful is the median household retirement balance of $3,000 for all working age households. There are 122 million households in this country and 61 million of them have $3,000 or less in retirement savings.

http://www.mybudget360.com/wp-content/uploads/2014/11/20130620__figure9.jpg

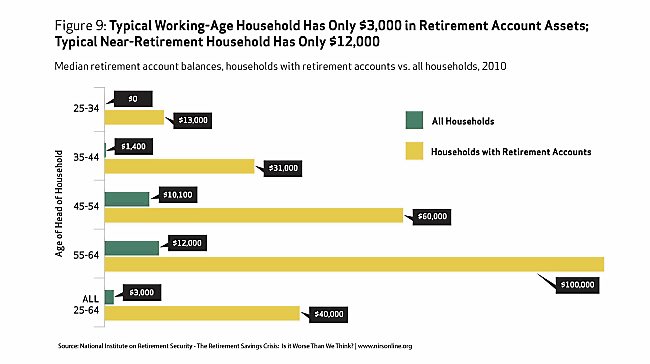
The far worse data points are the $12,000 median retirement balance of aged 55 to 64 households and the $10,100 median retirement balance of aged 45 to 54 households. These people are on the edge of retirement and have less than one year’s expenses saved. There is no legitimate excuse for this pitiful display of planning. These people had decades to save, strong financial market returns, and if they worked for a decent size organization – matching contributions to their retirement accounts. They didn’t need a huge salary. They didn’t need to save 20% of their salary. They didn’t have to be an investing genius. A savings allocation of just 3% to 5% would have grown into a decent sized nest egg after a few decades of compounding.

We know from the data in the chart, it didn’t happen. The concept of delayed gratification is unknown to the millions of nearly broke Boomers and Xers, shuffling towards an old age of poverty, misery and regret. A 64 year old has a life expectancy of about 20 years. They’ll have to budget “very” frugally to make that $12,000 last. The question is how did it happen. I don’t buy the load of crap that you can’t judge people as groups. I judge people by their actions, not their words. I know you can’t lump every Boomer and Xer into one box. Individuals in every generation have bucked the trend, lived within their means, saved for the future, and accumulated significant nest eggs for their retirement. But the aggregate numbers don’t lie. The majority of those over the age of 45 have squandered their chance at a relatively comfortable retirement. These are the people who most vociferously insist the government do something about their self created plight. It’s their right to free healthcare, free food, subsidized housing, free utilities, higher minimum wages, and a comfortable government subsidized retirement. They are wrong. They had a right to life, liberty and the pursuit of happiness. It was up to them to educate themselves, get a job, work hard, and accumulate savings.

The generations of live for today, don’t worry about tomorrow Americans over the age of 45 have no one to blame but themselves. They bought those 4,500 sq foot McMansions with negative amortization 0% down mortgages. They had to keep up with the Jones-es by putting in granite counter-tops, stainless steel appliances, home theaters, Olympic sized swimming pools, and enormous decks. They have HDTVs in every room in their house and must have every premium cable channel, along with the NFL package. They upgrade their phones every time Apple rolls out a new and improved version. They pay landscapers to manicure their properties. They lease new BMWs every three years. They have taken exotic vacations on an annual basis. They haven’t packed a lunch for themselves since they were 16 years old. Eating out for lunch and dinner has been a staple of their existence for decades. That morning Starbucks coffee is a given. A new wardrobe of name brand stylish clothes for every season is a requirement because your neighbors and co-workers are constantly judging you. Nothing proves you’re a success like a Rolex watch, Canali suit, Versace boots, or Gucci handbag. The have it now generations got it then and have virtually nothing now because they acquired all of these things with debt.

Real cumulative household income is up 10% since 1980. Consumer debt outstanding has risen from $350 billion in 1980 to $3.267 trillion today. That is a 933% increase. We’ve had decades of faux prosperity aided and abetted by Wall Street shysters, corrupt politicians, mega-corporation mass merchandisers, and Madison Avenue maggots trained in the methods of Edward Bernays to convince willfully ignorant consumers to consume. And consume we did. Saving, not so much. You can blame the oligarchs, bankers, retailers, and politicians for the fact you didn’t save, but it rings hollow. No matter how much propaganda is spewed by the ruling class, we are still individuals with free will. The older generations had choices. Saving money requires only one thing – spending less than you make. Most Boomers and Xers chose to spend more than they made and financed the difference. When the average credit card balance is five times greater than the median retirement account balance, you’ve got a problem. The facts about our consumer empire of debt are unequivocal as can be seen in these statistics:

  • Average credit card debt: $15,593
  • Average mortgage debt: $153,184
  • Average student loan debt: $32,511
  • $11.62 trillion in total debt
  • $880.3 billion in credit card debt
  • $8.05 trillion in mortgages
  • $1.12 trillion in student loans

I don’t blame those in their 20’s and 30’s for not having retirement savings. Anyone who entered the workforce around the year 2000 has good reason to not trust the system or their elders. There have been two stock market collapses and every asset class is now extremely overvalued due to the criminal machinations of the Federal Reserve. There are far less good paying jobs. Real wages keep declining. They were convinced by their elders to load up on student loan debt, leaving them as debt serfs. The Wall Street/Federal Reserve scheme to boost home prices and repair their insolvent balance sheets has successfully kept young people from ever being able to afford a home. So you have young people unable to save, invest or spend. You have middle aged and older Americans with little or no savings, mountains of debt, low paying service jobs, and an inability to spend. The only people left with resources are the .1% who have captured the system, peddle the debt, and reap the rewards of consumption versus saving. They may be able to engineer a stock market rally to further enrich themselves, but they can not propel the real economy of 318 million people. Our consumer society is dying – asphyxiated by debt – shorter of breath and one day closer to death.

I’d love to offer some sage advice on how to fix this problem, but it’s too late. Too many people missed the starting gun. More than ten years got behind them. No one is going to come to the rescue of people who never saved for their future. The Federal government has already made $200 trillion of entitlement promises it can’t keep. State governments have made tens of trillions in pension promises they can’t keep. They can’t tax young people who don’t have jobs. Older generations who think the government is going to rescue them from their foolish shortsighted choices are badly mistaken. Their benefits are likely to be reduced because the unsustainable will not be sustained. The 45 to 64 year old cohort who chose not to save can run and run to try and catch up with the sun, but it’s too late. It’s sinking. Their plans have come to naught. They are destined for lives of quiet desperation. There is nothing more to say.

So you run and you run to catch up with the sun but it’s sinking
Racing around to come up behind you again.
The sun is the same in a relative way but you’re older,
Shorter of breath and one day closer to death.

Every year is getting shorter; never seem to find the time.
Plans that either come to naught or half a page of scribbled lines
Hanging on in quiet desperation is the English way
The time is gone, the song is over,
Thought I’d something more to say.

Pink Floyd – Time

NO MARKET MANIPULATION HERE – RIGHT?

I’m sure this is a coincidence. The Fed and their Wall Street puppet masters certainly don’t coordinate their buying, selling, and suppression of gold prices. That would be immoral and wrong, just like front running customers with HFT supercomputers. They would never do that. 🙂


CALLING ALL TECHNICAL ANALYSTS

I personally think technical stock analysis is bullshit. But there are millions of people who believe this voodoo stock analysis. Well weenies, it sure looks like the Dow has broken below long-term support. Doesn’t that mean sell? This is where these supposed technicians will come up with some new bullshit reason why this should be ignored. I never tire of seeing “experts” create new storylines to sell their propaganda bullshit in order to rationalize why they are wrong. Everyone looks smart in an unrelenting bull market. The morons and shills are revealed when the bear starts to growl.


The Dow has struggled so far in 2014 – down 6.8% year to date. For some perspective, today’s chart illustrates the overall trend of the stock market (as measured by the Dow) since 2003. As today’s chart illustrates, the Dow has benefited from a strong upward trend since early 2009 (see upward sloping green trendline). This year, however, the Dow has sold off sharply due to concerns over steep declines in emerging markets.The Dow’s steep decline has been significant enough to result in a break below long-standing support (upward sloping green trendline).

Chart of the Day

SO GOES THE YEAR

Don’t you find it fascinating there are absolutely NO stories in the MSM about the January Effect this year. Trust me. If stocks were up as of the end of January there would be hundreds of screeds from these faux journalists spouting how stocks almost always finish the year higher when January finishes higher. They use these stories to lure more muppets into the Wall Street web of deception and lies.

Well, January is over and the Dow was down 4.5% and the S&P 500 was down 2.7%. So where are all the MSM stories about the January effect? NADA. Nothing. The silence from the pundits and talking heads is deafening. Do you need any more proof that the MSM is nothing but the cheer leading section for the ruling class and their only function is to spew slanted propaganda?

I’ll keep looking for a January Effect article in the MSM, but I guarantee you if I see one it will be written to discredit the January Effect and tell the muppets to buy, buy, buy.

TBP POLL #17,000 or #14,000

This week is going to leave a mark on the bulls. The Dow hit its all-time high of 16,588 less than one month ago. It has dropped over 700 points since then, with almost 500 points in the last two days. The question everyone wants answered is whether this is the start of the big crash that Hussman and a few others have been predicting, or just another buying opportunity.

So what say you?

Which level on the Dow will we hit first?

A. 17,000

B. 14,000

C. Yellen will guarantee a reset of the Dow level at 20,000 in order to save the country

D. The electrical grid will go down, so no one will know at what level the Dow stands


13,000 – 46,500,000 – 22,500,000 – 8,750,000

Four charts that tell you everything you need to know about the American Empire of Dirt are below. While the 1% who run the rigged financial system of this country utilize their high frquency trading super computers to ramp the Dow Jones back up to 13,000 (still 8% below the level of 2007) in an effort to gorge themselves on the carcasses of the middle class, the true picture of our collapsing empire is there to see for anyone with two eyes and a functioning brain. There are 117 million households in this country and 22.3 million of them are on foodstamps. There are only 75 million owner occupied houses in the country and 30% of them have a mortgage loan greater than the home value. That’s 22.5 million households underwater. There are 243 million working age Americans and only 142 million of them working, with 35 million of those only working part-time. At the same time we have 48 million people collecting Social Security retirement and another 8.7 million people collecting Social Security Disability.

We have re-entered recession. Gas and food prices are rising. Europe is about to collapse. China’s fraud of an economy is coming to a halt. Retail sales have imploded. Consumer confidence is in the toilet. New and existing home sales are falling. But CNBC and the Wall Street shills are telling you its the best time to buy.

Are we living in bizarro world?