

Another great article on Peak Oil from Gail the Actuary on http://www.theoildrum.com/. If her assessment of oil production between now and 2021 is even close to accurate, we’re in a world of hurt. Impartial articles like this one should convince the most delusional peak oil denier that their drill,drill, drill mantra is nothing but hot air. I hadn’t seen the figure she stated as being the current cost for a barrel of oil to be produced in the Middle East as $95. That would appear to put a floor on the price of oil at a level above $95.
The good news is that our oil consumption will decline as soon as the price gets high enough to push our country back into recession. We are just about there. So, oil prices will decline again, but the low price this time will be much higher than the last low. This is the bumpy plateau. Supply and demand sure is a bitch. Expect some more humanitarian invasions of Middle East countries sitting on top of our oil.
My little peak oil widget just passed the 10 billion barrels consumed level for the year so far. I wonder if we discovered 10 billion new barrels during this same time frame.

Peak Oil – April 2011 Update
Posted by Gail the Actuary on May 2, 2011 – 1:27pm
The US Energy Information Administration’s January oil production figures are out, and they show record oil production. Where are we headed from here?
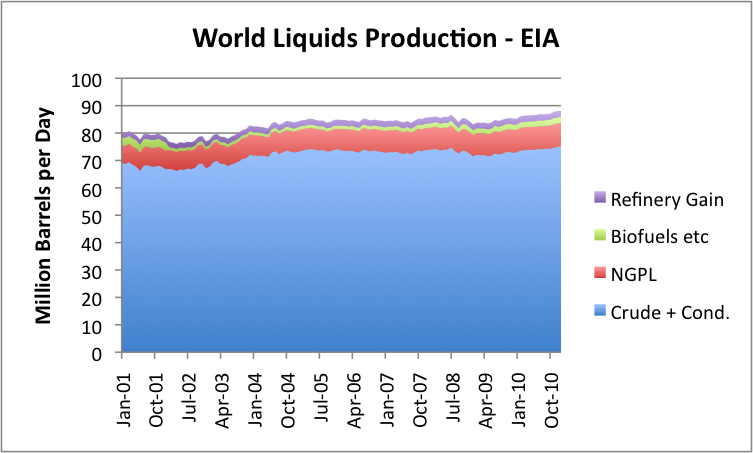
Figure 1. World “Liquids” Production through January 2011, based on Energy Information Administration data.
While production for January is up a bit (219,000 barrels compared to December), the monthly numbers bounce around a fair amount because of planned maintenance. They are also subject to revision. Figure 2 seems to indicate that the production amounts are trending upward a bit, probably in response to the recent higher prices.
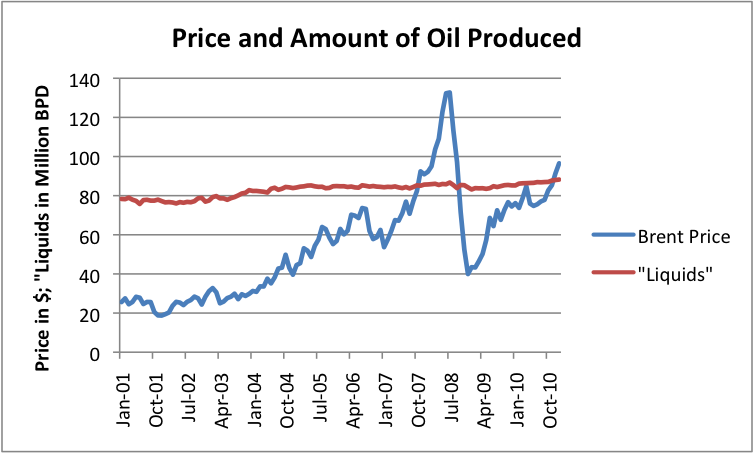
Figure 2. Monthly average Brent Oil price and total “liquids” produced, both from US Energy Information Administration.
The amounts in Figures 1 and 2 are not entirely up to date, since they are only through January 31, 2011. All of the disruption in the Middle East started at the very end of January, and the disruption in Libya’s supplies did not start until February. The earthquake in Japan took place March 11. OPEC estimates that OPEC and world oil supply fell in both February and March, with Libya’s production falling by 1.2 million barrels a day between January and March, with only small supply increases elsewhere offsetting this. World oil prices continue to be high. At this writing, West Texas Intermediate is about $111.50 a barrel; Brent is about $122.
So what do we expect going forward?
Eventual Decline, but not Following a Hubbert Curve
It seems to me that the story about what happens in the future with oil supply is much more complex than what depletion and new supply alone would suggest. As I explained in a previous post (Our Finite World version and Oil Drum version), the actual downslope is likely to be steeper than what a Hubbert Curve would suggest, because economies of many importing countries are likely to be adversely affected by rising oil prices, and because demand (and tax collections) are likely to be low in countries that lose jobs to countries that use oil more sparingly.
Hubbert assumed that nuclear or some other cheap alternative form of energy would allow business to go on pretty much as usual without oil. We know now that we are close to the downslope, but no inexpensive alternative has been developed in quantity. Because of this, actual production is likely to be less than the amount that is theoretically possible. This happens because of indirect impacts of inadequate oil supply, such as recession when prices oil prices rise; riots when food is in short supply; and inadequate demand for oil because of jobs move overseas to countries using less oil, leaving many unemployed.
In some sense, if oil prices could rise indefinitely, we would never have a peak oil problem. The high prices would either stimulate production of alternative types of energy or would enable oil production in areas where oil is very costly to extract. The indirect impacts mentioned above prevent oil prices from rising indefinitely. These indirect impacts seem to be related to inadequate net energy for society as a whole. Theoretically, if oil prices could rise indefinitely, we could even end up using more energy to extract a barrel of oil than really is in the barrel of oil in the first place–something that is hardly possible. The fact that rising oil prices lead to impacts that tend to cut back demand seems to be a way of keeping prices in line with the energy the oil actually provides.
Which countries are able to buy the oil that is produced?
If we look at oil consumption by area, we find the following:
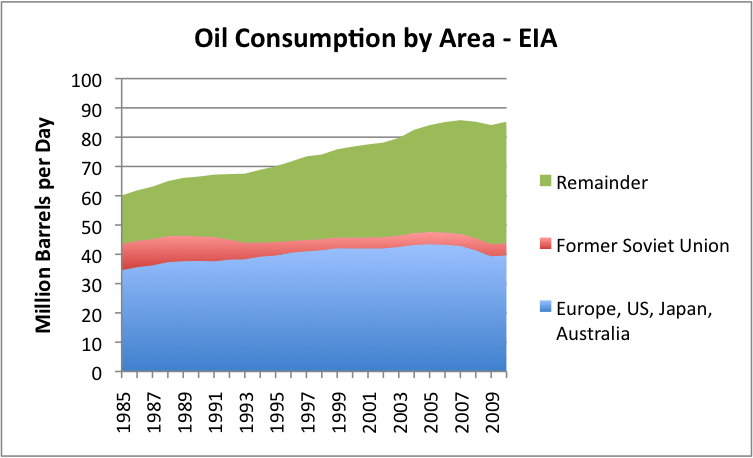
Figure 3. Oil consumption by area, based on EIA data.
It is clear from Figure 3 that consumption of my grouping called “Europe, US, Japan, and Australia) is much flatter (and recently declining) than that of the “Remainder.” The Remainder includes oil exporting nations, plus China and India and other “lesser developed” countries, many of which are growing more rapidly than countries like Europe, US, Japan, and Australia.
I have plotted the same data shown in Figure 3 as a line graph in Figure 4. The latter figure shows even more clearly how different the oil use growth rates have been.
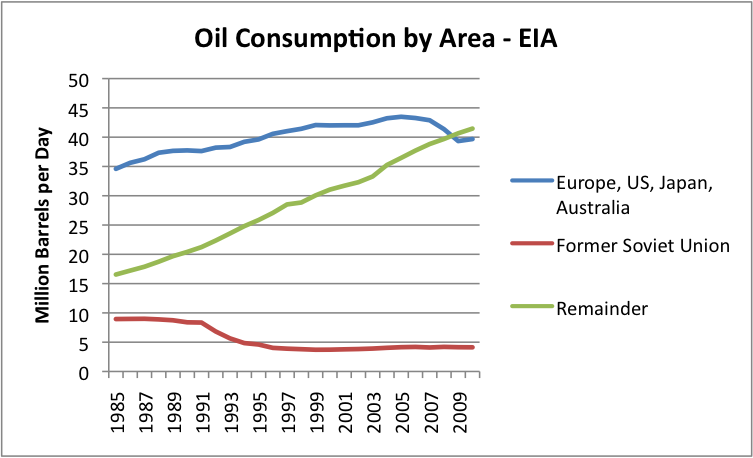
Figure 4. Data from Figure 3, graphed as a line graph, instead of a stacked area chart.
If world oil supply is close to flat (shown in Figures 1, 2, and 3), Figure 4 shows that we have a potential for a real conflict going forward. The “Remainder” countries in Figure 4 will want to continue to increase their oil usage in future years, even if oil supply remains flat. This is likely to lead to considerable competition for available oil and high prices, such as we are seeing now. About the only way the “Remainder” countries can increase their oil usage is if oil usage by the “Europe, US, Japan, and Australia” group declines.
Many people believe that the only alternative to adequate oil supply is for the amount of oil produced by oil companies to fall and because of this, for shortages to result. While this scenario is possible, especially in the presence of price controls, in this post we show another way that oil consumption can be limited.
A very common way that oil usage (consumption) can be expected to decline is if high oil prices induce a recession. The countries that seem to be most susceptible to recession are countries that are (1) oil importers and (2) are heavy users of oil, since an increase in oil price has the most adverse impact on the financial health of these countries. When recession is induced, there are layoffs. These layoffs reduce oil usage in two ways: (1) less oil is used for making and transporting products that these workers would have made, and (2) the laid off workers are less able to afford products using oil, so reduce their purchase of oil products.
Because of this relationship, competition for oil is likely to be very closely related to competition for jobs in the future. The countries that get the jobs can be expected to get a disproportionate share of oil that is available.
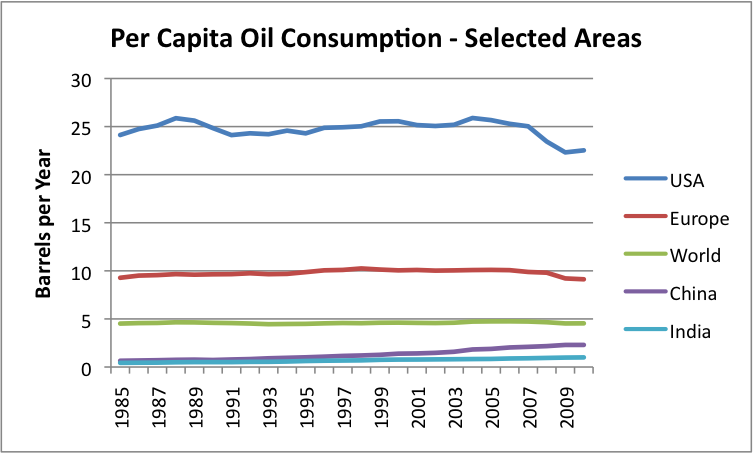
Figure 5. Per Capita Energy Consumption, based on EIA data.
If we look at per capita oil consumption (Figure 5) on a world basis, it has been close to flat since 1985, because oil production until very recently rose enough that oil growth more or less corresponded to population growth. China and India’s per capita oil consumption rose, meaning that the oil consumption of someone somewhere, such as the Former Soviet Union, needed to decline.
Future Oil Supply
If we look at historical oil production (Figure 6), it has been fairly “bumpy”:
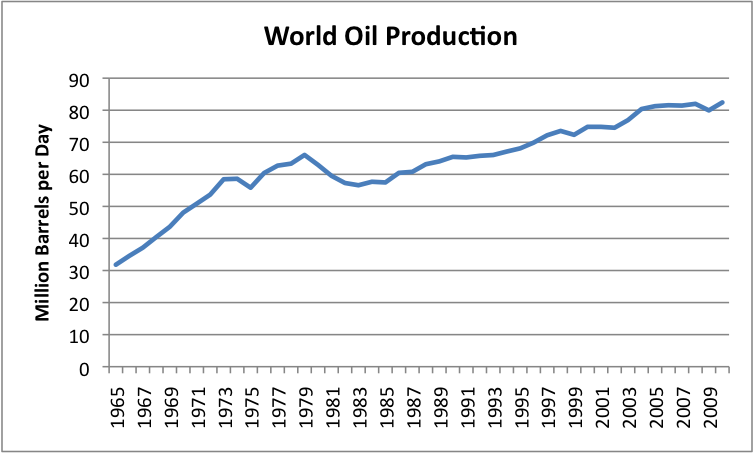
Figure 6. World oil production for crude, condensate and natural gas liquids. 1965-2009 from BP; 2010 from EIA.
By fitting trend lines, we can see where oil production seems to be headed:
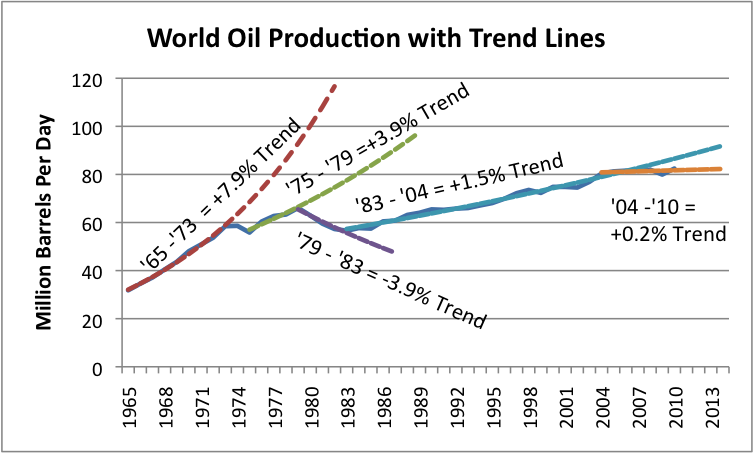
Figure 7. World oil production from Figure 6, with fitted exponential growth trend lines.
What we can see from Figure 7 is that the growth rate of world oil supply has gradually been slowing. The growth rate was highest in the 1965 to 1973 period, at 7.9% per year. Then we hit the “oops” period of 1973 to 1975, when we ran into conflict with OPEC regarding oil supplies. The trend rate dropped to 3.9% in the 1975 to 1979 period. Between 1979 and 1983, oil consumption dropped to a -3.9% per year, when we picked some of the low hanging fruit regarding oil usage (mostly by eliminating petroleum from electricity generation and downsizing automobiles). The trend between 1983 and 2004 shifted to +1.5% per year, and since 2004, seems to be about +0.2%.
There are so many countries involved, that it is not easy to identify one country or area that is rising, but one country of note is Iraq. Its production in January, 2011, seems to be up by 300,000 barrels per day, relative to mid-2010, based on the latest data. Thus Iraq seems, for now, to be helping to keep world oil production flat, or even growing by a bit, despite increasing depletion elsewhere.
Looking at Figure 7, it looks like the “trend” in trend rates over time is down. In the absence of other information, we would expect production to remain at its recent trend rate of 0.2%, or alternatively, the trend rate could take another step downward, probably to an absolute decline in oil production. A recent announcement from Saudi Arabia suggests that its ability to offset declines elsewhere in the future is likely to be virtually nil, so a continued decline in production from the North Sea and elsewhere will need to be made up with new production elsewhere, or will lead to a worldwide decline in oil production.
World population has been growing. If oil production remains flat or declines, and world population grows, this means that someone has to be a loser, in terms of per capita consumption. I am not certain how this will turn out, but I see at least three forces that may come into play:
1. Countries may figure out that permitting jobs to move to less developed countries is not in their best interests, and start increasing protectionism. This will tend to keep demand more level (higher for importers, and lower for growing economies). The overall impact on oil demand is less clear–less oil will be needed for long-distance transport, but more oil will be needed to maintain current lifestyles of workers.
2. Countries that are in financial difficulty may find themselves increasingly shunned, as they seek to “restructure” their debt, and may find themselves increasingly cut off from buying oil products and the goods that that are made using oil products. This will tend to reduce aggregate world demand for oil, by reducing consumption in specific countries that have financial difficulty.
3. There may be recession affecting a number of countries, reducing their demand for oil. We don’t know how exactly that this will change the shape of the world oil production curve, but Figure 8 shows my very rough guess as to how supply might be affected. (Your view may differ.)
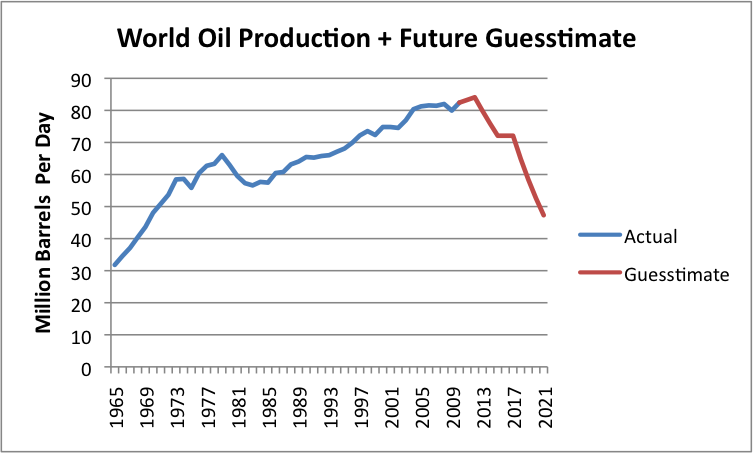
Figure 8. Historical crude, condensate, and NGL production based on BP and EIA data, plus a Guesstimate of Future Oil Supply.
It seems to me that as we go forward, we are likely to see a jagged pattern in oil production decline, reflecting a combination of less demand for high-priced oil as oil supplies continue to be very tight, except at high prices. In addition, some countries can be expected to increasingly drop out of competition for oil, as their financial situations deteriorate. Thus, the pattern for decline in oil consumption can be expected to vary significantly from country to country, depending on their policies and their financial conditions.
Clues as to Which Countries May Drop Out First
If we look at the per-capita consumption of the PIIGS countries, we see that for the most part, these were countries that increased their consumption of oil, and then were not able to maintain the increase.
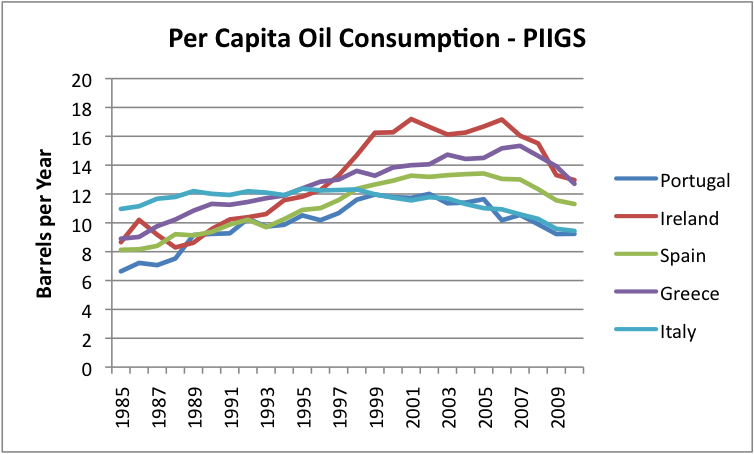
Figure 9. Per capita oil consumption of PIIGS countries, based on EIA data.
The difference is quite striking when we compare per-capita oil consumption to a few of the non-PIIGS European countries.
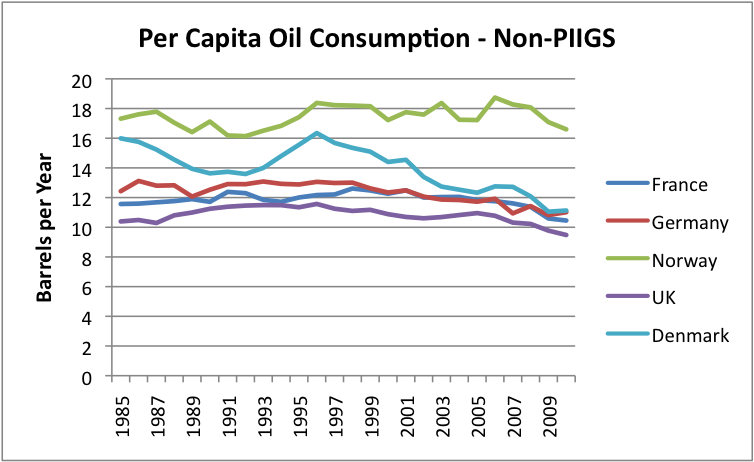
Figure 10. Per capita oil consumption of selected European “non-PIIGS,” based on EIA data.
Why is there such a different pattern between the PIIGS and the non-PIIGS? I haven’t researched the situation extensively, but it would seem as though the PIIGS countries tended to be agricultural countries that tried to develop more diversified (oil intensive) economies. They expanded and incurred a lot of debt, and now this debt is becoming difficult to pay back. As far as I can see, this economic growth was not based on the growth of stable, fairly cheap supply of electricity, such as hydro-electric or coal. Instead, growth depended fairly heavily on oil use, and the cost of oil rose. It may be that part of this growth in oil use occurred because of an improvement in standard of living–more cars, more vacations, bigger homes.
My working hypothesis is that when oil prices went up, the economies of the PIIGS countries had too much debt for the new industries to provide enough revenue to service both the higher costs of oil and the debt costs. Countries which didn’t try to grow in this way didn’t have as much difficulty, although high oil prices are still a burden for them. They may eventually run into debt problems, just a little later.
What are China and India and some of the other countries that are growing rapidly doing differently, that their economies haven’t collapsed? One thing they have going for them is the fact that their oil usage is at a vastly lower level, even after rapid growth. Another thing that they often have going for them is growing electricity production, using an energy source that is relatively cheap. In the case of China and India, this is mostly coal; in the case of some of the other lesser developed countries, it is hydro-electric.

It seems as though at some price, each country will hit recessionary pressures and drop back in its demand for oil. This price will vary by country, depending on the country’s current debt situation, the extent to which the country can continue to “grow” its economy based on a growing source of cheap electricity, and how well international trade holds up with increased protectionism and higher oil prices. Countries depending on growing hydroelectric and coal-fired electricity are likely to hit limits, too, as these supplies reach natural limits.
One situation which may affect how long oil prices can stay high for the United States is the existence of QE2, or “Quantitative Easing 2.” This seems to keep the dollar low relative to other currencies, thus allowing commodities prices to remain high. QE2 is scheduled to end June 30, or earlier. If it is allowed to expire, it would seem as though interest rates could rise materially (because QE2 also keeps interest rates low), and could lead to a rapid deterioration in the financial condition of the United States. If this should happen, it would seem as though the United States could be one of the countries that enters recession and significantly decreases its demand for oil. Of course, high oil price by itself may lead to this outcome quite soon, also.
We cannot know how all of these forces will play out. Generally, I would expect that there will continue to be an upward push on the price for oil because of rising extraction costs, and because unrest in the Middle East is causing countries to provide additional benefits for their citizens, further raising their costs (estimated to be $95 barrel by the Wall Street Journal). As long as the world economy is expanding, rising demand will also tend to pull oil prices upward, because many countries are trying to compete for a supply of oil that is barely growing.
The various countries around the world can be expected to be in differing positions with respect to their ability to pay high oil prices. Gradually (or not so gradually), the weakest ones will be pushed away from buying oil, either because of debt defaults and shunning by exporters (unless they have goods to trade in return), or because of recession, or both. World oil production seems likely to decline as the number of countries that can afford to continue to purchase high-priced oil declines. Ultimately, oil consumption can be expected to drop to close to 0, because no country will be able to afford to buy very much oil at a high price, and because oil companies will not be able to maintain necessary infrastructure for a very limited supply of oil.
I don’t think that we can expect an analysis of the theoretical capacity of future world oil production to tell very much of the peak oil story. We really don’t know how much of the oil which seems to be available will actually be produced. A lot of the story will depend on the ability of individual countries to keep their economies in good enough shape that they can afford to buy high-priced oil. Many residents of countries that are shut out from oil supply are likely to find that oil products are not available at any price.
Originally published on Our Finite World.

