WHEN WILL THEY ADMIT IT?

Below are various headlines just from the last 24 hours. You have the manufacturing sector in the U.S. contracting. You have unemployment claims rising. You have new and existing home sales falling, even with the lowest mortgage rates in history. You have one of the best retailers in the country announcing that their sales are growing much slower than expected. You have the biggest consumer company in the world announcing they are having big problems and is reducing their expansion. This is all in addition to the European Clusterfuck. Anyone with two brain cells can see we have entered part two of the Greater Depression. Therefore, you won’t hear it from CNBC or any of the other corporate MSM shills. Six months into the recession, they will be forced to admit it.

Philly Fed Craters

 
Tyler Durden's picture

Submitted by Tyler Durdenon 06/21/2012 10:10 -0400

One word to explain the Philly Fed which just printed at -16.6, or the weakest since August 2011, on expectations of an unchanged print: abysmal. Basically every subcomponent of the index was negative except for number of employees, although luckily we already know that US jobs (even part-time ones) are collapsing too. In short: if this horrendous print does not boost stocks higher, nothing can.


Unemployment Claims Hit a 7 Month High

The average of new claims over the past month, meanwhile, climbed by 3,500 to 386,250, marking the highest level in almost seven months.


Existing Home Sales Fall Again

Total existing-home sales, which are completed transactions that include single-family homes, townhomes, condominiums and co-ops, declined 1.5 percent to a seasonally adjusted annual rate of 4.55 million in May from 4.62 million in April. This was lower than expectations of sales of 4.57 million.


Markets Losing Hope After China PMI Hits 7 Month Low

 
Tyler Durden's picture

Submitted by Tyler Durdenon 06/21/2012 00:40 -0400

HSBC’s Flash Manufacturing PMI printed at 48.1 – its lowest in 7 months as contraction continues in the world’s growth engine – as inventories rise at a faster rate and new export orders plunged at the fastest rate since March 2009. Risk markets were already leaking lower before this but extended losses with ES down 6pts from the close (and over 11 from the day’s highs). Treasuries are bleeding a little lower in yield but the real action is an exaggerated slide in WTI (which is rapidly heading towards a sub-$80 handle) and EURUSD which has dropped back to the day’s lows around 1.2660. Copper, Gold, and Silver are also sliding lower as AUD weakens (as we suggested last night) back to 1.0150.


Bed, Bath & Beyond Stock Plunges on Outlook

Shares of Bed, Bath & Beyond  fell 14% after the retailer said late Wednesday that it had surpassed expectations with 15% higher profit in the first quarter, but it broke from tradition with a downbeat outlook, middling same-store-sales growth and gross-margin contraction.


P&G admits errors and slows expansion

By Barney Jopson in New York and Duncan Robinson in London

Procter & Gamble vowed to halt its expansion into new markets and focus on the biggest emerging economies as it cut earnings and revenue forecasts and acknowledged it had overstretched.

Bob McDonald, chief executive for the past three years, admitted the company had made errors and should have produced better results. “We will continue to expand our developing market portfolio, but we will do it on a more balanced pace,” he told an investor conference in Paris.


IT ONLY TOOK A GLOBAL DEPRESSION TO REDUCE GAS PRICES BY 40 CENTS

You can’t watch the mainstream media propaganda channels for more than ten minutes without a talking head breathlessly announcing that gas prices have dropped for the 24th day in a row and are now back to $3.55 a gallon. Wall Street oil analysts, who are paid hundreds of thousands of dollars per year to tell us why prices rose or fell after the fact, are paraded on CNBC to proclaim the huge consumer windfall from the drop in price. This is just another episode of a never ending reality show, designed to keep the average American sedated so they’ll continue to spend money they don’t have buying crap they don’t need. The brainless twits that pass for journalists in the corporate mainstream media never give the viewer or reader any historical context to judge the true impact of the price increase or decrease. The government agencies promoting the storyline of those in power extrapolate the current trend and ignore the basic facts of supply, demand, price and peak oil. The EIA is now predicting further drops in prices. Two months ago they predicted steadily rising prices through the summer. What would we do without these government drones guiding us?

Inflation Adjusted Gasoline Prices (Monthly)

As you can see from the chart, gas prices tend to be volatile and unpredictable in the short term. You can also see that since 1998 the trend has been relentlessly higher. The average inflation adjusted price of gasoline in 1998 was $1.41 per gallon, versus $3.55 today, a 152% increase in fourteen years. Over this same time frame the BLS manipulated CPI was up only 44%. If we are swimming in oil, as the MSM pundits claim, why the tremendous surge in price? It must be those evil oil companies. It couldn’t possibly be the impact of peak oil. To acknowledge the fact that worldwide oil production has reached its peak would be to concede that our suburban sprawl, just in time world is drawing to an excruciating end. So the politicians spout their assigned storylines, supported by their paid off “experts” (aka Daniel Yergin), and unquestioningly reported as fact by their designated corporate media outlet. Those of a liberal bent assail oil companies and speculators; refuse to acknowledge the law of supply and demand, while touting green energy as the solution to all our energy needs. Those of a conservative bent believe in attacking foreign countries to secure “our” oil, refuse to acknowledge the law of supply and demand, and spout “drill, drill, drill” slogans because dealing with facts is inconvenient. The willfully ignorant public believes whichever storyline matches their preconceived beliefs. All is well – no one is required to think critically. Thinking is hard.

There are numerous factors that affect the price of oil on a daily basis, but at the end of the day supply and demand determine price. The chart below documents the key external events that have had a major impact on oil prices since 1970. The vital fact that you won’t hear on CNBC is that every recession since 1970 has been immediately preceded by an oil price spike. Anyone living in the real world (this excludes Cramer, Liesman, Bartiromo, & Kudlow) knows we have entered part two of the Greater Depression. The surge in oil prices in the last two years has precipitated this renewed downturn.

The MSM blathering baboons of bullshit dutifully report the price of gas on a given day. People who live in the real world fill up their gas tanks every week, so the average price over a period of time is what matters. The average price of a gallon of gasoline in 2008 was $3.39. The average price in 2011 was $3.48. The average price in 2012 has been $3.62 thus far. This data paints an entirely different picture than the one painted by the politicians, experts and the clueless captured media. Gas prices are higher than they were prior to the last economic implosion. Cause and effect is a concept beyond the intellectual capabilities of MSM journalists and the millions of government educated zombies they mesmerize with misinformation. The lack of intellectual curiosity and critical thinking skills plays directly into the hands of those with a storyline to sell or truth to obscure.

Swimming in Oil

The recent storyline proliferated by the MSM at the behest of Washington DC politicians and the corporate interests that control them, is that the U.S. is on the verge of energy independence, with hundreds of years of plentiful oil right under our feet. The chart below made the rounds last week on Bloomberg, defender and mouthpiece of billionaires everywhere. This chart surely proves that peak oil is bullshit. Right?

Besides the false representation of oil production and the misleading conclusion that we have more oil than we need, the chart and Bloomberg screed does not provide the true context of why worldwide demand is tumbling. The chart is NOT showing global crude oil production. It is showing global oil and other liquids supply, which includes crude and condensate, natural gas plant liquids, other liquids (mostly ethanol), and processing gains (increase in volume from refining heavy oil). The MSM would rather mislead the public than provide the true picture of the supposed oil production boom. The question is whether the MSM is misleading the public due to their own journalistic incompetence or are they carrying out their assigned mission on behalf of the corporate oligarchs running the kingdom.

The chart below reveals a truer picture of the worldwide energy situation. Conventional oil production hit its peak/plateau around 74 million barrels per day at the end of 2004, and has barely budged from that level over the last eight years. Despite all the rhetoric about the North American oil boom, conventional oil production is at virtually the same level today as it was in 2004. The U.S.(shale oil) and Canadian (tar sands) gains in production have been matched by the collapse in Mexican production. The Middle East countries produced 23.3 million barrels in September 2004. The average price of a barrel of oil in 2004 was $38. They are now only producing 23.9 million barrels when prices are 120% higher.

World Oil and Other Liquids Supply

Global oil demand in 2004 was around 84 million barrels per day. To increase liquid fuel supply to meet the 90 million barrels per day demand we had to turn to unconventional fuels like tar sands, tight oil, and biofuels, all of which have far higher production costs and far less energy content than sweet crude. As the easy to access, cheap to produce ($20 per barrel in Saudi Arabia), close to the surface sweet crude has been depleted, it has been replaced by heavy crude, tar sands, deep-water oil, and shale oil, with production costs in excess of $80 per barrel. Anyone anticipating a long-term decline in fuel prices must be smoking tar sands in their bong. The liquids that have “replaced” conventional crude have a few slight drawbacks. Natural gas liquids provide about 70% as much energy per barrel as crude oil, so a barrel of NGL is not equivalent to a barrel of crude. Have you filled up your SUV lately with some NGL? Ethanol provides only 60% as much energy per barrel as crude oil and its EROEI is pitifully low. The energy returned on energy invested for these non-conventional sources of energy approaches the minimum limits unless prices rise dramatically. The Obama green army does not want this chart making its way into the public discourse. Their fantasyland of renewable energy solutions is proven to be a fool’s errand.

Catch-22 Energy Edition

The price of a barrel of West Texas crude is currently $86 per barrel, down from $109 per barrel in February. Obama supporters will proclaim that his threat to crack down on speculators had the desired effect. He must have scared those nasty speculators with his gravitas. The price rise surely didn’t have anything to do with the U.S. led attack on Libya, the act of war economic sanctions on Iran, the beating of Israel/U.S. war drums, Japan demand due to the shutdown of their nuclear power industry, or the relentlessly higher demand from China and India. And now the MSM is trying to spin a yarn that prices have dropped by 21% because worldwide supply is surging. That is so much more palatable than telling the truth and admitting that we’ve entered the 2nd phase of the Greater Depression.

It took $140 a barrel in oil in 2008 to tip the world into recession. Worldwide economies were much stronger then. The U.S. National Debt has risen by $6.5 trillion, or 70% since 2008. Real GDP has risen by $200 billion since 2008, or a 1.5% increase. Debt to GDP has risen from 64% to 102%. Consumer debt at $2.55 trillion is exactly the same as the 2008 level even after Wall Street banks have written off over $1 trillion, subsidized by the American taxpayer. The consumer deleveraging storyline is completely false. In 2008 there were 234 million working age Americans and 145 million of them were employed. Today there are 243 million working age Americans and 142 million of them are employed. In 2008 there were 28 million Americans in the food stamp program. Today there are 46 million Americans collecting food stamps. The economic situation in Europe has deteriorated at a far greater rate. Therefore, it is not surprising that it only took $109 a barrel oil to push the world back into recession.

The main reason prices are dropping is the collapse in demand from Europe and the United States. The bumpy plateau of peak oil is in full force. Prices rise to the point where they push economies into recession, demand crashes due to the recession, and prices decline. The double whammy of oil prices reaching $111 a barrel in 2011 and $109 a barrel in 2012 have sapped the life out of the American consumer. This is reflected in the plunge in gasoline and petroleum usage since 2008, with a temporary leveling off in 2010, followed by a further nosedive since 2011. As this recession deepens over the next six months, prices will likely fall further. But this is where the Catch-22 kicks in.

Once prices drop below $80 a barrel it sets in motion a reduction in capital investment, as new production projects are not economically feasible below $80 per barrel. Oil analyst Chris Nedler explains the Catch-22 aspect of oil prices in a recent article:

Research by veteran petroleum economist Chris Skrebowski, along with analysts Steven Kopits and Robert Hirsch, details the new costs: $40 – $80 a barrel for a new barrel of production capacity in some OPEC countries; $70 – $90 a barrel for the Canadian tar sands and heavy oil from Venezuela’s Orinoco belt; and $70 – $80 a barrel for deep-water oil. Various sources suggest that a price of at least $80 is needed to sustain U.S. tight oil production.

Those are just the production costs, however. In order to pacify its population during the Arab Spring and pay for significant new infrastructure projects, Saudi Arabia has made enormous financial commitments in the past several years. The kingdom really needs $90 – $100 a barrel now to balance its budget. Other major exporters like Venezuela and Russia have similar budget-driven incentives to keep prices high.

Globally, Skrebowski estimates that it costs $80 – $110 to bring a new barrel of production capacity online. Research from IEA and others shows that the more marginal liquids like Arctic oil, gas-to-liquids, coal-to-liquids, and biofuels are toward the top end of that range.

My own research suggests that $85 is really the comfortable global minimum. That’s the price now needed to break even in the Canadian tar sands, and it also seems to be roughly the level at which banks and major exploration companies are willing to commit the billions of dollars it takes to develop new projects.

Oil prices may temporarily drop below $80, but prices below that level for a prolonged period will lead to supply being constricted, which will ultimately lead to higher prices. The storyline of hundreds of years of Bakken shale oil that will make the U.S. energy independent is the latest fiction to be peddled by the oligarchs as a way to sedate and confuse the masses.

What the Frack

U.S. oil production in 2007 averaged 8.5 million barrels per day. Today, the U.S. is producing 10.7 million barrels per day. We must have hit the jackpot. Not quite. Actual crude oil production has increased by 1 million barrels per day, a 20% increase. The other 1.2 million barrels have been from liquefied natural gas (up 34%) and government subsidized ethanol (up 100%).

The U.S. crude oil production is at the same level it was in 1998, but somehow we are on the verge of becoming energy independent. The recent increase is solely due to the horizontal drilling and hydraulic fracturing of shale deposits in Texas and North Dakota. You don’t hear much about Alaskan production declining for the ninth year in a row and California production declining to the lowest level in three decades. The paid shills predicting Bakken production of 3 million barrels per day are purposely lying or just plain delusional.

North Dakota oil production has reached 550,000 barrels per day versus 187,000 barrels per day in 2009. Simpletons in the MSM will just extrapolate this growth to 3 million barrels by 2020. No need to examine the facts. Oil market expert Tom Whipple reveals the dirty secrets behind the Bakken shale oil miracle:

It took the production from 6,617 wells to produce North Dakota’s 546,000 b/d in January. Divide the daily production by the number of wells and you get an astoundingly low 82 b/d from each well. I say “astounding” because a good new offshore well can do 50,000 b/d. BP’s Macondo well which exploded in the Gulf a couple of years ago was pumping out an estimated 53,000 b/d before it was capped.

Now a North Dakota shale oil well is not in the cost class of a deep-water offshore platform which can run into the billions, but they do cost about three times as much as a classic onshore oil well as they first must be drilled down 11,000 feet and then 10,000 horizontally through the oil bearing layer before the fracturing of the rock can take place. The “fracking” involves at least 15 massive pumps that inject water and other chemicals into the well. Take a Google Earth flight over northwestern North Dakota. The fracked wells are hard to miss as there are now about 9,000 of them and they are each the size of a football field.

There is still more — fracked wells don’t keep producing very long. Although a few newly fracked wells may start out producing in the vicinity of 1,000 barrels a day, this rate usually falls by 65 percent the first year; 35 percent the second; and another 15 percent the third. Within a few years most wells are producing in the vicinity of 100 b/d or less which is why the state average for January is only 82 b/d despite the addition of 1300 new wells in 2011.

The rapid depletion of these wells, enormous expense to drill new wells, oil prices barely above cost of production, low EROEI, swiftly falling Alaskan and shallow water production, and the snail’s pace of deep water production are not a recipe for energy independence. Shale oil production will never exceed 1 million barrels per day. And if you believe Saudi Arabia’s promises to fulfill any shortfalls, I’ve got some delightful beachfront property in Afghanistan to sell you. Saudi conventional crude oil production is at the same level it was in 2005.

Saudi Arabia Oil Production

The seven year Saudi plateau is just a precursor to what is going to happen over the next decade. Saudi Arabia began pumping oil in 1945. It will all be gone by 2045. You can’t extract an infinite amount of oil from a finite world. Pretending this isn’t true won’t make it so. Oil has been the lifeblood of our nation since the late 1800s. The depletion of this essential ingredient of the modern world will not lead to a sudden death for our way of life but a slow downward spiral of waning supply, escalating prices, and economic decay.

The sustained high and rising oil prices will be economically destructive as our debt saturated, suburban sprawl, mall centric, SUV crazed, cheap oil dependent society methodically and agonizingly implodes. Chris Skrebowski describes our future succinctly:

“Unless and until adaptive responses are large and fast enough to constrain the upward trend of oil prices, the primary adaptive response will be periodic economic crashes of a magnitude that depresses oil consumption and oil prices.”

We’ve entered one of these periodic economic crashes. They are coming faster and faster. So enjoy that 40 cent drop in gas prices as you drive down to sign up for food stamps. The Saudis have a saying that acknowledges their luck in being born on top of billions of barrels of oil and the inevitability of its depletion:

“My father rode a camel, I drive a car, my son flies a jet plane, his son will ride a camel.”   

Delusional Americans believe they have a right to cheap plentiful oil forever. They refuse to acknowledge that luck has played the major part in their rise to economic power. The American saying will be:

My great grandfather rode a horse, my grandfather drove a Model T, my father drove a Buick, I leased a Cadillac Escalade, my son died in the Middle East fighting for my oil, his son will never be born.  

order non hybrid seeds

SIGNS OF RECESSION

Charles Hugh Smith with a couple of on the ground observations that we are in recession. I detailed my on the ground observation about the two strip malls near my house going almost completely dark in the last two years. My on the ground observation regarding how the powers that be have been able to disguise this recession is made every morning as I drive through the mean streets of West Philly. I drove past the Mantua Square low income housing mecca this morning and observed four brand new cars with the registration sticker still in the back window parked in front of these $250,000 low income housing units. This is a neigborhood where the average household income is $16,000 and there are brand new $30,000 automobiles parked everywhere. My guess is that 80% of the “INCOME” in this neighborhood is a direct transfer from the taxpayer into the bank accounts of these fine upstanding citizens. How in God’s name can these people afford to buy brand new cars? How in God’s name can an automobile dealer sell these people cars on credit?

This is where Bennie, his printing press, Obama, and Wall Street are colluding to keep the balls in the air for a little while longer. Anyone with an ounce of brains knows these people should not have access to brand new cars bought with credit. Obama is funneling hundreds of billions to these people and Bennie and Wall Street are providing easy credit to people who should never have access to easy credit. The result is an illusion of normalcy, when in reality they are setting the country up for an even greater collapse than 2008. The signs of recession are everywhere. The signs of blatant fraud, manipulation and stupidity require some critical thought and observation.

A final unrelated point regarding Mantua Square – Is it too much to ask that since these people are getting free housing, welfare, free heat, food stamps, and new cars courtesy of the U.S. taxpayer, could they at least pick up the trash and debris that litter their front lawns. You have this beautiful complex amid tremendous squalor and they can’t even walk out their front door and pick up the trash? I’m starting to lose my faith in humanity.

Let’s hear your on the ground examples of recession. 


What’s Your Favorite “On the Ground” Recession Indicator?

February 28, 2012    

Beautifully maintained trophy cars are being dumped for cash. What does that say about the “real” economy?

Everybody has their own “on the ground” recession indicators:the mall parking lot, the tony restaurant that used to be packed every weekend, and so on.

I have two favorites: freight trains rumbling south down the main line of the West Coast and “sell your own car” used car lots.

The freight trains are self-explanatory: at the top of the housing bubble, they were loaded with flatcars of lumber. Now? A lot of empty flatcars and container flats. A lot. Yes, the official statistics indicate rising rail traffic, but they must mean one more car has a load in a 100-car train and there’s only 20 empties. The freight trains I see are still running with beaucoup empty cars.

There may be some explanation of why this is so, but I can report that these trains pulled no empties in 2007.

“Sell your own car” lots reflect the “private market” for used cars.If you want to know what people are trading in for new cars, then go look at new car dealers’ used lots. At the local Honda dealer, I saw a number of Lexus SUVs on their used lot; people trading down to save on gasoline?

I’ve sold a few cars myself at the local “sell your own car” lot, so I know it’s reputable and a model that works for buyers and sellers.For a flat fee, you park your car on their lot and price it however you want. Potential buyers get to test-drive it, take it to their mechanic, etc. It’s a big lot, so the selection of cars and prices is suggestive of larger trends–at least to me.

Back in 2009 at the initial depths of the recession, the used Toyotas and Hondas vanished and the lot filled with Volvos and other big-car-payment brands. I took this to reflect people were ditching their car payments and snapping up older reliable cars they could buy for cash and get another 100,000 miles out of.

I hadn’t been by the lot in a while and what I saw astonished me.The lot was packed with “fun” cars and luxury brands: four recent-vintage Cooper-Minis were lined up (none sold in the week I monitored the lot). A cute yellow VW Beetle–another “fun” car– was over by the Mercedes. Yes, Mercedes, and Porsches, all beautfully maintained.

For the first time in the two decades I’ve scanned this lot, it was chockful of luxury cars:a pristine black 2002 Porsche Boxter with low mileage that raised my blood pressure and sorely tempted me because it was “priced to sell”–and for a Scots-Irish-French tightwad, that’s saying something; an equally beautiful Mercedes 500-series two seater, low mileage, brand-new in appearance; a fairly decent Jaguar; another pristine 300-series Mercedes, a classic, unbelievably well-maintained Porsche 911 (1991)– the list goes on.

In the good old days, these “still look new” luxury cars would have been snapped up at these prices. But now they sit here, unsold, day after day.

Another class of “fun” car was also represented–the muscle car: a very clean recent vintage red Trans Am attracted onlookers in one corner of the lot.

Sellers can add comments to the sales tag, and on at least two of the luxury vehicles it was noted that the car had been their father’s, one owner. Others indicated the original owner was selling.

If you know some car buffs, or you are one, then you know what these low-mileage super-clean luxury cars represent: they represent the lifetime achievement car for a guy, or the trophy car the rising exec takes out on the weekend. There is no other explanation for a 10-year old car to have 17,000 miles, or 33,000 miles–they were all garaged and enjoyed as a third or fourth car.

It seems Dad is getting too old to drive, or it’s no longer feasible to ease into the low-slung Porsche, and so he’s given it to one of his kids. And the kid drove it to the lot to turn into cold hard cash.

As for the “fun” cars: maybe they’re still selling big numbers of new vehicles, but the glow of owning a mediocre-mileage car with no room for the dog or kids seems to be fading for existing owners. My sister-in-law spent a fortune having her Mini Cooper fixed last year, and our friend with a cutsy VW Beetle had a repair bill after a few years of ownership that could have bought a decent used car instead.

For whatever reason, “fun” cars that I never saw on the lot before are now there in abundance.

This is all anecdotal, of course, and wide open to interpretation. If you go to the techie-hipster favored neighborhoods in San Francisco, the tony cafes and restaurants are crowded: there’s plenty of Web 2.0 money floating around. If you only look at these concentrations of talent and free-flowing investment capital, the economy looks like it’s booming. Ditto if you try to book a table near the Opera on performance night: there’s plenty of old money around that can spend $100 per dinner, too.

Once again, there were no older Toyotas or Hondas on the lot, only a few 2-year old models asking near-new prices. I interpret this thusly: older reliable cars that will last another five years without major expense are snapped up immediately, and superfluous “fun” cars and luxury trophy vehicles are being turned into cash.

When people are driving their pride and joy cars out of their pampered garages and selling them for cash, not trading them in for a new car or keeping them for pleasure, I think that’s saying something about the “real” economy you won’t find if you hang around Twitter HQ or the bejeweled Opera crowd.

You may intepret it differently, of course. That’s the beauty of “on the ground” recession indicators.


EXTEND & PRETEND COMING TO AN END

The real world revolves around cash flow. Families across the land understand this basic concept. Cash flows in from wages, investments and these days from the government. Cash flows out for food, gasoline, utilities, cable, cell phones, real estate taxes, income taxes, payroll taxes, clothing, mortgage payments, car payments, insurance payments, medical bills, auto repairs, home repairs, appliances, electronic gadgets, education, alcohol (necessary in this economy) and a countless other everyday expenses. If the outflow exceeds the inflow a family may be able to fund the deficit with credit cards for awhile, but ultimately running a cash flow deficit will result in debt default and loss of your home and assets. Ask the millions of Americans that have experienced this exact outcome since 2008 if you believe this is only a theoretical exercise. The Federal government, Federal Reserve, Wall Street banks, regulatory agencies and commercial real estate debtors have colluded since 2008 to pretend cash flow doesn’t matter. Their plan has been to “extend and pretend”, praying for an economic recovery that would save them from their greedy and foolish risk taking during the 2003 – 2007 Caligula-like debauchery.

I wrote an article called Extend and Pretend is Wall Street’s Friend about one year ago where I detailed what I saw as the moneyed interest’s master plan to pretend that hundreds of billions in debt would be repaid, despite the fact that declining developer cash flow and plunging real estate prices would make that impossible. Here are a couple pertinent snippets from that article:

“A systematic plan to create the illusion of stability and provide no-risk profits to the mega-Wall Street banks was implemented in early 2009 and continues today. The plan was developed by Ben Bernanke, Hank Paulson, Tim Geithner and the CEOs of the criminal Wall Street banking syndicate. The plan has been enabled by the FASB, SEC, IRS, FDIC and corrupt politicians in Washington D.C. This master plan has funneled hundreds of billions from taxpayers to the banks that created the greatest financial collapse in world history.

Part two of the master cover-up plan has been the extending of commercial real estate loans and pretending that they will eventually be repaid. In late 2009 it was clear to the Federal Reserve and the Treasury that the $1.2 trillion in commercial loans maturing between 2010 and 2013 would cause thousands of bank failures if the existing regulations were enforced. The Treasury stepped to the plate first. New rules at the IRS weren’t directly related to banking, but allowed commercial loans that were part of investment pools known as Real Estate Mortgage Investment Conduits, or REMICs, to be refinanced without triggering tax penalties for investors.

The Federal Reserve, which is tasked with making sure banks loans are properly valued, instructed banks throughout the country to “extend and pretend” or “amend and pretend,” in which the bank gives a borrower more time to repay a loan. Banks were “encouraged” to modify loans to help cash strapped borrowers. The hope was that by amending the terms to enable the borrower to avoid a refinancing that would have been impossible, the lender would ultimately be able to collect the balance due on the loan. Ben and his boys also pushed banks to do “troubled debt restructurings.” Such restructurings involved modifying an existing loan by changing the terms or breaking the loan into pieces. Bank, thrift and credit-union regulators very quietly gave lenders flexibility in how they classified distressed commercial mortgages. Banks were able to slice distressed loans into performing and non-performing loans, and institutions were able to magically reduce the total reserves set aside for non-performing loans.

If a mall developer has 40% of their mall vacant and the cash flow from the mall is insufficient to service the loan, the bank would normally need to set aside reserves for the entire loan. Under the new guidelines they could carve the loan into two pieces, with 60% that is covered by cash flow as a good loan and the 40% without sufficient cash flow would be classified as non-performing. The truth is that billions in commercial loans are in distress right now because tenants are dropping like flies. Rather than writing down the loans, banks are extending the terms of the debt with more interest reserves included so they can continue to classify the loans as “performing.” The reality is that the values of the property behind these loans have fallen 43%. Banks are extending loans that they would never make now, because borrowers are already grossly upside-down.”

Master Plan Malfunction

You have to admire the resourcefulness of the vested interests in disguising disaster and pretending that time will alleviate the consequences of their insatiable greed, blatant criminality and foolish risk taking. Extending bad loans and pretending they will be repaid does not create the cash flow necessary to actually pay the interest and principal on the debt. The chart below reveals the truth of what happened between 2005 and 2008 in the commercial real estate market. There was an epic feeding frenzy of overbuilding shopping centers, malls, office space, industrial space and apartments. During the sane 1980’s and 1990’s, commercial real estate loan issuance stayed consistently in the $500 billion to $700 billion range. The internet boom led to a surge to $1.1 trillion in 2000, with the resultant pullback to $900 billion by 2004. But thanks to easy Al and helicopter Ben, the bubble was re-inflated with easy money and zero regulatory oversight. Commercial real estate loan issuance skyrocketed to $1.6 trillion per year by 2008. Bankers sure have a knack for doing the exact opposite of what they should be doing at the exact wrong time. They doled out a couple trillion of loans to delusional developers at peak prices just prior to a historic financial cataclysm.

The difference between bad retail mortgage loans and bad commercial loans is about 25 years. Commercial real estate loans usually have five to seven year maturities. This meant that an avalanche of loans began maturing in 2010 and will not peak until 2013. With $1.2 trillion of loans coming due between 2010 and 2013, disaster for the Wall Street Too Big To Fail banks awaited if the properties were valued honestly. A perfect storm of declining property values and plunging cash flows for developers should have resulted in enormous losses for Wall Street banks and their shareholders, resulting in executives losing not only their obscene bonuses but even their jobs. Imagine the horror for the .01%.

The fact is that commercial property prices are currently 42% below the 2007 – 2008 peak. The slight increase in the national index is solely due to strong demand for apartments, as millions of Americans have been kicked out of their homes by Wall Street bankers using fraudulent loan documentation to foreclose on them. The national index has recently resumed its fall. Industrial and retail properties are leading the descent in prices according to Moodys. The master plan of extend and pretend was implemented in 2009 and three years later commercial real estate prices are 10% lower, after the official end of the recession.

Part one of the “extend and pretend” plan has failed. Part two anticipated escalating developer cash flows as the economy recuperated, Americans resumed spending like drunken sailors and retailers began to rake in profits at record levels again. Reality has interfered with their desperate last ditch gamble. Office vacancies remain at 17.3%, close to 20 year highs, as 12.3 million square feet of new space came to market in 2011. Vacancies are higher today than they were at the end of the recession in December 2009. The recovery in cash flow has failed to materialize for commercial developers. Strip mall vacancies at 11% remain stuck at 20 year highs. Regional mall vacancies at 9.2% linger near all-time highs. Vacancies remain elevated, with no sign of decreasing. Despite these figures, an additional 4.9 million square feet of new retail space was opened in 2011. The folly of this continued expansion will be revealed as bricks and mortar retailers are forced to close thousands of stores in the next five years.

It is clear the plan put into place three years ago has failed. Extending and pretending doesn’t service the debt. Only cash flow can service debt.

Now What?

Extending and pretending that hundreds of millions in commercial loans were payable for the last three years is now colliding with a myriad of other factors to create a perfect storm in 2012 and 2013. The extension of maturities has now set up a far more catastrophic scenario as described by Chris Macke, senior real estate strategist at CoStar Group:

“As banks and property owners continue to partake in loan extensions amid a softening economy, commercial banks continue to “delay and pray” that property values will rise. Many loans are piled up and concentrated in this year, and at the same time, the economy is slowing. This dilemma has resulted in the widening of what is commonly termed the “loan maturity cliff,” which is attributed to the so called extend-and-pretend loans. During the market downturn, lenders extended the maturity dates of loans with properties that had current values below their balances. Instead, however the practice has resulted in a race for property values to try to catch up with the loan maturity dates.”

The Federal Reserve, Wall Street banks, Mortgage Bankers Association and the rest of the confederates of collusion will continue the Big Lie for as long as possible. They point to declining commercial default rates as proof of improvement. The chart below details the 4th quarter default rates for real estate loans over the last six years. Default rates in the 4th quarter of 2009 peaked for all real estate loan types. Still, today’s default rate is 450% higher than the rate in 2006. A critical thinker might ask how commercial default rates could fall from 8.75% to 6.12% when commercial vacancies have increased and commercial property values have fallen. It’s amazing how low default rates can fall when a bank doesn’t require payments or collateral to back up the loan and can utilize accounting gimmicks to avoid write-offs.


Real estate loans

All

Booked in domestic offices

Residential 

Commercial 

Farmland

2011:4

8.22

9.86

6.12

3.26

2010:4

9.07

10.11

7.98

3.61

2009:4

9.55

10.45

8.75

3.43

2008:4

6.03

6.64

5.49

2.28

2007:4

2.90

3.07

2.75

1.51

2006:4

1.70

1.95

1.32

1.41

The reality as detailed by honest analysts is much different than the numbers presented by Ben Bernanke and his banker cronies. A recent article from the Urban Land Institute provides some insight into the current state of the market:

 Ann Hambly, who previously ran the commercial servicing departments at Prudential, Bank of New York, Nomura, and Bank of America said a wave of defaults is coming in commercial mortgage–backed securities (CMBS). And Carl Steck, a principal in MountainSeed Appraisal Management, an Atlanta-based firm that deals in the commercial real estate space, said property values are still falling.

Noting that CMBS investors booked $6 billion in real losses in 2011 and have already taken on $2 billion more in losses so far this year, Hambly told reporters in a private briefing that “it’s going to take a miracle” for many borrowers to refinance their deals when they come due between now and 2017.

Carl Steck said that lenders who are taking over the portfolios of failed institutions are finding that the values of the loans “are coming in a lot lower than they ever thought they would.” And as a result, he thinks a “fire sale” of commercial loans is just over the horizon.

Analysts expect 2012 to be a record-setting year for commercial real estate defaults. Last week delinquencies for office and retail loans hit their highest-ever levels, according to Fitch Ratings. The value of all delinquent commercial loans is now $57.7 billion, according to Trepp, LLC. If you think the criminal Wall Street banks limited their robo-signing fraud to just poor homeowners, you would be mistaken. The fraud uncovered in the commercial lending orbit will dwarf the residential swindle. Research by Harbinger Analytics Group shows the widespread use of inaccurate, fraudulent documents for land title underwriting of commercial real estate financing. According to the report:

This fraud is accomplished through inaccurate and incomplete filings of statutorily required records (commercial land title surveys detailing physical boundaries, encumbrances, encroachments, etc.) on commercial properties in California, many other western states and possibly throughout most of the United States. In the cases studied by Harbinger, the problems are because banks accepted the work of land surveyors who “have committed actual and/or constructive fraud by knowingly failing to conduct accurate boundary surveys and/or failing to file the statutorily required documentation in public records.”


Your Ad Here

The Wall Street geniuses bundled commercial real estate mortgages and re-sold them as securities around the world. The suckers holding those securities, already staggering from the overabundance of empty office space, will be devastated if it turns out they have no claim to the properties. They will rightly sue the lenders for falsely representing the properties. Mortgage holders in these cases may also turn to their title insurance to cover any losses. It is unknown if the title insurance companies have the wherewithal to withstand enormous claims on costly commercial properties. It looks like that light at the end of the tunnel is bullet train headed our way.

One of the fingers in the dyke of the “extend and pretend” dam has been removed by the FASB. The new leak threatens to turn into a gusher.


Andy Miller, cofounder of Miller Frishman Group, and one of the few analysts who saw the real estate crash coming two years before it surprised Bernanke and the CNBC cheerleaders sees a flood of defaults on the horizon. In a recent interview with The Casey Report Miller details a dramatic turn for the worse in the commercial real estate market he has witnessed in the last few months. His company deals with distressed commercial real estate. This segment of his business was booming in 2009 and into the middle of 2010. Then magically, there was no more distress as the “extend and pretend” plan was implemented by the governing powers. The distressed market dried up completely until November 2011. Miller describes what happened next:

“All of a sudden, right after Thanksgiving in 2011, the floodgates opened again. In the last six weeks we probably picked up seven or eight receiverships – and we’re now seeing some really big-ticket properties with major loans on them that have gone into distress, and they’re all sharing some characteristics in common. In 2008 and 2009, these borrowers were put on a workout or had a forbearance agreement put into place with their lenders. In 2009, their lenders were thinking, “Let’s do a two- or three-year workout with these guys. I’m sure by 2012 this market is going to get a lot better.” Well, 2012 is here now, and guess what? It’s not any better. In fact I would argue that it’s still deteriorating.”

Why the sudden surge in distressed properties coming to market in late 2011? It seems the FASB finally decided to grow a pair of balls after being neutered by Bernanke and Geithner in 2009 regarding mark to market accounting. They issued an Accounting Standards Update (ASU) that went into effect for all periods after June 15, 2011called Clarifications to Accounting for Troubled Debt Restructurings by Creditors. Essentially, if a lender is involved in a troubled debt restructuring with a debtor, including a forbearance agreement or a workout, the property MUST be marked to market. Andy Miller understands this is the beginning of the end for “extend and pretend”:

“I believe it’s a huge deal because it means you don’t have carte blanche anymore to kick the can down the road. After all, kicking the can down the road was a way to avoid taking a big hit to your capital. Well, you can’t do that anymore. It forces you to cut through the optical illusions by writing this asset to its fair market value.”

Ben Bernanke and the Wall Street banks are running out tricks in their bag of deception. Wall Street banks created billions in profits by using accounting entries to reduce their loan loss reserves. They’ve delayed mortgage foreclosures for two years to avoid taking the losses on their loan portfolios. They’ve pretended their commercial loan portfolios aren’t worth 50% less than their current carrying value. Bernanke has stuffed his Federal Reserve balance sheet with billions in worthless commercial mortgage backed securities. The Illusion of Recovery is being revealed as nothing more than a two bit magician’s trick. In the end it always comes back to cash flow. The debt cannot be serviced and must be written off. Thinking the American consumer will ride to the rescue is a delusional flight of the imagination.

Apocalypse Now – The Future of Retailers & Mall Owners


When I moved to my suburban community in 1995 there were two thriving shopping centers within three miles of my home and a dozen within a ten mile radius. Seventeen years later the population has increased dramatically in this area, and these two shopping centers are in their final death throes. The shopping center closest to my house has a vacant Genuardi grocery store(local chain bought out and destroyed by Safeway), vacant Blockbuster, vacant Sears Hardware, vacant Donatos restaurant, vacant book store, and soon to be vacant Pizza Pub. It’s now anchored by a near bankrupt Rite Aid and a Dollar store. This ghost-like strip mall is in the midst of a fairly thriving community. Anyone with their eyes open as they drive around today would think Space Available is the hot new retailer. According to the ICSC there are 105,000 shopping centers in the U.S., occupying 7.3 billion square feet of space. Total retail square feet in the U.S. tops 14.2 billion, or 46 square feet for every man, woman and child in the country. There are more than 1.1 million retail establishments competing for every discretionary dollar from consumers.

Any retailer, banker, politician, or consumer who thinks we will be heading back to the retail glory days of 2007 is delusional. Retail sales reached a peak of $375 billion per month in mid 2008. Today, retail sales have reached a new “nominal” peak of $400 billion per month. Even using the highly questionable BLS inflation figures, real retail sales are still below the 2008 peak. Using the inflation rate provided by John Williams at Shadowstats, as measured the way it was in 1980, real retail sales are 15% below the 2008 peak. The unvarnished truth is revealed in the declining profitability of major retailers and the bankruptcies and store closings plaguing the industry. National retail statistics and recent retailer earnings reports paint a bleak picture, and it’s about to get bleaker.

Retail sales in 1992 totaled $2.0 trillion. By 2011 they had grown to $4.7 trillion, a 135% increase in nineteen years. A full 64% of this rise is solely due to inflation, as measured by the BLS. In reality, using the true inflation figures, the entire increase can be attributed to inflation. Over this time span the U.S. population has grown from 255 million to 313 million, a 23% increase. Median household income has grown by a mere 8% over this same time frame. The increase in retail sales was completely reliant upon the American consumers willing to become a debt slaves to the Wall Street bank slave masters. It is obvious we have learned to love our slavery. Credit card debt grew from $265 billion in 1992 to a peak of $972 billion in September of 2008, when the financial system collapsed. The 267% increase in debt allowed Americans to live far above their means and enriched the Wall Street banking cabal. The decline to the current level of $800 billion was exclusively due to write-offs by the banks, fully funded by the American taxpayer.

Credit cards are currently being used far less as a way to live beyond your means, and more to survive another day. This can be seen in the details underlying the monthly retail sales figures. On a real basis, with inflation on the things we need to live like energy, food and clothing rising at a 10% clip, retail sales are declining. Gasoline, food and medicine are the drivers of retail today. The surge in automobile sales is just another part of the “extend and pretend” plan, as Bernanke provides free money to banks and finance companies so they can make seven year 0% interest loans to subprime borrowers. Easy credit extended to deadbeats will not create the cash flow needed to repay the debt. The continued penetration of on-line retailers does not bode well for the dying bricks and mortar zombie retailers like Sears, JC Penny, Macys and hundreds of other dead retailers walking. With gas prices soaring, the economy headed back into recession and the Federal Reserve out of ammunition, Andy Miller sums up the situation nicely:

“Well, I think we’re headed into an economy right now where there’s just not a lot of upside. Do we think, for example, in the shopping center business, that retail and consumer spending is going to go way up? Certainly not. I think that as times get tougher and unemployment remains high, it’s going to have a negative impact on consumer spending. In almost in any city in America right now, it doesn’t take a genius to see how much retail space has been constructed and is sitting there empty. Vacancy rates are as high as I’ve seen them in almost every venue that I visit. I’m very concerned about the retail business, and I think it’s extremely dangerous right now.”

The major big box retailers have been reporting their annual results in the last week. The results have been weak and even those whose results are being spun as positive by the mainstream media are performing dreadfully compared to 2007. A few examples are in order:

  • Home Depot was praised for their fantastic 2011 result of $70 billion in sales and $6.7 billion of income. The MSM failed to mention that sales are $7 billion lower than 2007, despite having 18 more stores and profit exceeded $7.2 billion in 2007. Sales per square foot have declined from $335 to $296, a 12% decline in four years.
  • Target made $2.9 billion on revenue of $67 billion in 2011. $953 million of this profit was generated from their credit card this year versus $744 million last year because they reduced their loan loss reserve by $260 million. Target is supposedly a retailer, but 33% of their bottom line comes from a credit card they desperately tried to sell in 2009. They have increased their store count from 1,600 to 1,800 since 2007 and their profit is flat. Sales per square foot have declined from $307 to $280 since 2007.
  • J.C. Penney is a bug in search of a windshield. Their sales have declined from $20 billion in 2007 to $17 billion in 2011 despite increasing their store count from 1,067 to 1,114. Their profits have plunged from $1.1 billion to a loss of $152 million. Their sales per square foot have plunged by 14% since 2007. Turning to a former Apple marketing guru as their new CEO will fail. Everyday low pricing is not going to work on Americans trained like monkeys to salivate at the word SALE.
  • The death spiral of Sears/Kmart is a sight to see. As the anchor in hundreds of dying malls across the land, this retail artifact will be joining Montgomery Ward on the scrap heap of retail history in the next few years. Its eventual bankruptcy and liquidation will leave over 4,000 rotting carcasses to spoil our landscape. The one-time genius and heir to the Warren Buffett mantle – Eddie Lampert – has proven to be as talented at retailing as his buddy Jim Cramer is at picking stocks. He has managed to decrease sales by $10 billion, from $53 billion to $43 billion in the space of four years despite opening 247 new stores. That is not an easy feat to accomplish. At least he was able to reduce profits from $1.5 billion to $133 million and drive the sales per square foot in his stores down by 15%.
  • Widely admired Best Buy has screwed the pooch along with the other foolish retailers that have massively over expanded in the last decade. They have increased their domestic sales from $31 billion to $37 billion, a 19% increase in four years. This increase only required a 444 store expansion, from 873 stores to 1,317 stores. A 51% increase in store count for a 19% increase in sales seems to be a bad trade-off. Their chief competitor – Circuit City – went belly-up during this time frame, making the relative sales increase even more pathetic. The $6 billion increase in sales resulted in a $100 million decline in profits and a 13% decrease in sales per square foot since 2007. It might behoove the geniuses running this company to stop building new stores.
  • The retailer that committed the greatest act of suicide in the last decade is Lowes. Their act of hubris, as Home Depot struggled in the mid 2000’s, is coming home to roost today. They increased their store count from 1,385 to 1,749 over four years. This 26% increase in store count resulted in an increase in sales from $47 billion to $49 billion, a 4% boost. Profitability has plunged from over $3 billion to under $2 billion over this same time frame. They’ve won the efficiency competition by seeing their sales per square feet fall by an astounding 21% over the last four years. I’ve witnessed their ineptitude as they opened four stores within 10 miles of each other in Montgomery County, PA and cannibalized themselves to death. The newest store, three miles from my house, is a pleasure to shop as there is generally more staff than customers even on a Saturday afternoon. This beautiful new store will be vacant rotting hulk within three years.

Do the results of these retail giants jive with the retail recovery stories being spun by the corporate mainstream media? When you see some stock shill on CNBC touting one of these retailers, realize he is blowing smoke up your ass. These six struggling retailers account for over 1.1 billion square feet of retail space in the U.S. One or more of them anchor every mall in America. Wal-Mart (600 million square feet in the U.S.) and Kohl’s (82 million square feet) continue to struggle as their lower middle class customers can barely make ends meet. The perfect storm is developing and very few people see it coming. Extend and pretend has failed. Americans are tapped out. Home prices continue to fall. Energy and food prices continue to rise. Wages are stagnant. Job growth is weak. Middle and lower class Americans are using credit cards just to pay their basic living expenses. The 99% are not about to go on a spending binge.

As consumers reduce consumption, retailers lose profits and will be forced to close stores. It is likely that at least 150,000 retail stores will need to close in the next five years. Less stores means less rent for mall developers. Less rent means the inability to service their debt as the value of their property declines with the outcome of Ghost Malls haunting your community. Maybe good old American ingenuity will come to the rescue as we convert ghost malls into FEMA prison camps for uncharged Ron Paul supporters, Obamacare death panel implementation centers, TSA groping educational facilities, housing for the millions kicked out of their homes by the Wall Street .01%ers, and bomb shelters for the imminent Iranian invasion.

Debt default means huge losses for the Wall Street criminal banks. Of course the banksters will just demand another taxpayer bailout from the puppet politicians. This repeat scenario gives new meaning to the term shop until you drop. Extending and pretending can work for awhile as accounting obfuscation, rolling over bad debts, and praying for a revival of the glory days can put off the day of reckoning for a couple years. Ultimately it comes down to cash flow, whether you’re a household, retailer, developer, bank or government. America is running on empty and extending and pretending is coming to an end.


RECOVERY STORYLINE IS PURE BULLSHIT

John Hussman shoots dozens of holes in the MSM storyline of economic recovery and the avoidance of recession. If the economy is really recovering than why are Federal Reserve governors and the financial press talking about QE3 by the summer? You wouldn’t need more quantitative easing if the economy was really recovering. This is a long detailed analysis of why the storyline is pure bullshit. John is too professorial to say it in such a way, so I did it for him. These two paragraphs capture the gist of his article:

In sum, the balance of leading evidence continues to indicate a very high likelihood of an oncoming recession. We respect the various marginal improvements in the data in recent months, which do take the probability to less than 100%, but that is a far cry from suggesting that recession risk is anywhere close to being “off the table.” Recession is not a certainty, but it remains the most probable outcome at present.

Even if we allow for the possibility of improvement, my impression is that the potential outcomes for the market are very asymmetrical. Investors now expect pleasant, if gradual, economic progress, convinced by a stream of economic anecdotes in recent weeks. That hopeful expectation is already largely reflected in the overvalued, overbought, overbullish condition of the market. If the economy does in fact improve, we may observe further upside progress, but again – this is largely reflected in the advance that stocks have already enjoyed. The asymmetric risk is the potential for great disappointment if the economy does fall into a contraction – as well-correlated leading evidence continues to suggest.

Leading Indicators and the Risk of a Blindside Recession

John P. Hussman, Ph.D.

Over the past few weeks, investors used to setting their economic expectations based on a “stream of anecdotes” approach have seen their economic views evolve roughly as follows:

“After a brief ‘scare’ during the third quarter, economic reports have come in better than expectations for weeks – a sign that the economy is on a gradual but predictable growth path; Purchasing managers reports out of China and Europe have firmed, and the U.S. Purchasing Managers Indices have advanced, albeit in the low 50’s, but confirming a favorable positive trend, and indicating that the U.S. is strong enough to pull the global economy back to a growth path, or at least sidestep any downturn; New unemployment claims have trended gradually lower, and combined with a surprisingly robust December payroll gain of 200,000 jobs, provides a convincing signal that job growth is on track to improve further.”

I can understand this view in the sense that the data points are correct – economic data has come in above expectations for several weeks, the Chinese, European and U.S. PMI’s have all ticked higher in the latest reports, new unemployment claims have declined, and December payrolls grew by 200,000.

Unfortunately, in all of these cases, the inference being drawn from these data points is not supported by the data set of economic evidence that is presently available, which is instead historically associated with a much more difficult outcome. Specifically, the data set continues to imply a nearly immediate global economic downturn. Lakshman Achuthan of the Economic Cycle Research Institute (ECRI) has noted if the U.S. gets through the second quarter of this year without falling into recession, “then, we’re wrong.” Frankly, I’ll be surprised if the U.S. gets through the first quarter without a downturn.

Three basic issues are at play. One is that analysts aren’t making distinctions between leading, coincident and lagging data. The second issue is that there is little effort to measure the predictive strength of a given economic data point (or set of data points) in explaining subsequent movements in the economy. The third is that analysts seem to be forming expectations report-by-report (what I call a “stream of anecdotes” approach) instead of taking those reports in context of the full ensemble of data that is available at each point in time.

Let’s examine the seemingly most “compelling” data point first – the fact that December payrolls grew by 200,000. Surely that sort of jobs number is inconsistent with an oncoming recession. Isn’t it? Well, examining the past 10 U.S. recessions, it turns out that payroll employment growth was positive in 8 of those 10 recessions in the very month that the recession began. These were not small numbers. The average payroll growth (scaled to the present labor force) translates to 200,000 new jobs in the month of the recession turn, and about 500,000 jobs during the preceding 3-month period. Indeed, of the 80% of these points that were positive, the average rate of payroll growth in the month of the turn was 0.20%, which presently translates to a payroll gain of 264,000 jobs.

Likewise, in 5 of the past 10 recessions, the ISM Purchasing Managers Index was greater than 50 just weeks before the recession began, and the new orders component of that index was greater than 50 in most cases, immediately prior to the recession.

Very simply, neither a strong monthly employment gain nor a slight uptick in the PMI are informative signals that recession risk has eased. Both the PMI and the level of payroll job growth are what one might call “weak learners.” It’s not that these figures aren’t useful – just that neither of them has a particularly good record by itself of signaling recessions. As it happens, a PMI below 54, coupled with year-over-year payroll growth below 1.3% is a stronger “learner” than either of the two data points individually (see the 2007 comment Expecting A Recession ). That combination – which is actually alternate Condition 4 of our Recession Warning Composite – remains in place at present, as are the other conditions in that Composite. Our more complex ensemble models also indicate strong recession risk.

The chart below provides a good picture of the behavior of non-farm payroll growth in the months before and after a recession begins, based on all U.S. postwar recessions. Notice in particular that in the month a recession starts, payroll job growth has not only been positive in 80% of cases, but has actually been higher, on average, than the three preceding months. Neither the level of job growth nor its short-term trend had any “leading” information content at all about the subsequent direction of the economy.

Notably however, the month following entry into a recession typically featured a sharp dropoff in job growth, with only 30% of those months featuring job gains, and employment losses that work out to about 150,000 jobs based on the present size of the job force. So while robust job creation is no evidence at all that a recession is not directly ahead, a significant negative print on jobs is a fairly useful confirmation of the turning point, provided that leading recession indicators are already in place.

I’ve discussed the “positive surprises” argument (see When Positive Surprises are Surprisingly Meaningless ) and the negative implications of the European ISM, despite last month’s uptick (see The Right Kind of Hope ) in other recent comments. Suffice it to say that broadly speaking, the recent “surprises” in the data reflect minor fluctuations within overall levels that remain fairly tepid, and more importantly, that remain clearly unfavorable as an ensemble.

How to spot a leading indicator

I want to begin this section with a simple statement – I do not hope for a recession. Rather, that is the expectation that the data forces on us. Frankly, much of my time in recent weeks has been devoted to analyzing data in the hope that a more compelling case could be made for avoiding a recession, since that would free us to be more constructive should market internals improve. But that’s not what the evidence indicates here, and the recent economic data hasn’t reversed that conclusion – not yet at least. I like to think I do a good job of showing you the same things that I am seeing. I don’t challenge rosy outlooks because I enjoy being defensive – I don’t. In fact, I can hardly wait for market conditions where risk is priced appropriately. It’s just that Wall Street’s simplistic cases that stocks are cheap and recession is “off the table” just don’t hold water when we examine the data.

I’ve written a lot in recent months about the distinction between leading, coincident and lagging indicators. One of the ways to distinguish these is to calculate a whole set of correlations between an indicator and what it is intended to predict, using various leads and lags. If a given indicator is correlated with whether or not the economy was in a recession say, 6 months later, we would say that the indicator has a certain amount of usefulness as a “leading” indicator. In contrast, if a given indicator is correlated with whether or not the economy was in a recession say, 6 months previously, we would say that the indicator has a certain amount of usefulness as a “lagging” (or “confirming”) indicator. The stronger the correlation at a given point, the more useful that indicator is as a leading, coincident, or lagging indicator. Importantly, it is the strength of the correlation, not simply where the correlation curve peaks, that defines the usefulness of the indicator. [Geek’s note – it’s more elegant to do this work in the frequency domain, but correlations work nicely for the purposes here].

The chart below is a little bit busy, but presents the correlation profile of a variety of widely followed indicators, as well as an ensemble of recession indicators we track (see Measuring the Probability of Recession in the September 5 comment). In the chart below, month zero represents the start of a recession.

Notice that about 9 months prior to a recession, the Conference Board Leading Economic Indicators, the ECRI Weekly Leading Index and the 6-month change in the S&P 500 often show some weak leading characteristics, but the correlation is too small to make inferences very reliable. Advancing to about 6 months prior to a recession, a few more indicators begin to show a weak correlation with the oncoming recession, including our own ensembles, as well as the average of Fed surveys (such as Philly Fed and the Empire Manufacturing survey) and the ISM Purchasing Managers Index. Still, at that point, the correlations are typically fairly weak. Though none of these indicators are particularly good at anticipating a recession even 6 months out, the Conference Board Index of Leading Economic Indicators (LEI) has historically had a slight edge looking two quarters ahead (the LEI makes a very interesting study on its own here, so more on that below).

Once a recession is within three months away, the strongest leading indicators are our own ensemble and the ECRI Weekly Leading Index (though I expect that an ensemble of ECRI’s other indicators, such as the long-leading and coincident measures would, in combination, give an even stronger overall signal than the WLI alone). The 6-month change in the S&P 500 approaches its strongest correlation with an oncoming recession with only a 1-3 month lead, suggesting that investors wishing to anticipate recession-linked stock market weakness would want to focus on indicators have even better leading characteristics than stocks themselves.

Once a recession hits, our recession ensemble, the ECRI Weekly Leading Index, and the average of multiple Fed surveys have the strongest likelihood of confirming the downturn in real-time. Immediately following entry into the recession, as noted earlier, payroll growth tends to turn negative. Though recessions tend to be preceded by sub-par employment growth over the preceding 3-12 month period, the 3-month growth rate of payrolls actually acts as a bit of a lagging indicator, reaching its highest correlation with a recession – not surprisingly – about 3 months after the recession starts.

New claims for unemployment have very slight short-leading usefulness, but new claims, the unemployment rate, and the slope of the yield curve (flattening) actually have much better lagging characteristics, so these should be used primarily to confirm an ongoing recession (particularly if the NBER hasn’t made an official determination yet), rather than to anticipate a downturn. The yield curve generally flattens significantly coming into a recession, but the change in the yield curve (not plotted) is also most useful as a lagging indicator. Consumer confidence has mixed characteristics, with weak leading characteristics and somewhat greater usefulness as a lagging indicator, but in any case is too much of a “weak learner” to be used in isolation.

At present, our own recession ensembles, as well as ECRI’s official views, remain firmly entrenched in the recession camp. This feels more than a little bit disconcerting, as the entire investment world appears to have the opposite view. My problem is that the data don’t support that rosy “U.S. leads the world off the recession track” scenario. Leading data leads. Lagging data lags. Weak data is weak data. To anticipate a sustained economic upturn here would require us to place greater weight on weak, lagging data than we presently place on strong leading data. It’s really that simple. If the evidence turns, we will shift our view – and frankly with some amount of relief. At present, though, we continue to expect a concerted economic downturn.

The LEI and monetary bias

One of the interesting aspects of present conditions is the apparent disconnect between the Conference Board’s index of leading economic indicators and the ensemble of other economic indicators that we follow (including ECRI’s indices). The LEI is a composite of 10 measures, including the average workweek, jobless claims, new consumer orders, capital equipment orders, vendor deliveries, building permits, consumer expectations, stock prices, the yield curve, and real M2 money supply.

What’s problematic here is that close to half of the weight in the index goes to the two monetary components – the yield curve, and real M2. I suspect that this is a legacy of inflationary business cycles where monetary tightening in response to inflation was the typical event preceding recessions, but it adds noise in the present environment, where the primary economic risks are related to leverage and credit strains. Remember that at present, monetary policy is way out on the “liquidity preference” curve, to an extent that is historically unprecedented (see Monetary Policy in 3D ). Normally, there is a general, if weak, linear relationship between monetary variables, interest rates and economic activity. But given the current scope of monetary policy, M2 velocity has collapsed (and moves as a perfect inverse of M2 itself), and interest rates are at the zero bound, so these variables are essentially detached from economic activity. So you’ve got two highly weighted variables in the index that have gone almost perfectly horizontal with respect to their effect on the economy. The crisis in Europe has triggered a flight of time deposits from European banks to U.S. banks, which shows up as a further boost to M2, which has driven much of the advance in the LEI.

Notably, the Conference Board announced last week that they will replace real M2 with a new “Leading Credit Index” component, among other changes, which will be reflected in the January 2012 release.

That change makes sense. If you’re going to put nearly half of your weight on monetary variables, it’s really only sensible if about half of your predictive power resides in those two variables, but in the case of the LEI, that’s not true at all. Below, I’ve weighted the present components of the LEI in proportion to their correlation with subsequent recessions (using a 6-month smoothed growth rate for the non-stationary ones such as stock prices, capital orders and so forth, and standardizing the values of each to have zero mean and unit variance prior to weighting). The chart also presents the simple average of the non-monetary components of the LEI, as well as the smoothed growth rate of the actual published index, similarly scaled.

Notice that unlike the typical behavior of the LEI in prior recessions, the LEI did not spike down to nearly the same extent as the nonmonetary components during the downturn that began in 2007, thanks to unprecedented monetary policy actions. Likewise, the LEI has held up much better in recent months than either its non-monetary components, or its accuracy-weighted components, also as a result of monetary policy that is outside of historical norms and stretched far along the zero bound.

A troublesome issue here is that once the non-monetary components of the LEI have turned negative to the extent we observe presently (again, on a 6-month smoothed basis), we find only one instance (a brief signal in the late-1960s) that was not associated with an actual recession. Below, the red bands denote official NBER-dated recessions. Downturns in the non-monetary components of the LEI are highlighted in blue.

Our own recession ensembles remained unfavorable last week, and the ECRI Weekly Leading Index deteriorated to -8.2, from -7.6 the previous week. The 3 month growth rate of non-farm payroll employment – despite last month’s employment gain – is among the lowest 13% of all historical observations. The 6-month change in the S&P 500 is among the lowest 20% of historical observations. The current value of ECRI’s Weekly Leading Index is among the lowest 9% of all historical observations. We don’t disregard the marginal improvement in various economic measures in recent weeks. It’s just that those marginal improvements are either too small or too statistically uninformative to be helpful in shifting the evidence.

In sum, the balance of leading evidence continues to indicate a very high likelihood of an oncoming recession. We respect the various marginal improvements in the data in recent months, which do take the probability to less than 100%, but that is a far cry from suggesting that recession risk is anywhere close to being “off the table.” Recession is not a certainty, but it remains the most probable outcome at present.

All of that said, significant new strength in stocks – particularly if broadly based – further contraction in new unemployment claims, well-defined (not just marginal) improvement in a broad sampling of Fed economic surveys, and a reversal in industrial commodity prices, among other factors, would provide a good basis to ease recession concerns. If that was coupled with confirmation by a reversal in ECRI’s measures, the evidence that weighs down our economic views would become dramatically lighter. But that’s what we need – evidence. Well correlated, strong, leading evidence.

Even if we allow for the possibility of improvement, my impression is that the potential outcomes for the market are very asymmetrical. Investors now expect pleasant, if gradual, economic progress, convinced by a stream of economic anecdotes in recent weeks. That hopeful expectation is already largely reflected in the overvalued, overbought, overbullish condition of the market. If the economy does in fact improve, we may observe further upside progress, but again – this is largely reflected in the advance that stocks have already enjoyed. The asymmetric risk is the potential for great disappointment if the economy does fall into a contraction – as well-correlated leading evidence continues to suggest.

Market Climate

As of last week, the Market Climate for stocks remains “hard negative” – characterized by conditions that cluster among other historical instances that usually resulted in “whipsaw” declines on the tail of overbought rallies. About 30% of these instances did resolve into further gains, and we aren’t frozen to a defensive stance. As noted above, there are certainly developments that would mute our economic concerns and even allow for a modestly constructive position despite what we continue to view as an overvalued market from a longer-term perspective. Presently, we would need at minimum a further improvement in market internals – primarily breadth and leadership. The situation would also be helped by clear strength in Fed surveys and a further retreat in new claims. Without this sort of broad-based improvement, the modest “positive surprises” we’re seeing are still too tightly centered in a range that really doesn’t change the picture at all. Strategic Growth and Strategic International remain well-hedged. Strategic Total Return continues to carry a duration of about 3 years in Treasuries, and we used the spike advance early last week to clip a few more profits in our precious metals shares, taking our exposure to a still-constructive but comfortable 12% of assets.

As a final note, given our pointed economic and market concerns, I’ve included a chart below showing the profile of past major market declines, mostly as a tool to display the significant variability of outcomes. The chart shows major U.S. market declines as a “stochastic” – the bull market high being 1.0, the bear market low being zero. Time is measured in days, with the bull market peak set at 100 days in each (denoted by the red arrow).

The main regularity you’ll notice is that the first 6-8 weeks or so off the top are uniformly bad, typically inflicting about one-fifth to one-third of the eventual peak-to-trough loss. That initial decline is then typically followed by a rebound of highly variable duration, lasting anywhere between 2-5 months and usually recovering half to two-thirds of the initial decline (denoted by the green arrow). As a result, by 3-6 months into a major market decline, the market is often not far from its original peak (a tendency I noted last May in Extreme Conditions and Typical Outcomes ). Unfortunately, that is not a rule that one would want to rely on, because when it has failed, it has often failed spectacularly.

Each decline has its own character, so there is no predictable point at which breakdowns occur. Notice that the bottom of the decline is also highly variable, so outside of quoting a broad range from 3 months to 3 years, with the average at a bit less than 18 months, major market declines don’t have a predictable duration. The upshot is that major declines are not diagonal and do not follow well-behaved patterns. It’s exactly that variability that makes it dangerous to “finesse” them excessively, and advisable to stick with the broad evidence, recognizing that there will be a lot of unpredictable short-term volatility. For our part, we remain defensive here.

NEW from Bill Hester: Five Global Risks to Monitor in 2012

2012 – THE YEAR OF LIVING DANGEROUSLY

“In retrospect, the spark might seem as ominous as a financial crash, as ordinary as a national election, or as trivial as a Tea Party. The catalyst will unfold according to a basic Crisis dynamic that underlies all of these scenarios: An initial spark will trigger a chain reaction of unyielding responses and further emergencies. The core elements of these scenarios (debt, civic decay, global disorder) will matter more than the details, which the catalyst will juxtapose and connect in some unknowable way. If foreign societies are also entering a Fourth Turning, this could accelerate the chain reaction. At home and abroad, these events will reflect the tearing of the civic fabric at points of extreme vulnerability –  problem areas where America will have neglected, denied, or delayed needed action.” – Strauss & Howe – The Fourth Turning – 1997


In December 2010 I wrote an article called Will 2012 Be as Critical as 1860?, that pondered what might happen with the 2012 presidential election and the possible scenarios that might play out based on that election. Well, 2012 has arrived and every blogger and mainstream media pundit is making their predictions for 2012. The benefit of delaying my predictions until the first week of 2012 is that I’ve been able to read the wise ponderings of Mike Shedlock, Jesse, Karl Denninger, and some other brilliant truth seeking analysts regarding what might happen during 2012. The passage above from Strauss & Howe was written fifteen years ago and captured the essence of what has happened since 2007 and what will drive all the events over the next decade. Predicting specific events is a futile human endeavor. The world is so complex and individual human beings so impulsive and driven by emotion, that the possible number of particular outcomes is almost infinite.

But, as Strauss and Howe point out, the core elements that created this Crisis and the reaction of generational cohorts to the implications of debt, civic decay and global disorder will drive all the events that will occur in 2012 and for as far as the eye can see. Linear thinkers in mega-corporations, mainstream media and Washington D.C. focus on retaining the status quo, their power and their wealth. They believe an economic recovery can be manufactured through monetary manipulation and Keynesian borrowing and spending. They are blind to the fact that history is cyclical, not linear. In order to have an understanding of what could happen in the coming year, it is essential to keep the big picture in focus. As we enter the fifth year of this twenty year Crisis period, there is absolutely no chance that 2012 will see an improvement in our economy, political atmosphere or world situation. Fourth Turnings never de-intensify. They exhaust themselves after years of chaos, conflict and turmoil. I can guarantee you that 2012 will see increased mayhem, riots, violent protests, recessions, bear markets, and a presidential election that will confound the establishment. All the episodes which will occur in 2012 will have at their core one of the three elements described by Strauss & Howe in 1997: Debt, Civic Decay, or Global Disorder.

Debt – On the Road to Serfdom

The world is awash in debt. Everyone is focused on the PIIGS with their debt to GDP ratios exceeding the Rogoff & Reinhart’s 90% point of no return. But, the supposedly fiscally responsible countries like Germany, France, U.K., and the U.S. have already breached the 90% level. Japan is off the charts, with debt exceeding 200% of GDP. These figures are just for the official government debt. If countries were required to report their debt like a corporation, their unfunded entitlement promises to future generations are four to six times more than their official government debt.

Any critical thinking person can look at the chart above and realize that creating more debt out of thin air to solve a debt problem is foolish, dangerous, and self serving to only bankers and politicians. The debt crisis took decades of terrible choices and bogus promises to produce. The world is now in the midst of a debt driven catastrophe. At best, the excessive levels of sovereign debt will slow economic growth to zero or below in 2012. At worst, interest rates will soar as counties attempt to rollover their debt and rolling defaults across Europe will plunge the continent into a depression. The largest banks in Europe are leveraged 40 to 1, therefore a 3% reduction in their capital will cause bankruptcy. Once you pass 90% debt to GDP, your fate is sealed.

“Those who remain unconvinced that rising debt levels pose a risk to growth should ask themselves why, historically, levels of debt of more than 90 percent of GDP are relatively rare and those exceeding 120 percent are extremely rare. Is it because generations of politicians failed to realize that they could have kept spending without risk? Or, more likely, is it because at some point, even advanced economies hit a ceiling where the pressure of rising borrowing costs forces policy makers to increase tax rates and cut government spending, sometimes precipitously, and sometimes in conjunction with inflation and financial repression (which is also a tax)?”Rogoff & Reinhart

The ECB doubling their balance sheet and funneling trillions to European banks will not solve anything. The truth that no one wants to acknowledge is the standard of living for every person in Europe, the United States and Japan will decline. The choice is whether the decline happens rapidly by accepting debt default and restructuring or methodically through central bank created inflation that devours the wealth of the middle class. Debt default would result in rich bankers losing vast sums of wealth and politicians accepting the consequences of their phony promises. Bankers and politicians will choose inflation. They believe they can control the levers of inflation, but they have proven to be incompetent, hubristic, and myopic. The European Union will not survive 2012 in its current form. Countries are already preparing for the dissolution. Politicians and bankers will lie and print until the day they pull the plug on the doomed Euro experiment.

The false storyline of debt being paid down in the United States continues to be propagated by the mainstream press and decried by Paul Krugman. The age of austerity storyline gets full play on a daily basis. Total credit market debt in 2000 was $27 trillion. It skyrocket to $42 trillion by 2005 as George Bush and Alan Greenspan encouraged delusional Americans to defeat terrorism by leasing SUVs and live the American dream by putting zero down on a $600,000 McMansion, financing it with a negative amortization no doc loan. Paul Krugman got his wish as a housing bubble replaced the dotcom bubble. Debt accumulation went into hyper-speed in 2006 and 2007 as Wall Street sharks conducted a fraudulent feeding frenzy by peddling their derivatives of mass destruction around the globe. By the end of 2007, total credit market debt reached $51 trillion.

In a world inhabited by sincere sane leaders, willing to level with the citizens and disposed to allow financial institutions that took world crushing risks to fail through an orderly bankruptcy process, debt would have been written off and a sharp short contraction would have occurred. The stockholders, bondholders and executives of the Wall Street banks would have taken the losses they deserved. Instead Wall Street used their undue influence, wealth and power to force their politician puppets to funnel $5 trillion to the bankers that created the crisis while dumping the debt on taxpayers and unborn generations. The Wall Street controlled Federal Reserve provided risk free funding and took toxic mortgage assets off their balance sheets. The result is total credit market debt higher today than it was at the peak of the financial crisis in March 2009.


Our leaders have done the exact opposite of what needed to be done to address this debt crisis. The country is adding $3.7 billion per day to the National Debt. With the debt at $15.2 trillion, we have now surpassed the 100% to GDP mark. The National Debt will be $16.5 trillion when the next president takes office in January 2013. Ben Bernanke has been able to keep short term interest rates near zero and the non-existent U.S. economic growth and European disaster has resulted in keeping long-term rates near record lows. Despite these historic low rates, interest on the National Debt totaled $454 billion in 2011, an all-time high. The effective interest rate was approximately 3%. If rates stay at current levels, interest will be between $400 and $500 billion in 2012. Each 1% increase in rates would cost American taxpayers an additional $150 billion. A rapid increase in rates to the 7% level would ratchet interest expense above $1 trillion and destroy the last remaining vestiges of Bernanke’s credibility. It can’t possibly happen in 2012. Right? The world has total confidence in pieces of paper being produced at a rate of $3.7 billion per day. Confidence in Ben Bernanke, Barack Obama and the U.S. Congress is all that stands between continued stability and complete chaos. What could go wrong?

Debt related issues that will likely rear their head in 2012 are as follows:

  • A debt saturated society cannot grow. As debt servicing grows by the day, the economy losses steam. The excessive and increasing debt levels will lead to a renewed recession in 2012 as clearly detailed by ECRI, John Hussman and Hoisington Investment Management.

“Here’s what ECRI’s recession call really says: if you think this is a bad economy, you haven’t seen anything yet. And that has profound implications for both Main Street and Wall Street.” – ECRI 

At present, we observe agreement across a broad ensemble of models, even restricting data to indicators available since 1950 (broader data since 1970 imply virtual certainty of recession). The uniformity of recessionary evidence we observe today has never been seen except during or just prior to other historical recessions.-  John Hussman 

Negative economic growth will probably be registered in the U.S. during the fourth quarter of 2011, and in subsequent quarters in 2012. Though partially caused by monetary and fiscal actions and excessive indebtedness, this contraction has been further aggravated by three current cyclical developments: a) declining productivity, b) elevated inventory investment, and c) contracting real wage income. In summary, the case for an impending recession rests not only on cyclical precursors evident in productivity, real wages, and inventory investment, but also on the disfunctionality of monetary and fiscal policy. – Van Hoisington 

  • The onrushing recession will send housing down for the count. With 2.2 million homes already in the foreclosure process and another 13 million homes with negative or near negative equity, the recession will push more people over the edge. As foreclosures rise a self reinforcing loop will develop. Home prices will fall as banks dump houses at lower prices, pushing millions more into a negative equity position. Home prices will fall another 5% to 10% in 2012, with a couple years to go before bottoming.
  • The recession will result in companies laying off more workers. It won’t be as dramatic as 2008-2009 because companies have already shed 6 million jobs. The working age population will increase by 1.7 million, the number of people employed will go up by 1 million, but the official unemployment rate will drop to 7% as the BLS reveals that 10 million people decided to relax and leave the workforce. Surely I jest. The government manipulated unemployment rate will rise above 9%, while the real rate will surpass 25%.
  • The American people rationally increased their savings rate to 6.2% in the 2nd Quarter of 2009. When you are over-indebted and the country heads into recession, spending less and saving more is a sane option. Consumer expenditures accounted for 69% of GDP in 2007, prior to the economic collapse. The “recovery” of 2010-2011 has been driven by Ben’s zero interest rate policy, the resumption of easy credit peddling by the Wall Street banks, and consumers convinced that going further into hock to attain the American dream is rational. Consumer spending as a percentage of GDP has actually risen to 71% and the savings rate has plunged to 3.6%. The 20% drop in gas prices since April bottomed in December. This decline temporarily boosted consumer spending, but prices are on the rise again. With the State and local governments reducing spending, do the Wall Street Ivy League economists really believe consumers will increase their consumption to 73% of GDP and reduce their savings rate to 1%? If you open your local newspaper you will see the master plan. Car dealers are offering 0% financing with nothing down for 60 months. The GMAC/Ditech/Ally Bank zombie lives as subprime auto loans are back. The “strong” auto sales are a debt financed illusion. Ashley Furniture is offering 0% financing for 50 months with no payments through Wells Fargo Bank. When the Federal Reserve provides the Wall Street banks with 0% funding, banks are willing to take big risks knowing that Uncle Ben and the naive American taxpayer will be there to bail them out when it blows up again.


  • With recession a certainty as fiscal stimulus wears off, home prices fall, employment stagnates, and consumer spending grinds to a halt, what will happen to the stock market? The Wall Street shills paraded on CNBC and interviewed by the multi-millionaire talking head twits assure you that stocks are undervalued and the market will surely be up 10% to 15% by 2013. It’s a mortal lock, just as it has been for the last twelve years, with the S&P 500 at the same level as January 1999. The fact is the stock market drops 30% on average during a recession. The talking heads declare that corporate profits are at record levels and will continue higher. Not bloody likely. Corporate profit margins are at an all-time peak about 50% above their historical norms. Profits always revert to their mean. These profits are not sustainable as they were generated by firing millions of workers, zero interest rates for banks, fraudulent accounting by the banks, and trillions in handouts from the middle class taxpayers to corporate America.


In a true free market excess profits will draw more competitors and profits will fall due to competition. When corporate profits exceed the mean by such a large amount, you can conclude that crony capitalism has replaced the free market. Government bureaucrats have been picking the winners (Wall Street, War Industry, Big Media, Big Healthcare) and the American people are the losers. Corporate oligarchs prefer no competition so they can reap obscene risk free profits and reward themselves with king-like compensation. Mean reversion will eventually be a bitch. Real S&P earnings have reached the 2007 historic peak. To believe they will soar higher as we enter a recession takes the same kind of faith shown by Americans buying a $600,000 McMansion in Stockton with no money down in 2005. The result will be the same. Do you ever wonder how corporations are doing so well while the average American sinks further into debt, despair and poverty?

The brilliant John Hussman captures the gist of an investor’s dilemma in his latest article:

“With 10-year Treasury yields below 2%, 30-year yields below 3%, corporate bond yields below 4%, and S&P 500 projected 10-year total returns below 5%, we presently have one of the worst menus of prospective return that long-term investors have ever faced. The outcome of this situation will not be surprisingly pleasant for any sustained period of time, but promises to be difficult, volatile, and unrewarding. The proper response is to accept risk in proportion to the compensation available for taking that risk. Presently, that compensation is very thin. This will change, and much better opportunities to accept risk will emerge. The key is for investors to avoid the allure of excessive short-term speculation in a market that promises – bends to its knees, stares straight into investors’ eyes, and promises – to treat them terribly over the long-term.”

Ben Bernanke, Wall Street shysters and Barack Obama want you to be drawn in by the allure of short-term gains based on hopes of QE3. The stock market will be volatile in 2012 with stocks falling 20% when it becomes evident the country is going back into recession. Ben will try to ride to the rescue with QE3 as he buys up more toxic mortgage debt. Wall Street will do their usual touchdown dance celebration, but the bloom will fall off this rose fast, as quantitative easing has proven to be a failure in stimulating economic growth.Gridlock in Washington D.C., chaotic national conventions, and the implosion of Europe will contribute to the market finishing down by at least 15% for the year.

  • Even though the U.S. economy has been stagnant for the past year and Europe is back in recession, oil is trading at $102 a barrel (Brent – $113 a barrel). This is a classic Catch-22 for Bernanke and his central banker buddies. The higher the price goes, the more recessionary economies become as energy and food costs rise. This would normally decrease demand and lower prices, but the massive money printing by the Fed and ECB artificially inflates the price of oil. The Canadian oil sands are only viable at $90 a barrel. Saudi Arabia needs $90 oil to balance their budgets. The onset of peak cheap oil, lack of Libyan supply, possible war with Iran, and increased demand from the developing world (China, India) will put a floor of $80 to $90 a barrel under oil. A shooting war with Iran would result in $150 a barrel of oil overnight. The trend in gasoline prices over the last three years is not your friend:

January 2009           $1.65

January 2010           $2.57

January 2011           $3.04

January 2012           $3.29

Gas prices are rising during the lowest usage time of the year. The average price of oil will exceed $100 during 2012 resulting in the highest average gas price in history for American drivers. These high prices, along with various weather related issues will keep food prices elevated, with 5% or higher increases likely. This should spur a few more peasant revolutions around the globe.

  • The question of whether gold can keep its streak of 11 consecutive positive return years in a row intact is an easy one. Will Obama and Congress spend $1.3 trillion more than they bring in during 2012? Will Ben Bernanke and other central bankers around the globe keep printing pieces of paper and calling it currency? If the answer to these two questions is yes, then gold will finish the year higher. As always, it will be volatile and manipulated by the powers that be. A drop below $1,500 in the beginning of the year is possible, but when Ben announces QE3, it will be off to the races. I expect gold to reach $1,900 by year end. Silver will be more volatile, but will likely reach $40 by year end.

Civic Decay – Occupying, Plundering, Capturing

Civic decay revealed itself dramatically in 2011 as millions of young people across the country occupied parks and town squares in a fruitless effort to correctly point out how the ruthless oligarchs inhabiting Wall Street bank executive suites, Mega-corporation boardrooms, the Marriner S. Eccles Federal Reserve Board Building, and the hallways of Congress had pillaged the wealth of the middle class through inflation, taxation, fraud and outright thievery. The majority of over-medicated, lethargic, uninterested, ignorant Americans yawned at this selfless display of courage and civil disobedience as they chose to occupy lines for hours to get the latest iPad or $3 waffle-maker at Wal-Mart. Delusional, non-thinking dolts across the land watched on their 60 inch HDTVs as young protestors got clubbed, beaten, tear gassed, tasered, maced, and brutalized by paid mercenaries for the ruling oligarchy. They treated the horrific scenes of brutality as if it was just one of their 30 favorite reality TV shows like I Didn’t Know I Was Pregnant or Toddlers & Tiaras. They thought this was a new show called Mace A Millenial.

Despite controlling the media, the money and the levers of power in Washington D.C., those in power cannot spin the reality of a middle class being systematically wiped out by the policies put in place by the corporate fascist oligarchs running this country. As Wall Street profits and bonuses flow like honey, the lines at food banks look like the lines at Best Buy on Black Friday and homeless shelters overflow with former members of the middle class. The ministry of propaganda (BLS, BEA) reports improving economic conditions while the number of Americans in the food stamp program has jumped from 38 million when the recession officially ended in late 2009 to 46.3 million today. Having 15% of the population surviving on food stamps is surely a sign of economic recovery.


The mainstream media methodically spews misinformation and happy talk about increased consumer spending and retail sales above expectations as if Americans borrowing to buy another laptop, TV, Kindle, or Rolex proves we have a real recovery. Meanwhile, old line mall based retailers like Sears and J.C. Penney die a slow agonizing death as they stagger into the sunset like Montgomery Ward, Circuit City and thousands before them. There is a disconnect in society as high end retailers like Saks, Tiffany, and Neiman Marcus report record sales as the 1% feel confident and flush with cash. Meanwhile, real median income is lower than it was in 2001. It seems tax cuts didn’t lift all boats, just the yachts. The average Joe pays twice as much for a gallon of gas and 50% more for food since 2001 while taking home less pay. The ruling elite can’t figure out why the peasants are getting restless.


The wealthy elite have been out in force over the last few months broadcasting their storyline about 50% of Americans not paying taxes. They and their media mouthpieces pound this message home unceasingly. They portray themselves as job creators, when the facts prove they have destroyed jobs here in America. They successfully painted the Occupy Movement as a bunch of lazy good for nothing socialists who needed to get a job. Then they unleashed the full fury of their brute strength upon these citizens practicing their right to assembly and free speech by crushing them with their hired police thugs, while the ignorant by choice public looked away. Controlling the message is essential for the oligarchs to retain their wealth, power and control. Aldous Huxley’s understanding of the American people is as true today as it was eighty years ago:

 “Most ignorance is vincible ignorance. We don’t know because we don’t want to know.”

It is time to not choose ignorance. The storyline peddled to the masses is false. The ruling oligarchy will do everything in their power to obscure and manipulate the truth. It is true that 50% of American workers pay no Federal income tax. It is also true that 50% of American workers make less than $25,000 per year. If these workers are employed in Philadelphia they pay 4% city income tax, 3% state income tax, 7.65% Social Security and Medicare tax, 6% sales tax on everything they buy, 15% state and federal taxes on gasoline, and they pay city and county property taxes whether they own or rent. They also pay the various sewer, trash, and myriad of other fees inflicted on them by government drones. Maybe someone should inform multi-billionaire hedge fund guru Steve Schwarzman that lower income families actually have most of their skin in the game. They can’t hire hoards of high powered lawyers and tax accountants to minimize their tax burden while contributing millions to politicians who write the laws to protect the oligarchs. I wonder why hedge fund managers don’t pay taxes on their profits.

Asked if he were willing to pay more taxes in a Nov. 30 interview with Bloomberg Television, Blackstone Group LP CEO Stephen Schwarzman spoke about lower-income U.S. families who pay no income tax. “You have to have skin in the game,” said Schwarzman, 64. “I’m not saying how much people should do. But we should all be part of the system.”

We are all part of the system, and the system is rigged. The middle class is systematically being obliterated as high paying jobs were shipped to low paying countries by mega-corporations. Their huge cost advantages have driven small domestic “job creating” firms out of business. The middle class has the majority of their wealth tied up in their homes, and they continue to see that wealth decline on a daily basis. The culprits in the housing collapse – the major Wall Street banks – have seen their profits skyrocket as they held the middle class hostage to a multi-trillion dollar banker bailout. Americans don’t hate the wealthy. Wealthy men like Steve Jobs and Bill Gates have been admired and emulated by Americans because they exhibited the true admirable traits of entrepreneurship, creativity, hard work, taking chances, and creating a better society. Wall Street shysters create nothing. They exhibit the worst traits of greed, avarice, and non-existent empathy for their fellow man.

 Gains and Losses in 2007-2009, Average CEO Pay vs. Average Worker Pay

Matt Taibbi summed up how the system is rigged rather succinctly in a recent article:

“And in the bigger picture, of course, you need the state and the private sector both to be functioning well enough to provide you with regular work, and a safe place to raise your children, and clean water and clean air. The entire ethos of modern Wall Street, on the other hand, is complete indifference to all of these matters. The very rich on today’s Wall Street are now so rich that they buy their own social infrastructure. They hire private security, they live on gated mansions on islands and other tax havens, and most notably, they buy their own justice and their own government.

But citizens of the stateless archipelago where people like Schwarzman live spend millions a year lobbying and donating to political campaigns so that they can jump the line. They don’t need to make sure the government is fulfilling its customer-service obligations, because they buy special access to the government, and get the special service and the metaphorical comped bottle of VIP-room Cristal afforded to select customers.”

The wealth inequality in this country did not occur because half the population is lazy and stupid. It didn’t happen because the 1% is intellectually superior, more highly motivated, or more entrepreneurial than the 99%. If any of these statements were true, the inequality would be consistent across decades and centuries. But, as the chart below details, the phenomenon has happened since 1979. Interestingly, it also occurred just prior to the 1929 stock market crash and Great Depression.  


The chart reflects the results of three decades of crony capitalism based upon phony tax canards; delusions of a debt based American dream peddled by bankers, politicians and the media; and complete capture of our economic and political system by a self selected wealthy few. Jesse captures the essence of how it happened in a recent article:

“Anyone who has seriously studied applied macroeconomics knows that crony capitalists hate free markets, with all the fairness and transparency that they imply. Competition is a serious drag on enormous profits and introduces significant uncertainty and risk. As soon as the game is underway, successful capitalists are constantly pushing the envelope of the rules, seeking to establish rents, monopolies, unfair advantages, and debt traps to snare the bulk of the players and stifle the profit-eroding tendency of real competition.

This is the basis of all aristocracies, which are merely the institutionalization of privilege.  Once they make it they bloody well want to change the rules to hang on to it, and take the risk out of their equation. They foster a culture of two sets of books, two sets of rules, and two systems of justice. They are given over in their personal and professional lives to the benefits of hypocrisy and cheating, with little conscience to restrain them. There is a predatory class that is nationless, without allegiance to anything, any principle, but their own greed and lust for power.”

What has happened over the last three decades is not particular to the United States. It is a flaw in all humanity. The majority of humans are inherently honest and if raised by good parents will do the right thing most of the time. When society allows psychopaths and evil men to attain high status in government and business through chosen ignorance, lack of vigilance, casting aside the rule of law, or admiration for wealth attained by any means, then wealth disparity reaches extreme levels. The fatal defect of the Wall Street psychopaths is their hubris. Too much is never enough. They are like sharks, always needing more to satiate their hunger. They will eventually go too far and collapse their crony capitalist system resulting in revolution and ultimately their demise. We are very close to the tipping point and 2012 is likely to reveal deep cracks in the foundation of our warped dysfunctional corporate fascist economic system. These are a few things I expect to happen in 2012:

  • The Occupy Movement will become more extreme with more disruptions of the economic system with less warning so the authorities don’t have time to prepare. I expect more cyber hacking into Wall Street, government, and media computer networks, causing disarray and uncertainty regarding financial information. I expect the Democratic and Republican presidential conventions to be overrun by protestors. The authorities will respond with excessive force, resulting in further violent protests in other cities.
  • Two simultaneous trends will eventually result in a domestic conflict. The Federal government grows ever more panicked by the knowledge that its ponzi scheme economy is going to collapse. This is why passage of the NDAA and the future passage of SOPA are so important to them. Imprisonment of citizens without charge and shutting down the only remaining means of truth – the Internet – are essential to retaining their power and control over the masses. At the same time, gun sales are at record levels. Critical thinking Americans can see the writing on the wall and no longer trust corrupt politicians of either party. Arming yourself and buying physical gold and silver is a prudent act in today’s world. If the financial system implodes in 2012 and an MF Global like stealing of customer funds from IRAs, 401ks, and bank accounts happens, all hell could break loose.
  • The ruling elite hand selected puppets for the 2012 presidential election are Obama and Romney. They are virtually interchangeable and both are acceptable to the Wall Street oligarchs. The monkey wrench in the gears is Ron Paul. His message of freedom, liberty, non-interventionism, living within our means, self reliance, and a sound currency are poison to the establishment. His message appeals to young people and a growing number of realists who understand we are already bankrupt. He will run as a 3rd Party candidate and focus a light on the crony capitalism that passes for free markets in America today. He will be vilified by both parties and their media mouthpieces, but if he gains traction I fear an unfortunate accident will befall him. Either way, he will have a dramatic impact on the debate and the outcome of the 2012 election.

The question for 2012 is whether the gaping multitude will come to their senses and respond accordingly against the ruling oligarchy.

“Modern fanaticism thrives in proportion to the quantity of contradictions and nonsense it pours down the throats of the gaping multitude, and the jargon and mysticism it offers to their wonder and credulity.”William Hazlitt

Global Disorder – War, Oil, Religion

“We do not have to visit a madhouse to find disordered minds; our planet is the mental institution of the universe.” Johann Wolfgang von Goethe

Disorder is an understatement when describing what is happening on the global scene. It seems like the inmates are running the insane asylum. The beauty of globalization, sold to Americans by the corporate oligarchs, is being revealed for all to see. Besides seeing millions of jobs shipped overseas by mega-corporation executives and our industrial base gutted beyond repair, the other “benefits” are aplenty. The interconnectedness of the global economy insures that a recession in Europe and the U.S. will spread across the world. The producing countries will fall when the consuming countries run out of fiat currency to spur consumption. Federal Reserve created inflation in the United States instantaneously spreads around the world creating revolutions across the Middle East and social unrest in China as food and energy prices surge to levels of pain which cause the poor to revolt against the ruling establishment. People lose it when they have nothing to lose.

But, the biggest gift of globalization has been provided by whom else – the Wall Street banks and the large European banks. The European banks did their part by loaning hundreds of billions to PIIGS that could never pay them back. Next, they leveraged their balance sheets 40 to 1, insuring that a 3% loss on their capital wipes them out. When their losses clearly exceeded 40%, the bankers employed their politician puppets running the insolvent countries across the continent to dump the losses on the taxpayers through austerity measures that insure a deep European recession. Since derivatives of mass destruction link the insolvent Wall Street banks to the insolvent European banks, the Federal Reserve has now stepped into the breach with American taxpayer money by providing swap lines to European banks. The oligarchs are perfectly willing to destroy the lives of hundreds of millions of citizens across the globe to insure their wealth and power remains intact.

The other crucial component of global disorder is oil. The storyline currently being peddled to the masses is the return of energy independence for America. The political class and their lapdog media pundits blatantly lie to the American public with stories of 100 years of oil supply under our soil. GOP candidates declare we can be energy independent in two years if we just drill, drill, drill. Meanwhile, in the real world 33 billion barrels of oil are consumed every year, with the U.S. consuming 7 billion barrels per year, of which 3.3 billion barrels are imported. Total U.S. oil production continues its 40 year decline, despite the shale oil boom in the Dakotas and the massive fracking hype touted by the gas industry. If Americans used some critical thinking skills they would conclude that our oil dependent society is balanced on the head of a pin. The chart below paints a picture of current and future global disorder.

One look at this chart and you begin to understand the War on Terror cover story. The average person in these Muslim oil rich countries wants a chance for a better life, food, clothing, and hope for their children’s future. They are not the evil, freedom hating, religious fanatic terrorists portrayed by the neo-cons and war mongers like Santorum, Gingrich and Romney. American troops are stationed in or around the countries with the most oil. Any dictator that fails to play along with the U.S. and its oil demands isn’t around for long. Hussein and Gaddafi learned the hard way. It’s just a matter of time for Ahmadinejad. Expect the rhetoric about the dangerous Chavez to escalate in the near future. Controlling 300 billion barrels of oil will be essential to keeping our suburban sprawl society functioning. Soccer moms will become irate when they can’t fill up their GMC Yukon with 39 gallons of precious fuel. Our own military clearly documented why the War on Terror will never end in their 2010 Joint Operating Environment report:

 A severe energy crunch is inevitable without a massive expansion of production and refining capacity. While it is difficult to predict precisely what economic, political, and strategic effects such a shortfall might produce, it surely would reduce the prospects for growth in both the developing and developed worlds. Such an economic slowdown would exacerbate other unresolved tensions, push fragile and failing states further down the path toward collapse, and perhaps have serious economic impact on both China and India. One should not forget that the Great Depression spawned a number of totalitarian regimes that sought economic prosperity for their nations by ruthless conquest. By 2012, surplus oil production capacity could entirely disappear, and as early as 2015, the shortfall in output could reach nearly 10 MBD.

The likeliest global events which will make 2012 a year to remember include:

  • The disintegration of the European Union with outright default by Greece and the exit from the Union by Italy, Spain, and Portugal. A default and currency devaluation would bankrupt banks across Europe and would guarantee a worldwide recession and possibly depression.
  • It seems more likely by the day that someone will do something stupid in or around Iran and the Persian Gulf will explode into a virtual hell on earth. The unintended consequences of such a development will far outweigh the intended consequences.
  • The revolutions, protests, and brewing civil wars in Egypt, Syria, Libya and Iraq will flare up even if Iran doesn’t explode into a shooting war. The tensions in the Middle East will keep oil prices above $100, despite a world plunging into recession.
  • China’s hard landing will arrive in 2012. Keynesianism on steroids has failed as they’ve built more than enough vacant malls, vacant cities, vacant condo towers, and bridges to nowhere. Property prices will plunge, exports will decline, and peasants will revolt as food and energy prices push them over the edge. Chinese leaders will look for a foreign bogeyman so they can rally their 1 billion peasants around the flag. With 11% of their oil supply coming from Iran, it could get very interesting.

Just as no one saw the most significant events of 2011 (Arab Spring, Mubarak & Gaddafi overthrown, Japanese earthquake, tsunami, nuclear meltdown, and Occupy Wall Street) in advance, 2012 will surely have some surprises. Possibilities include:

  • An earthquake on the New Madrid fault or off the coast of California causing a tsunami to hit the west coast.
  • One or more hurricanes entering the Gulf of Mexico causing widespread oil rig destruction and causing oil and natural gas prices to soar.
  • A new bird flu or swine flu pandemic that spreads around the world.
  • An actual terrorist attack in the United States in a mall, hotel or public venue that provokes a massive over response by our government could change this country forever.
  • The assassination of political leaders and prominent bankers around the world as radicals take retribution into their own hands.

We have now entered the fifth year of this Fourth Turning Crisis. George Washington and his troops were barely holding on at Valley Forge during the fifth year of the American Revolution Fourth Turning. By year five of the Civil War Fourth Turning 700,000 Americans were dead, the South left in ruins, a President assassinated and a military victory attained that felt like defeat. By the fifth year of the Great Depression/World War II Fourth Turning, FDR’s New Deal was in place and Adolf Hitler had been democratically elected and was formulating big plans for his Third Reich. The insight from prior Fourth Turnings that applies to 2012 is that things will not improve. They call it a Crisis because the risk of calamity is constant. There is zero percent chance that 2012 will result in a recovery and return to normalcy. Not one of the issues that caused our economic collapse has been solved. The “solutions” implemented since 2008 have exacerbated the problems of debt, civic decay and global disorder. The choices we make as a nation in 2012 will determine the future course of this Fourth Turning. If we fail in our duty, this Fourth Turning could go catastrophically wrong. I pray we choose wisely. Have a great 2012.          

“The risk of catastrophe will be very high. The nation could erupt into insurrection or civil violence, crack up geographically, or succumb to authoritarian rule. Thus might the next Fourth Turning end in apocalypse – or glory. The nation could be ruined, its democracy destroyed, and millions of people scattered or killed. Or America could enter a new golden age, triumphantly applying shared values to improve the human condition. The rhythms of history do not reveal the outcome of the coming Crisis; all they suggest is the timing and dimension.” – Strauss & Howe


  Source: www.williambanzai7.blogspot.com

2011 – CATCH-22 YEAR IN REVIEW

“It ain’t what you don’t know that gets you into trouble. It’s what you know for sure that just ain’t so.” – Mark Twain


I published my predictions for 2011 on January 3, 2011 in my article 2011 – The Year of Catch-22. Humans evidently enjoy being embarrassed by how pitiful they are at predicting the future, because we continue to do it year after year. The mainstream media pundits don’t dare look back at their predictions or the predictions of the Wall Street shills that parade on CNBC and get quoted in the Wall Street Journal, eternally predicting 10% to 15% stock market gains. The multi-millionaire Wall Street strategists like the spawn of the squid, Abbey Joseph Cohen, have used all of their Ivy League brain power to predict at least a 10% stock price gain every year since 1999. The S&P 500 stood at 1,272 on January 6, 1999. As of this writing it currently stands at 1,261. ZERO appreciation over the last twelve years.

The Wall Street mantra of stocks for the long run is beginning to get a little stale. If Abbey Joseph Cohen had been right for the last twelve years, the S&P 500 would be 4,000. For this level of accuracy, she is paid millions. Her 2011 prediction of 1,500 only missed by16%. The S&P 500 began the year at 1,258 and hasn’t budged. The lowest prediction from the Wall Street shysters at the outset of the year was 1,333, with the majority between 1,400 and 1,500.

The same Wall Street clowns are now being quoted in the mainstream media predicting a 10% to 15% increase in stock prices in 2012, despite the fact we are headed back into recession, China’s property bubble has burst, and Europe teeters on the brink of dissolution. They lie on behalf of their Too Big To Tell the Truth employers by declaring stocks undervalued, when honest analysts such as Jeremy Grantham, John Hussman and Robert Shiller truthfully report that stocks are overvalued and will provide pitiful returns over the next year and the next decade.

I will take my chances with a few predictions for 2012 after reviewing my lack of foresight regarding 2011. I declared 2011 the year of Catch-22 because no matter what happened, it would not translate into a positive result for the American people. This was my thesis:

The United States and its leaders are stuck in their own Catch 22. They need the economy to improve in order to generate jobs, but the economy can only improve if people have jobs. They need the economy to recover in order to improve our deficit situation, but if the economy really recovers long term interest rates will increase, further depressing the housing market and increasing the interest expense burden for the US, therefore increasing the deficit. A recovering economy would result in more production and consumption, which would result in more oil consumption driving the price above $100 per barrel, therefore depressing the economy. Americans must save for their retirements as 10,000 Baby Boomers turn 65 every day, but if the savings rate goes back to 10%, the economy will collapse due to lack of consumption. Consumer expenditures account for 71% of GDP and need to revert back to 65% for the US to have a balanced sustainable economy, but a reduction in consumer spending will push the US back into recession, reducing tax revenues and increasing deficits. You can see why Catch 22 is the theme for 2011.

My predictions for 2011 were as follows:

  • The first half of 2011 is guaranteed to give the appearance of recovery. The lame-duck Congress ”compromise” will pump hundreds of billions of borrowed dollars into the economy. The continuation of unemployment benefits for 99 weeks (supposedly to help employment) and the 2% payroll tax cut will goose consumer spending. Ben Bernanke and his QE2 stimulus for poor Wall Street bankers is pumping $75 billion per month ($3 to $4 billion per day) directly into the stock market. Since Ben gave Wall Street the all clear signal in late August, the NASDAQ has soared 25%. Despite the fact that there are 362,000 less Americans employed than were employed in August 2010, the mainstream media will continue to tout the jobs recovery. The goal of all these efforts is to boost confidence and spending. Everything being done by those in power has the seeds of its own destruction built in. The Catch 22 will assert itself in the 2nd half of 2011.

The payroll tax cut, extension of unemployment benefits and Bernanke’s gift to Wall Street criminal banks did nothing to help real Americans in the real world. The government manipulated GDP has languished between 0.4% and 1.8% in the first three quarters of 2011. Using a true measure of inflation, as detailed by John Williams at www.shadowstats.com, GDP has remained at a recessionary level of -2% to -3%.


Easy Ben accomplished his goal of pumping up the stock market with his QE2 gift to Wall Street bankers during the first six months of 2011, with the S&P 500 peaking at 1,364 in late April. The market began to fall the second Ben stopped handing Jamie Dimon and his friends $4 billion per day, with the market dropping 18% in three months. The market has risen back near the breakeven level for the year based on Ben’s promise to keep interest rates at zero forever and the hope of QE3.

  • A new perfect storm is brewing for housing in 2011 and will not subside until late 2012. You may have thought those bad mortgages had been all written off. You would be wrong. There will be in excess of $200 billion of adjustable rate mortgages that reset between 2011 and 2012, with in excess of $125 billion being the dreaded Alt-A mortgages. This is a recipe for millions of new foreclosures.

The brainless twits on CNBC will dutifully report the number of completed foreclosure sales plunged by 24% in 2011, giving the impression to their non-critical thinking viewership that all is well on the housing front. What they will fail to point out is that the number of foreclosures in process went up in 2011 and now stands 59% ABOVE the level in 2009 at the height of our recession. The reason that completed foreclosures have fallen is twofold. The criminal Wall Street banks can’t prove they hold the mortgage notes on hundreds of thousands of homes and they have a few legal issues related to the massive robo-signing fraud they committed. Kicking old ladies and Iraq War veterans out into the street using fraudulent documentation has caused the Wall Street Too Evil To Believe Banks some public relations issues. Secondly, the Wall Street Plutocrats have these mortgage loans valued at 100% on their balance sheets due to the FASB gift of mark to fantasy accounting rules. Foreclosing actually reveals their assets to be overvalued by at least 50%. This may explain why millions of Americans are still in their homes after not making a mortgage payment for two years, as detailed by economist Tom Lawler:

Given the number of loans either seriously delinquent or in the process of foreclosure at the beginning of the year, the number of completed foreclosure sales in 2011 is almost absurdly low, reflecting the complete screw-up of the mortgage servicing industry, and the resulting dramatic slowdown in foreclosure resolutions. As of the end of October, 2011 LPS estimated that there were 1.759 million seriously delinquent loans with the average number of days delinquent at 388 (compared to 192 days in January 2008), and there were 2.210 million loans in the foreclosure process that had been on average delinquent for 631 days.

Completed Foreclosure Sales And Short Sales/DILs (thousands, estimates)
  2008 2009 2010 2011(E)
Completed Foreclosure Sales 914 949 1,070 815
Owner-occupied N.A. N.A. 785 608
Non-owner-occupied N.A. N.A. 285 207
Short Sales/DILs 105 270 354 380
Foreclosures plus Short Sales/DILs 1,019 1,219 1,424 1,195
Outstanding first liens: Jan-08 Jan-09 Jan-10 Jan-11
Seriously Delinquent (90+) 1,016 1,983 3,061 2,168
In Process of Foreclosure 860 1,386 2,110 2,203
 
The concerted effort to not complete foreclosures did nothing to slow the continued descent in home prices. As you can see in the chart below from http://www.calculatedriskblog.com/, real home prices will have fallen another 5% in 2011. Obama and his minions threw $50 billion of your tax dollars at the housing market in 2009 – 2010 with tax credits, loan modification programs, homebuilder tax loss carry-backs, and a myriad of other Keynesian claptrap solutions. They succeeded in pissing your tax dollars down the toilet as prices have declined another 12% in the last 18 months. Prices have fallen 42% nationally since 2006. I wonder who missed the boat on that development?
 
“We’ve never had a decline in house prices on a nationwide basis. So, what I think what is more likely is that house prices will slow, maybe stabilize, might slow consumption spending a bit.” – Ben Bernanke – July 2005


There are approximately 48.5 million homes with mortgages in the United States and 10.7 million of them have negative equity. Another 2.4 million have less than 5% equity. Considering it costs more than 5% in closing costs to sell a house that means 27% of home occupiers with a mortgage are trapped like rats in a cage. With 2.2 million foreclosures still in the pipeline and a looming recession, home prices will continue to fall another 10% to 20% over the next two years and one third of all home occupiers will be underwater. That sounds like a recipe for 10% to 15% stock market gains.

  • Quantitative easing has benefited only Wall Street bankers and the 1% wealthiest Americans. The $1.4 trillion of toxic mortgage backed securities on The Fed’s balance sheet are worth less than $700 billion. How will they unload this toxic waste? The Treasuries they have bought drop in value as interest rates rise. Quantitative easing’s Catch 22 is that it can never be unwound without destroying the Fed and the US economy.

Bennie and his Inkjets did a bang up job in 2011. He was able to expand his balance sheet from $2.47 trillion to $2.95 trillion in twelve short months. According to Ben and his Federal Reserve friends, increasing your balance sheet by $480 billion isn’t really printing money out of thin air and handing it to their Wall Street owners for free, so they can prop up the stock market and enrich their executives. Ben is now leveraged 57 to 1. He should move to Europe, where this level of leverage is commonplace. In comparison, Lehman Brothers and Bear Stearns were leveraged 40 to 1 when they went belly up.

There is absolutely no way that Ben Bernanke could ever reduce the Federal Reserve balance sheet to the pre-crisis level without destroying the U.S. economy. He knows that and will never sell off those toxic mortgage assets. Not only won’t he reduce the Fed balance sheet, but by mid-2012 he will institute QE3 and buy another $600 billion of mortgage debt. His hubris knows no bounds, as his reckless illegal actions thus far have not driven interest rates sky high – YET. He has only destroyed the finances of senior citizens, savers and people who eat food and use gasoline. He will surely go down in history, but not the way he envisions.

  • The rise in oil to $91 a barrel will not be a top. The Catch-22 of a declining dollar is that prices of all imported goods go up. If the dollar falls another 10%, the price of oil will rise above $120 a barrel and push the economy back into recession.

As Bernanke printed like a drunken sailor during the first six months of 2011, the USD fell by 9% and the price of oil did exactly as expected, rising to a peak above $125. The NATO “intervention” in Libya also added a few bucks to the price of a barrel of sweet crude.

                  DXY

One-Year Chart for DOLLAR INDEX SPOT (DXY:IND)

The complete implosion of Europe and the ensuing weakness of the Euro have given the false impression that the U.S. dollar is a safe haven. The USD has regained its losses and will end the year exactly as it started versus a Euro heavy basket of world currencies. With annual deficits equaling 10% of GDP, a national debt now exceeding 100% of GDP, and Ben Bernanke in perpetual printing mode, the USD is destined to reach its intrinsic value of zero. With Brent crude still above $108 a barrel, employment still weak, and double digit food and energy inflation slowing consumer spending, the ECRI knows a recession during 2012 is baked in the cake.  


  • The imminent collapse of the European Union as Greece, Ireland, Portugal and Spain are effectively bankrupt. Spain is the size of the other three countries combined and has a 20% unemployment rate. The Germans are losing patience with these spendthrift countries. Debt does matter.

It seems I was wrong about Europe. It turned out to be much worse than anyone envisioned, with Italy now the likely fuse that blows the whole thing sky high. The ECB has made Ben Bernanke look like a lightweight by increasing their balance sheet by 44% to over $3.5 trillion in a futile effort to solve a debt crisis with more debt. It seems central bankers are programmed to print until the very end (see Weimar). The European Union will not survive 2012. Too many countries, too much government debt, too many zombie banks, too many bureaucrats, too much austerity rammed down the throats of citizens, and not enough honesty or reality based solutions.

  • State and local governments were able to put off hard choices for another year, as Washington DC handed out hundreds of billions in pork. California will have a $19 billion budget deficit; Illinois will have a $17 billion budget deficit; New Jersey will have a $10.5 billion budget deficit; New York will have a $9 billion budget deficit. A US Congress filled with Tea Party newcomers will refuse to bailout these spendthrift states. Substantial government employee layoffs are a lock.

State and local governments have laid off 535,000 workers since 2008. With borrowed Federal government stimulus handouts evaporating into thin air during 2011 – 2012, this total will reach 800,000 by the end of the next year. The U.S. Postal Service will do their part by cutting 28,000 jobs in 2012, even though they need to cut 100,000. States and municipalities based their budgets on the revenues produced by the fake debt driven housing boom from 2003 – 2007. The tax revenue dried up, but the union jobs added are a gift that keeps on costing taxpayers billions. States and localities can’t print, so layoffs will continue.   


  • There is a growing probability that China will experience a hard landing as their own quantitative easing has resulted in inflation surging to a 28 month high of 5.1%, with food inflation skyrocketing to 11.7%. Poor families spend up to half of their income on food. Rapidly rising prices severely burden poor people and can spark civil unrest if too many of them can’t afford food.

According to official government statistics China’s economy continued to boom in 2011. But, of course Chinese government reports make the BLS look honest. The fact is the Chinese stock market has fallen 28% since April as the property bubble deflates. If their economy has truly grown at an annual rate of 8% to 10% over the last five years, why is their stock market down 62% from its 2007 high?

   SHANGHAI INDEX

One-Year Chart for Shanghai Stock Exchange Composite Index (SHCOMP:IND)

The price inflation in food and energy prices, along with the property bubble bursting has led to breakouts of civil unrest across China. China’s two biggest markets – Europe & the United States – are in or near recession and are buying less of their crap. They can only build so many vacant cities and shopping malls to create the appearance of growth. The hard landing is about to get harder in 2012.

  • The Tea Party members of Congress are likely to cause as much trouble for Republicans as Democrats. If they decide to make a stand on raising the debt ceiling early in 2011, all hell could break loose in the debt and stock markets. 

It seems I got the timing wrong on this prediction, but the August showdown was a doozy. The threat of a government shutdown resulted in the stock market collapsing by 18% in a matter of weeks in August. Our beloved politicians then came up with another bullshit non-solution by creating a commission which, after months of negotiations, failed to do anything. The $1.2 trillion of automatic spending cuts will never happen. The slime that inhabit the hallowed halls of Congress will pretend to cut, while actually increasing spending. And so it goes. The stock market has risen from its October low based on Easy Ben’s assurances to keep interest rates at zero forever and the anticipation of QE3 in the new year.

  • Will the consensus forecast of a growing economy, rising corporate profits, 10% to 15% stock market gains, 2 million new jobs, and a housing recovery come true in 2011? No it will not. By mid-year confidence in Ben’s master plan will wane.

Corporate profits did rise, mostly due to Ben Bernanke providing free money to the Wall Street Mega-Banks so they could generate risk free profits on the backs of senior citizens getting .15% on their savings. It also helps when the same Wall Street banks can make accounting entries declaring that future loan losses will be minimal and the toxic mortgages on their books aren’t really worthless. Who knew accountants could do so much for America? Abbey Joseph Cohen only missed her stock market projection by a smidgeon. The S&P 500 is essentially unchanged for the year, while the NASDAQ and Russell 2000 will finish in the red.

The country did not add 2 million new jobs. It added 1.4 to 1.5 new jobs. Too bad the working age population went up by 1.7 million people. But our friends at the BLS, when they aren’t manipulating away the inflation that real people in the real world experience every day, have the gall to declare the unemployment rate has fallen from 9.8% to 8.6% in the last twelve months. How could this be you might ask, since the working age population went up by more than the number of people who found jobs. Easy if you are a BLS government drone. Everyone knows that things are so good out in the real world that 1.8 million Americans decided to kick back and enjoy the good life by leaving the workforce. It wasn’t because they gave up looking for the jobs that were shipped to the Far East by the mega-corporations making record profits and paying record bonuses to their executives. It’s just a rumor that those long lines at food banks around the country have a few of these “lucky” non-members of the workforce in them.

The housing recovery is just around the corner. Larry Yun, chief liar for the National Association of Realtors, assures us that it’s the best time to buy. We all know that the NAR is a bastion of honesty and truth. Just because they reported 3 MILLION more home sales than actually occurred between 2007 and 2010, you can’t scorn, ignore and treat everything they say as a bald faced lie. If Larry says the housing recovery has arrived, it must be true.

  Revised Previous % Change
2007 5,022,000 5,652,000 -11.1%
2008 4,124,000 4,913,000 -16.1%
2009 4,334,000 5,156,000 -15.9%
2010 4,182,000 4,907,000 -14.8%

When the pundits on CNBC sum up the year, they will not be touting the fact that gasoline prices went up 10% in the past year and the average price for a gallon of gas was the highest in U.S. history. They will not be proclaiming that even the government manipulated CPI shows food prices up 6% and clothing prices up 5% in the last year. I’m sure glad Ben Bernanke doesn’t see any inflation on his radar. Maybe he should ask his chauffer about his inflation. Lastly, the stocks for the long run crowd will not be yakking about the fact that gold finished up 10% for the year and has been up for TEN consecutive years. I wonder whether the numbskulls on CNBC can look at the chart below and figure out why gold is up ten years in a row. The national debt reaching $20 trillion by 2015 is a given. I wonder whether the price of gold will be higher. Maybe I’ll give Abbey Joseph Cohen a call and ask for her prediction.

Overall, my assessment of what would happen in 2011 wasn’t too far off. But, it was the things that I and virtually everyone on the planet missed that will reverberate in 2012 and for the next ten years. Our 20 year Crisis deepened, became more violent, and clearly revealed that the establishment will use all their power to put down protests and crush opposition to their corrupt crony capitalistic policies. The major developments I missed regarding 2011 included:

  • The self-immolation of a young Tunisian man set off revolutions around the globe, toppling U.S. supported dictators in Tunisia and Egypt. Dictators attempted to retain power by killing citizens by the thousands. The self-immolation of a man in New Hampshire in front of a courthouse was completely ignored by the mainstream media. I wonder why.
  • The Arab Spring has resulted in revolutions in Yemen, Bahrain, Syria and Libya. Depending upon how much oil was at stake, the U.S. has supported the dictator or the people whenever it suited them. This is called democratic principles.
  • Young people across the U.S. were inspired by the Arab Spring and began to Occupy Wall Street and many other streets in 97 other U.S. cities this past Fall. The spirit of these protests was against Wall Street criminality, Washington corruption, and corporate malfeasance. Peaceful civil disobedience by citizens of this country was met with beatings, tear gas, mass arrests and bulldozing their encampments. Students were maced while sitting in front of a college building. Ultimately a Department of Homeland Security coordinated attack on all the protests squashed the movement. The American people were too distracted by Dancing With the Stars and the latest iGadget to notice. The corporate media did their part by spewing misinformation and propaganda about the Occupy Movement, while the Wall Street Elite giggled with delight from their NYC penthouse suites.
  • Shockingly, no bankers were prosecuted despite clear unequivocal evidence of the greatest financial fraud in world history. The former head of Goldman Sachs, U.S. Senator, and NJ Governor continues to eat caviar and drink champagne in his glorious mansion after stealing $1.2 billion directly from customers’ accounts. These funds now reside in the pocket of Jamie Dimon and his upstanding JP Morgan institution.
  • The Federal government methodically moved closer to a totalitarian regime by passing legislation that will enable them to imprison U.S. citizens without charges. The only remaining area that has allowed critical thinking Americans to find the truth – the Internet – is on the verge of being locked down by the Feds. Pending legislation will allow them to shut down any website that may inconvenience their agenda. We inch ever closer to Orwell’s vision of the future.
  • No one in the MSM or government anticipated that the only truthful, honest, forthright politician in Washington D.C. – Ron Paul – could possibly win the Iowa caucus. His message of freedom, liberty, self reliance, and non-interventionism has struck a chord with young people and those capable of distinguishing between MSM propaganda and reality. The establishment is terrified of Ron Paul and is now on a mission to destroy him. What they don’t realize is their time is coming to an end. The existing social order will be swept away in a violent manner. The youth of this country will lead the charge. 2012 should be a real doozy.

I’ll take another shot at predicting the unpredictable with my next article:  2012 – The Year of Living Dangerously.

BAD MOON RISING

I see the bad moon arising.
I see trouble on the way.
I see earthquakes and lightnin’.
I see bad times today.

Creedence Clearwater Revival – Bad Moon Rising


“Human history seems logical in afterthought but a mystery in forethought.” – The Fourth Turning – Strauss & Howe

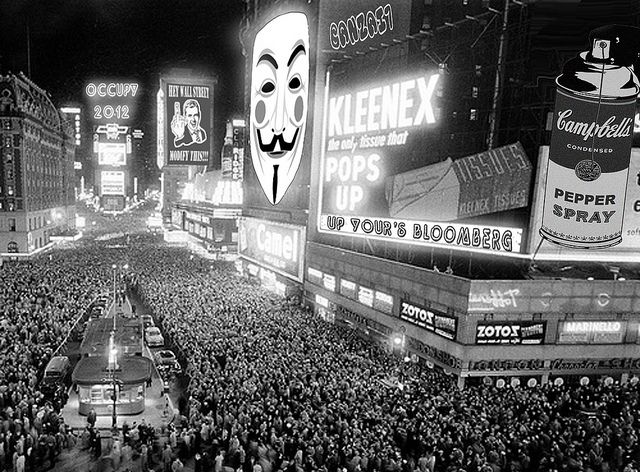
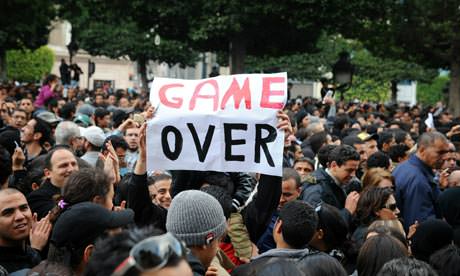
The above statement by historians William Strauss and Neil Howe is very significant as we try to make sense of the events unfolding before our very eyes in today’s world. On September 17, a mere six weeks ago, a few hundred young people showed up in Zucatti Park in Lower Manhattan to protest our corrupt, broken and Wall Street manipulated economic and political system. That first night, approximately 100 protestors occupied the park and were outnumbered by the NYPD in full riot gear. The idea to Occupy Wall Street began circulating on the internet in late August. The Millennial Generation used their social networks and put their tech savvy talents to work. Before long, thousands of protestors showed up in cities across the U.S. The model for this movement was the successful demonstrations in Egypt and Tunisia, earlier in the year.


The initial reaction among mainstream media and politicians across the land was bemusement. A bunch of young hippy throwbacks were going to make a meaningless statement and then fade away. The attention span of Americans is as long as the commercial break between contestants on Dancing With the Stars. Everyone knows the Millennials aren’t to be taken seriously. They are a bunch of spoiled, coddled, lazy college kids who need to get a job. But a funny thing happened during the commercial break. The kids held their ground. They didn’t leave. More young people arrived. More young people began protesting in cities across the country. Middle aged people began to get involved. Even some older people joined the cause. Before long there were thousands of people getting involved. It spread to Europe, with young people occupying London and Rome. Donations and supplies began to pour in from around the world. There’s something happening here, but what it is ain’t exactly clear.

The six weeks since September 17 have been chaotic, venomous, confusing, and verging on deadly. Wall Street gyrated wildly with stocks falling 8% by October 3 and rebounding by 15% by October 28 and plunging again this week. The Economic Cycle Research Institute (ECRI) declared the country was headed back into recession on September 30:

“It’s important to understand that recession doesn’t mean a bad economy – we’ve had that for years now. It means an economy that keeps worsening, because it’s locked into a vicious cycle. It means that the jobless rate, already above 9%, will go much higher, and the federal budget deficit, already above a trillion dollars, will soar. Here’s what ECRI’s recession call really says: if you think this is a bad economy, you haven’t seen anything yet. And that has profound implications for both Main Street and Wall Street.”

The ECRI has called the last three recessions with no instances of false alarms. Last week, the Conference Board announced the Consumer Confidence Index plummeted to two and a half year low of 39.8, last seen in March of 2009. The Dow Jones was trading at 6,500 in March 2009, some 47% below today’s level. It is an interesting dichotomy between how the average American feels about the world and how the Wall Street elite feel about their Ben Bernanke sheltered world. The Consumer Confidence Index was 110 in 2007 and 140 in early 2001. We’ve come a long way baby.

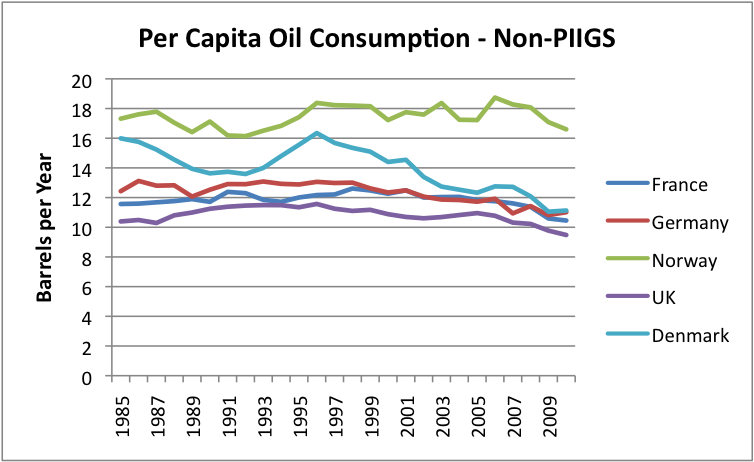
During these past six weeks the European Union has teetered on the verge of disintegration. Non-stop negotiations, agreements, plans, declarations, special purpose vehicles, bailout funds, and lies have poured forth on a daily basis. Greece still lives – on a ventilator – as it has been brain dead for months. The sole purpose of all the public relations efforts, press conferences, summit meetings and lies has been to keep European banks, their stockholders and bondholders from accepting the consequences of their irresponsible lending to the PIIGS. Essentially, the German people have been put on the hook for losses that should have been born by the stockholders and bondholders of the biggest French, German, Belgian and English banks. The EU has put a tourniquet over a cancerous tumor. The entire world is awash in bad debt and until this debt is liquidated, we will stagger from crisis to crisis like a drunken sailor. John Hussman describes the master plan:

In effect, European leaders have announced “We have agreed to solve our debt problem, leveraging money we do not have, to create a fund, which will then borrow several times that amount, in order to buy enormous amounts of new debt that we will need to issue.”

As politicians and central bankers around the world desperately try to keep their debt drenched ponzi scheme going for awhile longer, the mood darkens among the populations of developed countries around the world. I came across a quote from, of all people, Vladimir Lenin that describes how the last six weeks seemed to me: 

“There are decades where nothing happens; and there are weeks where decades happen.”

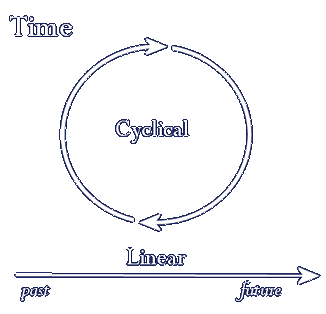
It seems like history is accelerating. Momentous events have been occurring regularly since 2007. Our political and financial leaders are blindsided on a daily basis by each new crisis. The majority of the American public continues to be apathetic, willfully ignorant, and constantly absorbed by their array of electronic gadgets and mindless drivel spewed at them by media conglomerates. Rather than think critically, most Americans allow left wing and right wing mainstream media to formulate their opinions for them through their propaganda and misinformation operations. Linear thinkers, who make up the majority of the political, social, media and financial elite in this country, believe the world progresses and moves ever forward. In reality, the world operates in a cyclical fashion, with generations throughout history reacting to events in a predictable manner based upon their stage in life. The reason the world has turned so chaotic, angry and fraught with danger since 2007 is because we have entered another Fourth Turning. Strauss & Howe have been able to document a fourfold cycle of generational types and recurring mood eras in American history back 500 years. They have also documented the same phenomenon in other countries.

The housing collapse, near meltdown of our financial system, revolutions in the Middle East, economic turmoil in Europe, poisoned political atmosphere in Washington DC, and most recently the Occupy Wall Street movement are part of a larger cycle. The four living generations have each entered the phases of their lives that will lead to a convulsive upheaval and destruction of the existing social order. We’ve entered a twenty year period of Crisis as described by Strauss & Howe:

“A CRISIS arises in response to sudden threats that previously would have been ignored or deferred, but which are now perceived as dire. Great worldly perils boil off the clutter and complexity of life, leaving behind one simple imperative: The society must prevail. This requires a solid public consensus, aggressive institutions, and personal sacrifice. People support new efforts to wield public authority, whose perceived successes soon justify more of the same. Government governs, community obstacles are removed, and laws and customs that resisted change for decades are swiftly shunted aside. A grim preoccupation with civic peril causes spiritual curiosity to decline. Public order tightens, private risk-taking abates, and crime and substance abuse decline. Families strengthen, gender distinctions widen, and child-rearing reaches a smothering degree of protection and structure. The young focus their energy on worldly achievements, leaving values in the hands of the old. Wars are fought with fury and for maximum result.” – Strauss & Howe

History is Cyclical, not Linear

“There is a mysterious cycle in human events. To some generations much is given. Of other generations much is expected. This generation of Americans has a rendezvous with destiny.” Franklin Delano Roosevelt  


I’ve been trying to decipher which direction this Fourth Turning will lead, and the last six weeks has started to crystallize my thinking. I’ve been fascinated by the intense reactions, opinions and arguments that have taken place across the airwaves and internet regarding the true nature of the Occupy movement. Some of the reaction is based upon pure ideological grounds, with media outlets like Fox News, the Wall Street Journal, NY Post and CNBC, disparaging, ridiculing and demeaning the movement. The anti-rich tone of the protests may not sit well with the multi-billionaire owners (Rupert Murdoch, Mort Zuckerman, Roberts Family) of these mega-media corporations. The liberal media such as MSNBC, Huffington Post, and CNN have sometimes been fawning over the movement in an effort to co-opt it into liberal Tea Party for the benefit of Obama and the Democratic Party. The propaganda and misinformation coming from both these ideological camps is easy to discern for a critical thinking person. Sadly, the nation is filled with people that don’t want to think. Therefore, they let their opinions be formed by talking heads on a TV screen.

These reactions were predictable. What caught my attention was the generational reaction to Occupy Wall Street. I know all the rugged individualists out there chafe at being lumped into a generational cohort, but the fact remains that groups of people born during the same time frame encounter key historical events and social trends while occupying the same phase of life. Because members of a generation are molded in lasting ways by the eras they encounter as children and young adults, they also tend to share certain common beliefs and behaviors. Aware of the experiences and traits that they share with their peers, members of a generation also tend to share a sense of common perceived membership in that generation. To deny the reality that large clusters of human beings tend to act with a herd mentality is contrary to all visible evidence. The herd mentality can be observed in the Dot-com bubble, Americans unquestioningly allowing passage of the Patriot Act, the housing bubble, the mass hysteria over the latest iSomething, Black Friday riots at retail stores to obtain the “hottest” toy or gadget, and the slaves to the latest fashions and trends as directed by the corporate media machine. The masses don’t realize they are being manipulated by the few who understand the power of propaganda:

“The conscious and intelligent manipulation of the organized habits and opinions of the masses is an important element in democratic society. Those who manipulate this unseen mechanism of society constitute an invisible government which is the true ruling power of our country. …We are governed, our minds are molded, our tastes formed, our ideas suggested, largely by men we have never heard of. This is a logical result of the way in which our democratic society is organized. Vast numbers of human beings must cooperate in this manner if they are to live together as a smoothly functioning society. In almost every act of our daily lives, whether in the sphere of politics or business, in our social conduct or our ethical thinking, we are dominated by the relatively small number of persons…who understand the mental processes and social patterns of the masses. It is they who pull the wires which control the public mind.” – Edward Bernays – Propaganda – 1928

The Occupy movement is being driven by the Millennial Generation. They have used their superior technological and social networking skills to organize, educate, and inspire people to their cause while befuddling and confusing the authorities. They continue to rally more young people to their fight against Wall Street and K Street tyranny. The generational lines of battle are being drawn. The Baby Boom Generation, who is at the point of maximum power in society, fears this movement. They control Wall Street, corporate America, Congress, the courts, academia and the media. They have reached their peak of influence and power, which will rapidly wane over the next fifteen years. They see the Occupy movement as a threat to their supremacy and control of the system. The cynical, alienated, pragmatic Generation X is caught between the Boomers and the Millennials in this escalating conflict. It is likely the majority of this generation will side with the Millennials, realizing the future of the country depends on them and not the elderly Boomers. To clarify, not every Boomer, Gen Xer, or Millennial will act in concert with their generational cohort. But it doesn’t matter if a few cattle stray from the herd, when the herd is stampeding in one direction.

The chart below details the Strauss & Howe configuration of generations and turnings for the last two Saeculums in American history. They describe their generational theory in the following terms:

“Turnings last about 20 years and always arrive in the same order. Four of them make up the cycle of history, which is about the length of a long human life. The first turning is a High, a period of confident expansion as a new order becomes established after the old has been dismantled. Next comes an Awakening, a time of rebellion against the now-established order, when spiritual exploration becomes the norm. Then comes an Unraveling, an increasingly troubled era of strong individualism that surmounts increasingly fragmented institutions. Last comes the Fourth Turning, an era of upheaval, a Crisis in which society redefines its very nature and purpose.” Strauss & Howe

Each new generation is born approximately three years prior to the next turning. This results in Strauss & Howe having a slightly different generational grouping than government demographers.

Great Power Saeculum (82)
Missionary Generation Prophet (Idealist) 1860–1882 (22) High: Reconstruction/Gilded Age
Lost Generation Nomad (Reactive) 1883–1900 (17) Awakening: Missionary Awakening
G.I. Generation Hero (Civic) 1901–1924 (23) Unraveling: World War I/Prohibition
Silent Generation Artist (Adaptive) 1925–1942 (17) Crisis: Great Depression/World War II
Millennial Saeculum (67+)
(Baby) Boom Generation Prophet (Idealist) 1943–1960 (17) High: Superpower America
13th Generation Nomad (Reactive) 1961–1981 (20) Awakening: Consciousness Revolution
(a.k.a Generation X)
Millennial Generation(Generation Y) Hero (Civic) 1982–2004 (22) Unraveling: Culture Wars, Postmodernism, Digital Technology
New Silent Generation (Generation Z) Artist (Adaptive) 2004–present (6+) Crisis: Great Recession, War on Terror, Declining Superpower, and Globalization

There is nothing mystical about their theory. Strauss & Howe are historians who have created a framework for understanding why people act a certain way to events differently, depending on which stage of life they occupy. The theory is so logical because it is based upon the average 80 year life cycle of a human being. A human being goes through four stages during their life: childhood, young adulthood, midlife, and elderhood. During each of these stages, you will react to the same event in a very different manner. During an 80 year cycle, there will be four generations at different stages of their life. The interaction between the generations at each 20 year turning determines how history is steered through the events of that cycle. The life cycle stages can be seen in this chart:

  Prophet Nomad Hero Artist
High Childhood Elderhood Midlife Young Adult
Awakening Young Adult Childhood Elderhood Midlife
Unraveling Midlife Young Adult Childhood Elderhood
Crisis Elderhood Midlife Young Adult Childhood

Strauss and Howe compare the saecular rhythm to the seasons of the year, which inevitably occur in the same order, but with slightly varying timing. Just as winter may come sooner or later, and be more or less severe in any given year, the same is true of a Fourth Turning in any given Saeculum. The theory does not predict the events which drive history, but it does predict the generational reaction to events depending upon their age. We entered the Fourth Turning Crisis in 2007 with the housing collapse and the implosion of our financial system. The configuration of elder self righteous Boomers at 60 years old, midlife pessimistic Gen Xers at 40 years old, and coming of age Millennials at 20 years old is an explosive mixture that will provide the impetus and fury to this period of catharsis and pain. Winter has arrived. There is no way to avoid it. The bitter winds have begun to blow. The first harsh front arrived in 2008 with the near meltdown of the worldwide economic system. There has been a lull in the biting gale force winds of this Crisis through the shoveling of massive amounts of newly created debt into a system already drowning in debt. The Occupy movement and the impending collapse of the European Union charade will usher in the next blizzard of pain and suffering. We hurdle towards are rendezvous with destiny.

“The ‘spirit of America’ comes once a saeculum, only through what the ancients called ekpyrosis, nature’s fiery moment of death and discontinuity.  History’s periodic eras of Crisis combust the old social order and give birth to a new. A Fourth Turning is a solstice era of maximum darkness, in which the supply of social order is still falling—but the demand for order is now rising.  It is the saeculum’s hibernal, its time of trial. Nature exacts its fatal payment and pitilessly sorts out the survivors and the doomed.  Pleasures recede, tempests hurt, pretense is exposed, and toughness rewarded—all in a season.” Strauss & Howe

Millennials Rising

Over the last six weeks I’ve watched as the young protestors around the country have been called: filthy hippies, losers, lazy, coddled, socialists, communists, spoiled college kids, parasites, useful idiots, and tools of the left. Most of the wrath being heaped upon these young people for exercising their Constitutional right to free speech and freedom of assembly has been from the Baby Boom Generation, who are at the peak of their power in our society. Sixty percent of the Senate is made up of Baby Boomers, with the next closest generation being the Silent Generation with twenty five percent. Over 58% of the House of Representatives is made up of Baby Boomers, with the next closest generation being Gen Xers at 27%. They occupy the executive suites of the Wall Street banks (Blankfein, Dimon, Pandit, Monihan) and the Federal Reserve (Bernanke). They make up the majority of judges, local politicians and school boards. They run the Federal government agencies. And they dominate the airwaves as the high priced mouthpieces for their corporate bosses. This Prophet generation will lead the country through the trials and tribulations of this Fourth Turning.

The disdain and contempt for these Millennial protestors flies in the face of the facts about this generation. They use drugs at a lower rate than their parents did at the same age. Teen crime rates and teen pregnancies have declined. They will have the highest level of college education in U.S. history. They were protected during their youth as organized sports taught them teamwork. They are the most technologically savvy generation in history. They volunteer at a higher level than previous generations. They have been more upbeat and engaged than their predecessors (Gen X). And they are much closer to their parents than Boomers were at the same age. They reject the negativism and cynicism of their parents and believe positive change is possible in our society. They have shown respect for authority up until the last six weeks. They were primed to be led by Boomers that could articulate a positive vision of the future based on reality and a better tomorrow. They were ready to make sacrifices in order to create a brighter future. But a funny thing happened. The Boomer generation failed to deliver on their part of the bargain.

Prior Hero Generation Americans had braved the winter at Valley Forge and stormed the beaches of Normandy as Prophet leaders like Ben Franklin and Franklin Roosevelt provided inspirational guidance and the vision of a better tomorrow. Strauss & Howe accurately assessed the Millennial Generation in their book Millennials Rising: The Next Great Generation, published in 2000 when the 1st Millennials were graduating high school:

“As a group, Millennials are unlike any other youth generation in living memory. They are more numerous, more affluent, better educated, and more ethnically diverse. More important, they are beginning to manifest a wide array of positive social habits that older Americans no longer associate with youth, including a new focus on teamwork, achievement, modesty and good conduct. Only a few years from now, this can-do youth revolution will overwhelm the cynics and pessimists … will entirely recast the image of youth from downbeat and alienated to upbeat and engaged — with potentially seismic consequences for America.” – Strauss & Howe

The youth of America listened to their parents and stayed in school. They’ve racked up over $1 trillion in student loan debt getting college educations. Meanwhile, our Baby Boomer leadership had an opportunity to address the country’s unsustainable fiscal path by accepting the consequences of a thirty year debt binge and liquidating the banks that took extreme risks with extreme leverage. An orderly liquidation (aka Washington Mutual) would have punished the stockholders, bondholders and management of the Wall Street banks, while leaving the depositors whole and purging the system of debt that can never be paid off. Our politicians could have ended our wars of choice in the Middle East and cut our war spending by hundreds of billions without sacrificing one iota of safety for the American people. The political leadership could have put the country on a deficit reduction path that would have insured the long-term viability of our republic.

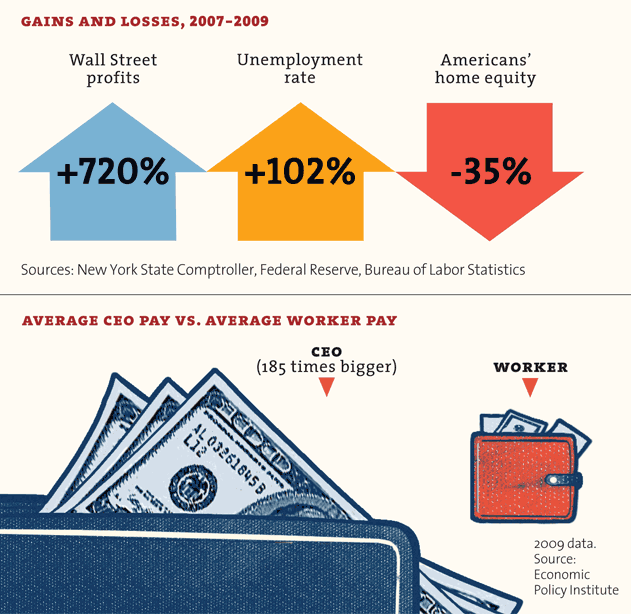
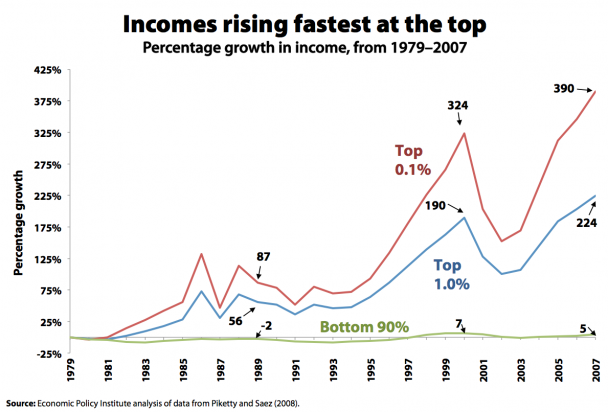
Instead of doing the right thing, our Baby Boomer leaders did the exact opposite of the right thing. They held the American taxpayer hostage and absconded with trillions of their tax dollars and handed it over to the same Wall Street banks that had run the largest fraud scheme in world history and blew up the worldwide financial system. The Boomer Chairman of the Federal Reserve decided to not only save the Wall Street banks but to purposefully try to pump up the stock market, while destroying the lives of savers and senior citizens with his zero interest rate policy. His policies have led to a surge in energy and food prices and contributed to revolutions in the Middle East. The Wall Street banks have used the accounting gimmick of relieving loan loss reserves to create fake profits over the last two years. Wall Street celebrated by paying themselves $60 billion in bonuses between 2008 and 2010. The poster boys for the .1% Jamie Dimon and Lloyd Blankfein “earned” $23 million and $19 million respectively in 2010.

The politicians borrowed trillions from future unborn generations to inflict a Keynesian nightmare of solutions on the American economy that included: an $800 billion porkulus program, $22 billion pissed down the toilet on a homebuyer tax credit as home prices are now lower, $3 billion for Cash for Clunkers that cost $24,000 per car sold, loan modification schemes, tax credits for windows, doors and appliances, and payroll tax cuts. The result of all the Federal Reserve and politician “solutions” has been to increase the National Debt by $5.3 trillion in three years, a 55% increase. It took the country over 200 years to accumulate the first $5.3 trillion in debt. Everything done thus far has benefitted only the top 1%. The real unemployment rate is 23%. The real inflation rate is between 5% and 10%. The economy is headed back into recession. But at least the top 1% are doing well, as the stock market has risen 84% from its 2009 lows. Somehow, the oligarchy that runs this country is taken aback by the protests growing increasingly contentious across the country. It is not a surprise to those who understand the cyclical nature of history and the darkening mood in this country, which has been deepening since the Tea Party protests of 2009.

Hope You Are Quite Prepared To Die

Hope you got your things together.
Hope you are quite prepared to die.
Looks like we’re in for nasty weather.
One eye is taken for an eye.

Creedence Clearwater Revival – Bad Moon Rising


It seems the young people in this country have realized they have no future when the system is run for the benefit of an oligarchy consisting of Wall Street banks, mega-corporations, media conglomerates, and puppet politicians in Washington D.C. These people will stop at nothing to retain their wealth and power. Not only do they want to retain it, they are actively trying to increase it. They have achieved their goal beyond all expectations, and are still able to convince a large portion of the population through their propaganda machine they deserve every penny. The chasm between the “Haves” and “Have Nots” has never been greater in U.S. history. The truth is that Americans have always admired entrepreneurs like Steve Jobs and Bill Gates who created businesses, created jobs, and ended up with vast wealth. But, that is not the wealth protestors on Wall Street and across the country are angry about. They are angry at the hyper-concentration of wealth in the hands of men that have rigged the system in their favor through bribery (lobbying & contributions), fraud (no-doc loans & AAA rated toxic derivatives), accounting schemes (special purpose vehicles & suspending mark to market) and holding the American middle class hostage (TARP & zero interest rates). When the 400 wealthiest Americans own more than the “lower” 150 million Americans put together, you have a system that is badly broken.

Do the Millennials have a right to be angry? The table below shows how the economic solutions of the oligarchy have worked out for the youth of our country. There are 19 million young people between the ages of 18 and 29 that are not working. Some are still in college, but most are not. That is a lot of potential Occupiers.

Age Group %  not employed
18 to 19 65%
20 to 24 40%
25 to 29 27%

After observing the reactions to the OWS movement over the last few weeks, I’m more convinced than ever that different generations view the same event through the prism of their own life experiences, beliefs, prejudices, and biases. I’ve found the Baby Boomers have generally been doubtful of the protestors’ motives, condescending towards their intelligence, scornful about their appearance, and derogatory regarding their flaunting of authority. This is fascinating considering that Boomers love to reminisce about their glory days protesting the Vietnam War. The Boomer generation was at this same age configuration in 1970. Their GI Generation parents probably had the same opinions about the long haired, drug using, sex crazed youthful Boomers in 1970. Now the Boomers are the establishment and they don’t like seeing their authority challenged by these naïve troublemakers. Strauss & Howe saw the likelihood of this conflict back in 1997 when the oldest Millennials were only 15 years old:

“When young adults encounter leaders who cling to the old regime (and who keep propping up senior benefit programs that will by then be busting the budget), they will not tune out, 13er-style. Instead they will get busy working to defeat or overcome their adversaries. Their success will lead some older critics to perceive real danger in a rising generation perceived as capable but naïve.” –  Strauss & Howe

The Millennials spearheading these protests are most certainly capable. In a matter of six weeks they have created a worldwide movement occupying every major city in the world. The biggest complaints coming from the Boomers is they are naïve, misguided, immature, and don’t understand the real problem. The bitter condemnation of the protestors for breaking a myriad of minor administrative laws, regulations, ordinances, and curfews is beyond laughable. Fox News, CNBC, the Wall Street Journal, NY Post and the other mouthpieces of the ruling oligarchy are apoplectic about the young protestors camping out in public parks, but they were not too concerned by the Wall Street banks systematically defrauding millions of people by creating mortgage products designed to deceive.

They weren’t irate when Wall Street held Congress hostage for a $700 billion ransom. They weren’t enraged when Ben Bernanke bought a trillion dollars of toxic mortgage debt from the Wall Street banks at 100 cents on the dollar. They weren’t furious when the government officials forced the FASB to abandon mark to market rules, allowing the Wall Street banks to falsely report their financial statements. But, they are outraged by young people exercising their right to free speech and right to assembly. When their paid armies of thugs attack the protestors with tear gas and billy clubs, they declare the protestors had it coming. It seems the 150 year old American tradition of civil disobedience to protest unjust laws, defined by Henry David Thoreau, is not too popular among Boomers or the corporate mainstream media.

“Unjust laws exist: shall we be content to obey them, or shall we endeavor to amend them, and obey them until we have succeeded, or shall we transgress them at once?” –  Henry David Thoreau 

Many of the protestors are naïve, misinformed about the true causes of the financial crisis, impulsive, and seeking solutions that would result in more government control. Their critics say they should be in Washington DC, not on Wall Street. The Boomers don’t like their flaunting of rules and regulations imposed by local authorities. Again, the older generations have conveniently forgotten how naïve, impulsive and rebellious they were at the age of 20. The amazing thing to me is this generation never showed this side during their younger years. Their slogans like “Tax the Rich” are misguided. They need assistance from older generations, but instead they are getting beaten and arrested by the older generation. Some Boomers, like William Black, have opened a dialogue with the protestors, but the majority of Boomers are resistant to the movement. In prior Fourth Turnings, the Hero archetype followed the orders of the Prophet archetype. I fear the Boomer Generation, through their intransigence and refusal to proactively address our structural problems, have set in motion a revolutionary chain of events that will lead to class warfare and possibly civil war in this country. The real danger, as experienced in other countries (France, Russia, China), is that a demagogue could gain control. Strauss & Howe envisioned that possibility in 1997:

“This youthful hunger for social discipline and centralized authority could lead Millenial youth brigades to lend mass to dangerous demagogues. The risk of class warfare will be especially grave if the 20% of Millenials who were poor as children (50% in the inner cities) come of age seeing their peer-bonded paths to generational progress blocked by elder inertia. Unraveling era adults who are today chilled by school uniforms will be truly frightened by the Millennials’ Crisis-era collectivism.” –  Strauss & Howe

The most outrageous accusation made against the protestors is they are somehow responsible for their current plight. The Boomers declare they are spoiled kids who need to get a job. A critical thinking analysis of the Millennial Generation demographics reveals how ridiculous it is for Boomers to blame Millennials in any way for our current economic debacle. There are 97 million Millennials and 54 million of them are under the age of 20. Another 21 million are between the ages of 20 and 24, barely getting started in the real world. Only 39 million of them were eligible to even vote in the last Presidential election. It should be clear to even the most dense CNBC anchor that the young people protesting in the streets are not to blame for the raping and pillaging of the U.S. economic system by the barbarians on Wall Street over the last thirty years, with the consent and encouragement of the bought off politicians in Washington D.C.

Generation Age Total Pop.(mil)
G.I. 86–109 6
Silent 69–85 22
Boomer 51–68 73
Gen-X 30–50 83
Millennial 7–29 97
Homeland – 6 29

After placing the living generations in their assigned age buckets, I was shocked to see the Millennials being, by far, the largest generation. I had assumed it was the Baby Boom Generation. At their peak in 1970 they totaled 76 million and made up 37% of the U.S. population. But, time has not treated them well. Approximately 3 million have left this earth and they only make up 24% of the population. Both Gen X and the Millennials now outnumber the Baby Boomers. They will continue to see their power wane as the years roll by. The Millennial power will grow as the Fourth Turning progresses, since they make up 31% of the population today and will see that ratio grow as the G.I. and Silent generations die off. There are very few people remaining that lived through the last Fourth Turning. The initial phase of this Crisis has revolved around the Wall Street induced housing collapse with the consequences of not enforcing the rule of law by liquidating insolvent banks and prosecuting the white collar criminals that reaped ungodly profits by committing fraud on an epic scale. This has left the country with an unsustainable level of debt, a hollowed out economy, and unemployment at Great Depression era levels, while Wall Street bankers, media titans, and career politicians reap compensation packages fit for kings. Jesse from Jesse’s Café Americain describes our political system perfectly: 

Kleptocracy:“rule by thieves” is a form of political and government corruption where the government exists to increase the personal wealth and political power of its officials and the ruling class at the expense of the wider population, often without pretense of honest service.No outside oversight is possible, due to the ability of the kleptocrats to personally control both the supply of public funds and the means of determining their disbursal. 

The Millennials were raised by parents who believed government could solve all our problems. The welfare-warfare state became monolithic during the Boomer reign of error. Therefore, it is understandable these young naïve revolutionaries still cling to the belief the government can solve our problems through more taxes or new programs. The point being missed by all the doubters and detractors of the OWS movement is these young people have zeroed in on the right culprits. They are not stupid. They understand these basic facts:

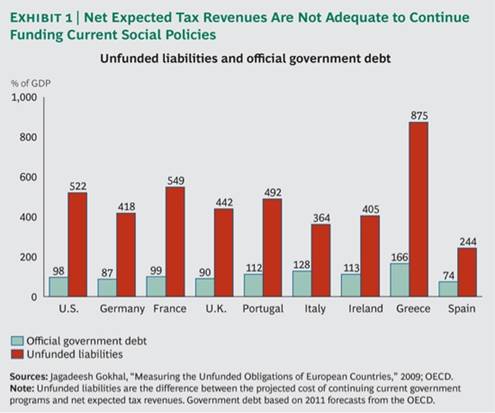
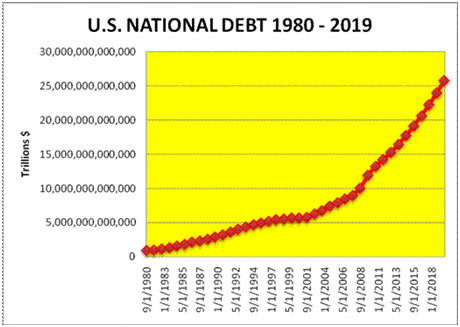
  • The $15 trillion National Debt, headed to $20 trillion by 2015, is the gift we are leaving to the Millennials.
  • The $100 trillion of unfunded entitlement liabilities will never be honored by the time the Millennials retire.
  • The Millennials know the $1 trillion per year spent maintaining our military empire is more than the next 18 countries’ spending combined, and it benefits only the corporations peddling armaments, while making us less safe.
  • The soldiers getting killed and wounded in our wars of choice in the Middle East are predominantly Millennials.
  • There are 14,000 professional lobbyists in Washington D.C. representing mega-corporations, unions, trade groups and other special interests, which have doled out $30 billion over the last decade influencing (bribing) politicians to write the laws in their favor, and not one lobbyist was working for the Millennials.
  • Millennials know Wall Street has spent $154 million on political contributions and $383 million on lobbying in the last decade. The buying of political influence by our bastions of crony capitalism was as follows: Goldman Sachs – $46 million; Merrill Lynch – $68 million; Citigroup – $108 million; J.P. Morgan Chase – $65 million; Bank of America – $39 million.
  • The Millennials know the 71,000 page Federal tax code and 140,000 pages of Federal regulations are written to protect the interests of the few, not the many.
  • Millennials know the financial industry consciously created products designed to induce mortgage fraud, knowingly packaged toxic mortgages into derivatives, bribed the rating agencies to rate them AAA, sold these worthless instruments to their customers, shorted these same derivatives, and pocketed billions in fees and ill gotten gains. After blowing up the financial system and costing taxpayers trillions, not one person has gone to jail.
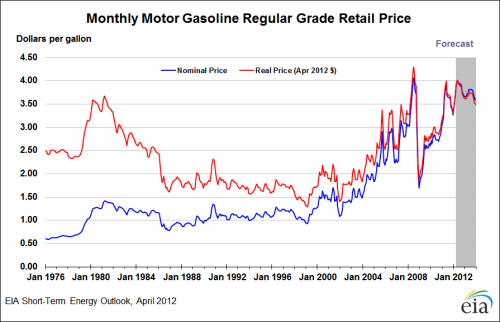
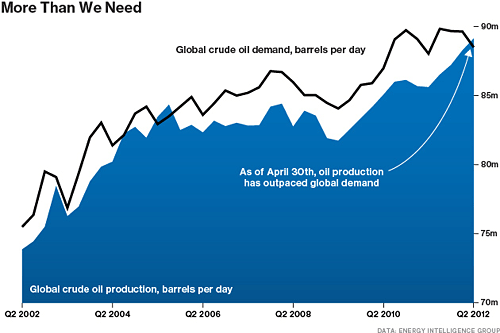
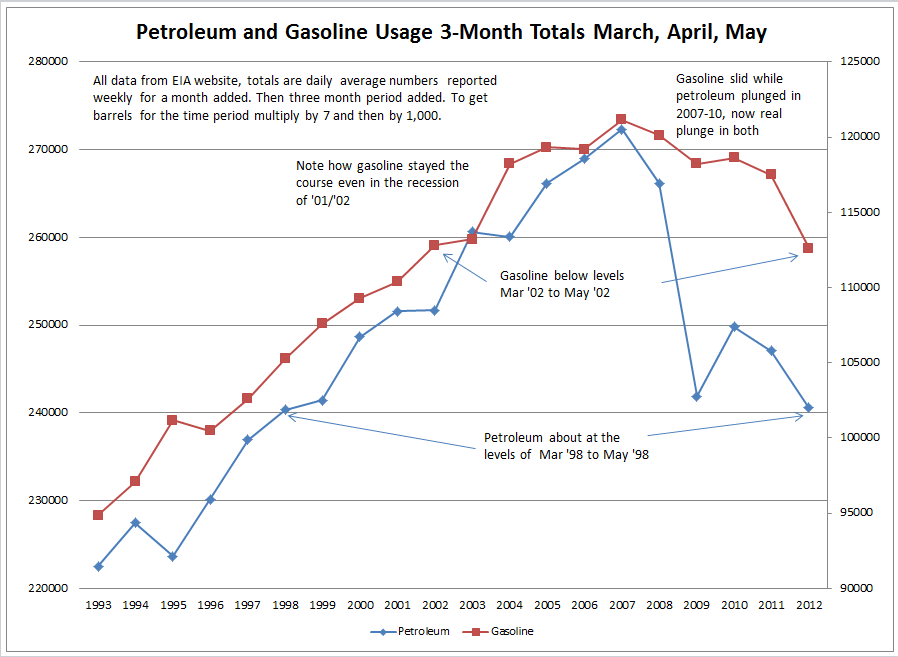
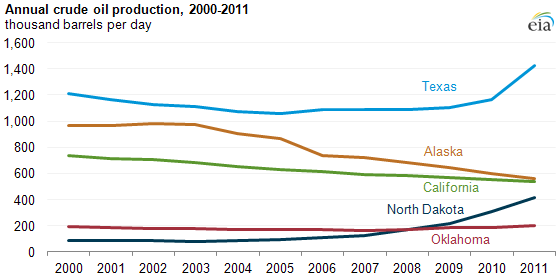
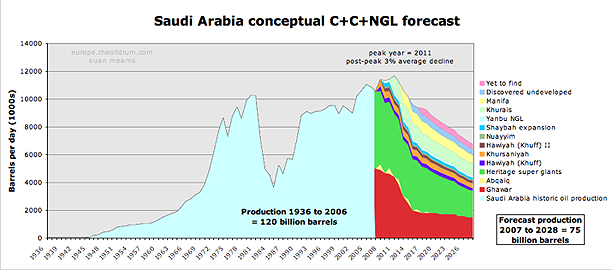
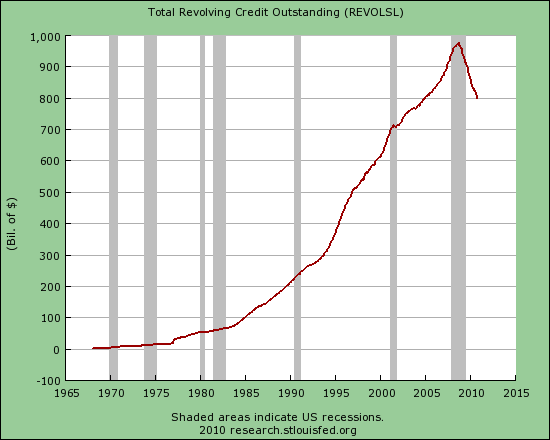
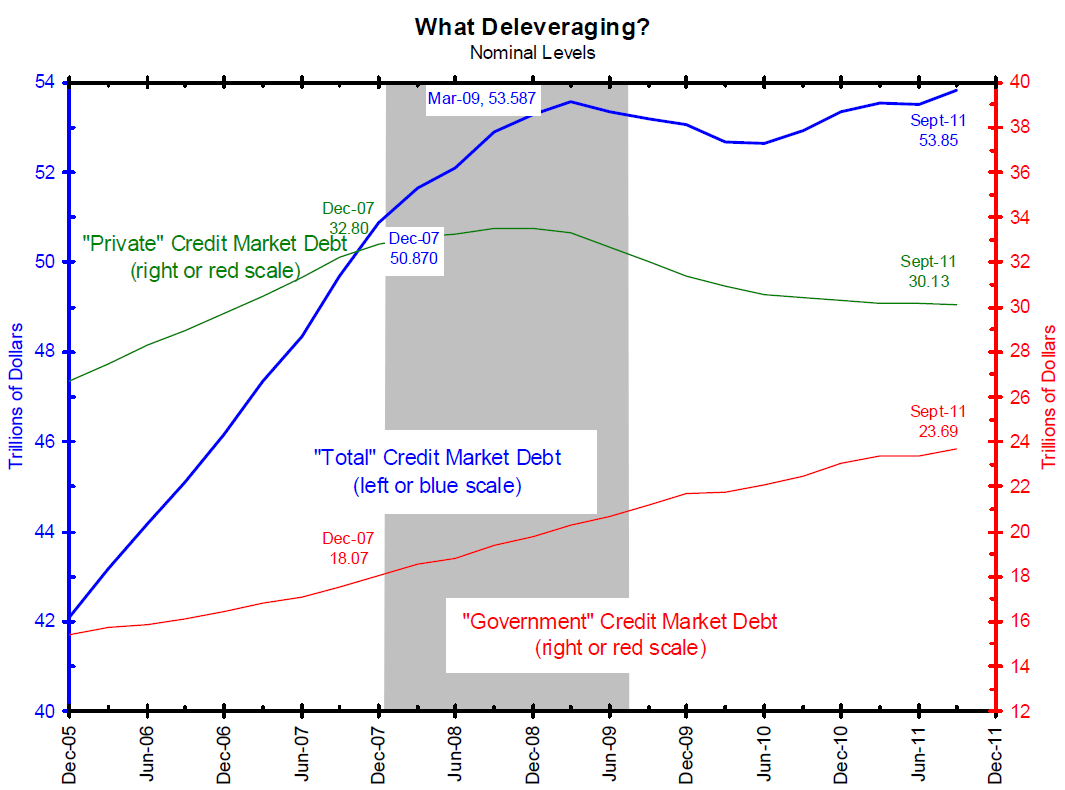
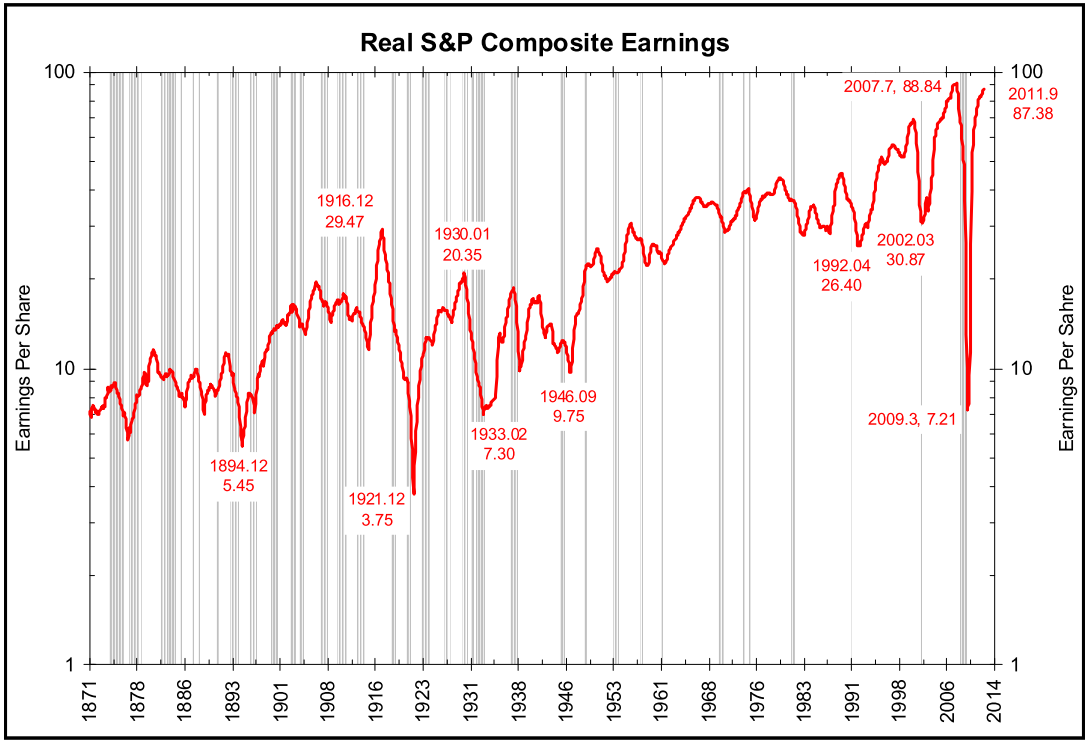
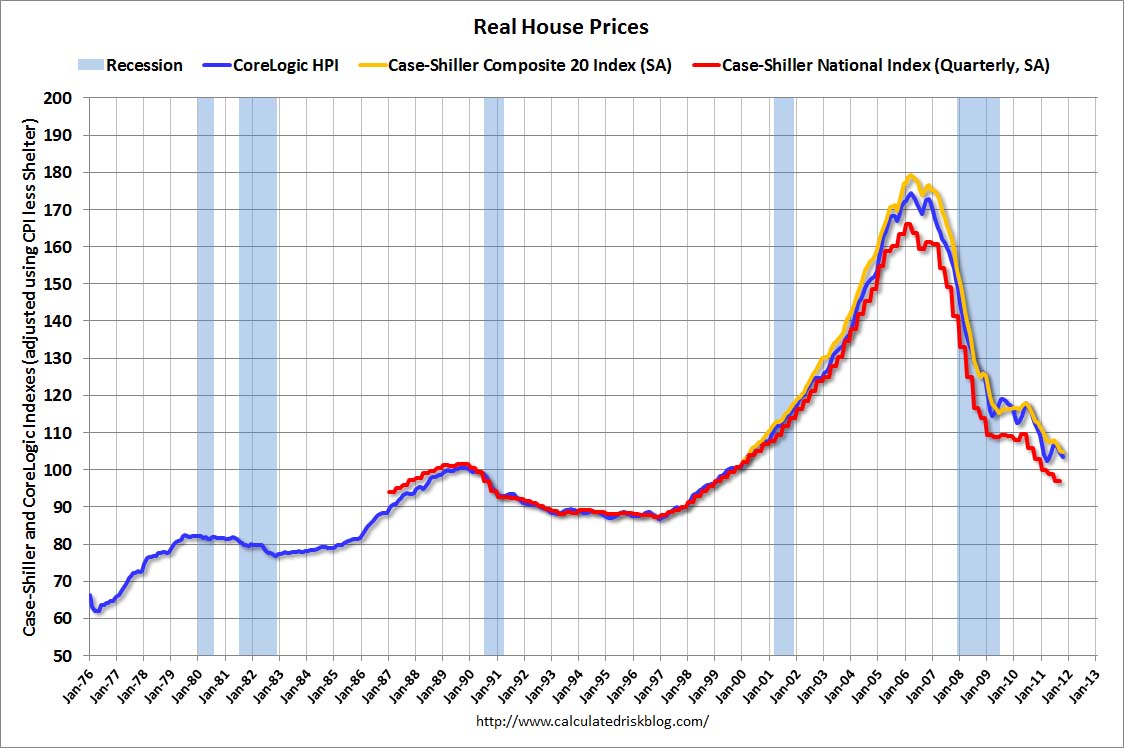
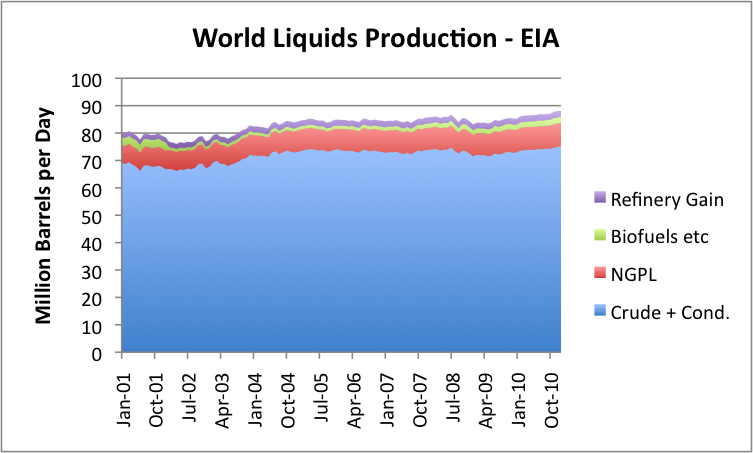
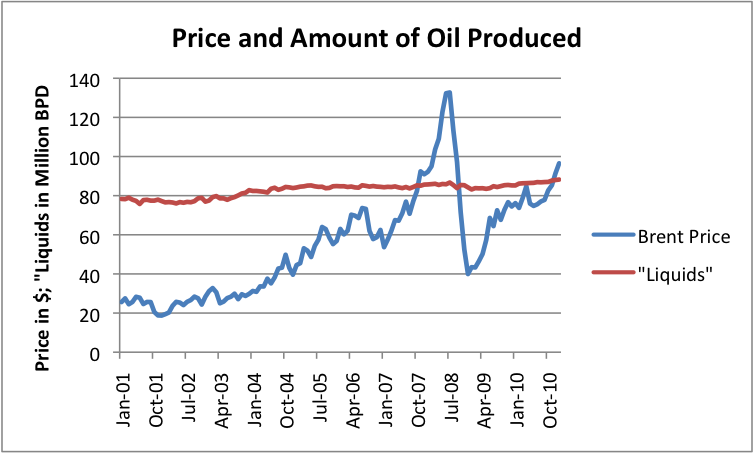
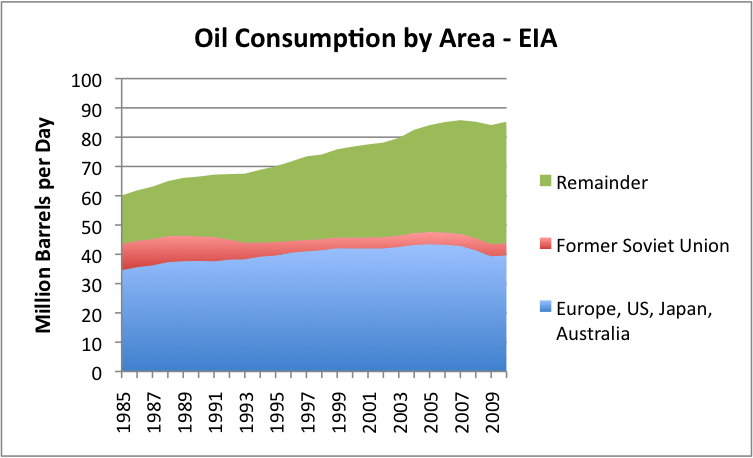
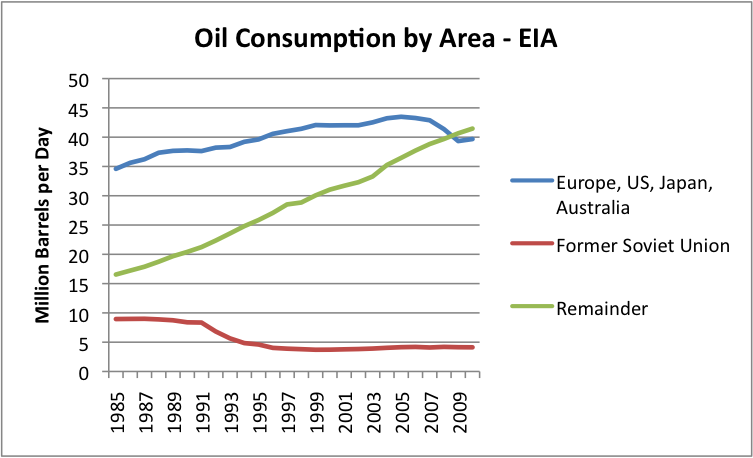
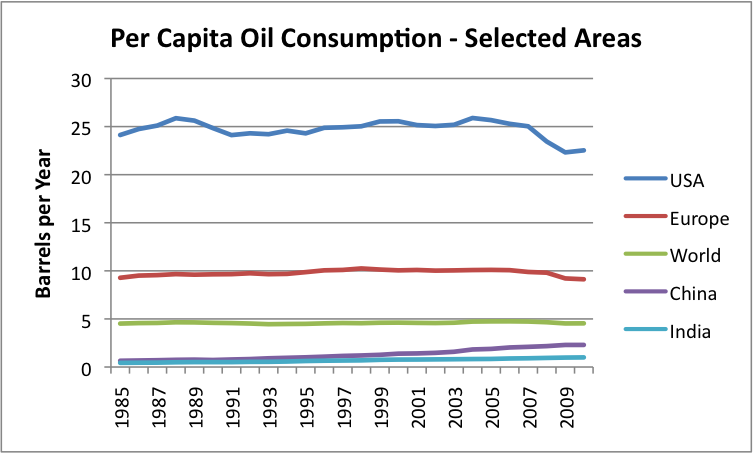
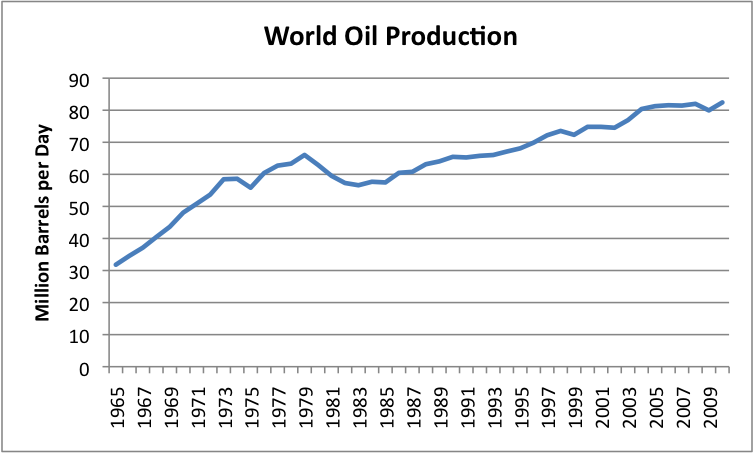
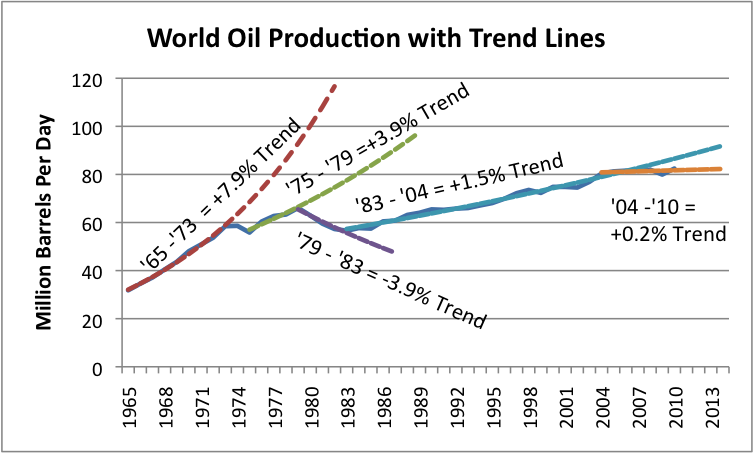
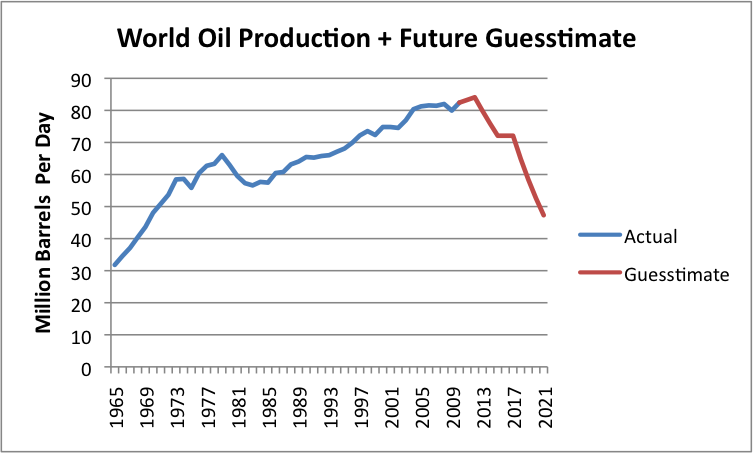
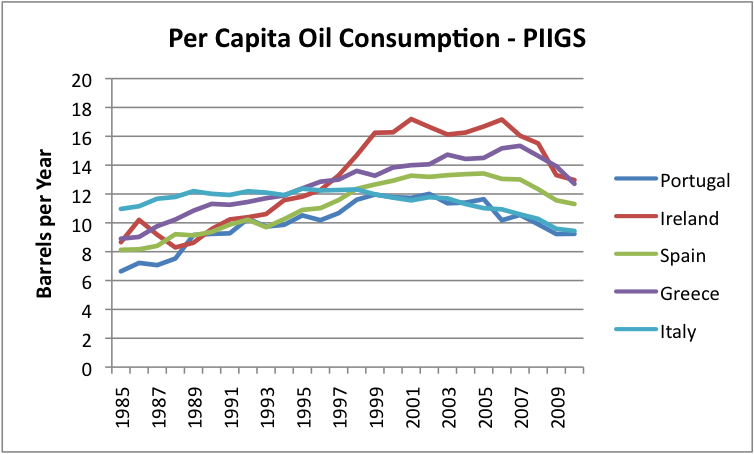
  • Millennials know how to read a chart:

  • Millennials know that Barack Obama and Mitt Romney are the same face of a never changing oligarchy. Change brought about through opposing political parties and elections has been rendered obsolete as the oligarchy chooses the candidates, uses their wealth to create policies and programs, and is able to control the masses with their propaganda message machines.

So here we stand, about five years into this Fourth Turning, with protests in the U.S. growing increasingly violent and intense. The calls for civility after the Gabrielle Giffords assassination attempt in January of this year went unheeded as the political vitriol has grown increasingly nasty. January seems like a lifetime ago. Revolutions have overthrown rulers in Tunisia, Egypt, and Libya. Unrest and bloodshed continues in Syria, Gaza, Yemen, Bahrain and Saudi Arabia. The European Union is disintegrating before our very eyes and violent protests against austerity measures flare up on a daily basis in Greece, Italy and Spain. There is no doubt we have entered the 2nd stage of this Crisis – the more violent and dangerous stage. I can sense fear and uneasiness among the more connected members of society. The drones, which constitute a large portion of America, are highly focused on Kim Kardashian’s divorce after 72 days and a $10 million wedding. The Millennials leading the protest movement are connected. They understand what is at stake. Strauss and Howe had it figured out 14 years ago:

“Of all today’s generations, the Millenials probably have the most at stake in the coming Crisis. If it ends badly, they would bear the full burden of its consequences throughout their adult lives. Yet if the Crisis ends well, Millenials will gain a triumphant reputation for virtue, valor and competence.” – Strauss & Howe

So what happens next? The truth is that no one knows what will happen next. We can only try to connect the dots and peer into a foggy future. We know that our leaders have not solved any of the financial imbalances that existed in 2007. They have made them worse, as have leaders across the world from China to Japan to Europe. We await the next Lehman moment, except this time it will be a sovereign nation and the contagion will be ten times greater than the 2008 meltdown. Our already fragile economy will be brought to its knees in a replay of the 1930s. As nations plunge into economic chaos, civil strife will likely lead to authoritarian figures rising from the ashes of the turmoil. Could Russia and China take advantage of this turmoil to acquire new resources through military means? Possibly. When the American middle class sees their remaining wealth dwindle to nothing, will they take to the streets? Revolution seems too remote to fathom, but it seemed remote in 1764 and 1855 too. When people have nothing left to lose, anything is possible. The collapse of our economic system is baked in the cake. Our current fiscal path is destined to end in fatality. Strauss & Howe knew the outcome of this Fourth Turning would depend upon the wisdom, strength and fortitude of the American people:

 “The risk of catastrophe will be very high. The nation could erupt into insurrection or civil violence, crack up geographically, or succumb to authoritarian rule. Thus might the next Fourth Turning end in apocalypse – or glory. The nation could be ruined, its democracy destroyed, and millions of people scattered or killed. Or America could enter a new golden age, triumphantly applying shared values to improve the human condition. The rhythms of history do not reveal the outcome of the coming Crisis; all they suggest is the timing and dimension.” – Strauss & Howe

Winter has arrived. There will be difficult hurdles with many trials and tribulations in front of us. You may have to choose sides in a generational war. No one wants to face bitter choices. No one wants bloodshed and war. But it really doesn’t matter what we want. There is no real justice in a country that attacks and incarcerates young people for exercising their right to free speech and dissent, while allowing a psychopathic Wall Street banking cartel to wreak havoc upon our nation. The generational alignment is such that the existing social order will be swept away in a violent manner. What replaces the existing order will be up to the American people. You may lose your wealth, security, freedom, or life during the coming struggle. The years ahead will require steely determination and courage like our forefathers exhibited on the frigid barren fields at Valley Forge, the undulating wheat fields at Gettysburg, and the bloody beaches of Normandy. I have three teenage sons at home. My choices will be dictated by what I feel will be best for their futures. I will do WHATEVER it takes to secure a better tomorrow for my boys. If that means standing beside them in battle, so be it. Lines are being drawn. You will not be able to avoid choosing sides, just as you cannot avoid Winter if you ever want to see the dawn of another Spring.


“History offers no guarantees. We should not assume that Providence will always exempt our nation from the irreversible tragedies that have overtaken so many others: not just temporary hardship, but debasement and total ruin. Since Vietnam, many Americans suppose they know what it means to lose a war. Losing in the next Fourth Turning, however, could mean something incomparably worse. It could mean a lasting defeat from which our national innocence – perhaps even our nation – might never recover.” – Strauss & Howe


WOULD YOU LIKE A LITTLE OIL WITH THAT VINEGAR?

Another great article on Peak Oil from Gail the Actuary on  http://www.theoildrum.com/. If her assessment of oil production between now and 2021 is even close to accurate, we’re in a world of hurt. Impartial articles like this one should convince the most delusional peak oil denier that their drill,drill, drill mantra is nothing but hot air. I hadn’t seen the figure she stated as being the current cost for a barrel of oil to be produced in the Middle East as $95. That would appear to put a floor on the price of oil at a level above $95.

The good news is that our oil consumption will decline as soon as the price gets high enough to push our country back into recession. We are just about there. So, oil prices will decline again, but the low price this time will be much higher than the last low. This is the bumpy plateau. Supply and demand sure is a bitch. Expect some more humanitarian invasions of Middle East countries sitting on top of our oil.

My little peak oil widget just passed the 10 billion barrels consumed level for the year so far. I wonder if we discovered 10 billion new barrels during this same time frame.

Peak Oil – April 2011 Update

Posted by Gail the Actuary on May 2, 2011 – 1:27pm
The US Energy Information Administration’s January oil production figures are out, and they show record oil production. Where are we headed from here?


Figure 1. World “Liquids” Production through January 2011, based on Energy Information Administration data. 

While production for January is up a bit (219,000 barrels compared to December), the monthly numbers bounce around a fair amount because of planned maintenance. They are also subject to revision. Figure 2 seems to indicate that the production amounts are trending upward a bit, probably in response to the recent higher prices. 


Figure 2. Monthly average Brent Oil price and total “liquids” produced, both from US Energy Information Administration. 

The amounts in Figures 1 and 2 are not entirely up to date, since they are only through January 31, 2011. All of the disruption in the Middle East started at the very end of January, and the disruption in Libya’s supplies did not start until February.  The earthquake in Japan took place March 11. OPEC estimates that OPEC and world oil supply fell in both February and March, with Libya’s production falling by 1.2 million barrels a day between January and March, with only small supply increases elsewhere offsetting this. World oil prices continue to be high. At this writing, West Texas Intermediate is about $111.50 a barrel; Brent is about $122. 

So what do we expect going forward? 

Eventual Decline, but not Following a Hubbert Curve 

It seems to me that the story about what happens in the future with oil supply is much more complex than what depletion and new supply alone would suggest. As I explained in a previous post (Our Finite World version and Oil Drum version), the actual downslope is likely to be steeper than what a Hubbert Curve would suggest, because economies of many importing countries are likely to be adversely affected by rising oil prices, and because demand (and tax collections) are likely to be low in countries that lose jobs to countries that use oil more sparingly. 

Hubbert assumed that nuclear or some other cheap alternative form of energy would allow business to go on pretty much as usual without oil. We know now that we are close to the downslope, but no inexpensive alternative has been developed in quantity. Because of this, actual production is likely to be less than the amount that is theoretically possible. This happens because of indirect impacts of inadequate oil supply, such as recession when prices oil prices rise; riots when food is in short supply; and inadequate demand for oil because of jobs move overseas to countries using less oil, leaving many unemployed. 

In some sense, if oil prices could rise indefinitely, we would never have a peak oil problem. The high prices would either stimulate production of alternative types of energy or would enable oil production in areas where oil is very costly to extract. The indirect impacts mentioned above prevent oil prices from rising indefinitely.  These indirect impacts seem to be related to inadequate net energy for society as a whole. Theoretically, if oil prices could rise indefinitely, we could even end up using more energy to extract a barrel of oil than really is in the barrel of oil in the first place–something that is hardly possible. The fact that rising oil prices lead to impacts that tend to cut back demand seems to be a way of keeping prices in line with the energy the oil actually provides. 

Which countries are able to buy the oil that is produced? 

If we look at oil consumption by area, we find the following: 


Figure 3. Oil consumption by area, based on EIA data. 

It is clear from Figure 3 that consumption of my grouping called “Europe, US, Japan, and Australia) is much flatter (and recently declining) than that of the “Remainder.” The Remainder includes oil exporting nations, plus China and India and other “lesser developed” countries, many of which are growing more rapidly than countries like Europe, US, Japan, and Australia. 

I have plotted the same data shown in Figure 3 as a line graph in Figure 4. The latter figure shows even more clearly how different the oil use growth rates have been. 


Figure 4. Data from Figure 3, graphed as a line graph, instead of a stacked area chart. 

If world oil supply is close to flat (shown in Figures 1, 2, and 3), Figure 4 shows that we have a potential for a real conflict going forward. The “Remainder” countries in Figure 4 will want to continue to increase their oil usage in future years, even if oil supply remains flat. This is likely to lead to considerable competition for available oil and high prices, such as we are seeing now. About the only way the “Remainder” countries can increase their oil usage is if oil usage by the “Europe, US, Japan, and Australia” group declines. 

Many people believe that the only alternative to adequate oil supply is for the amount of oil produced by oil companies to fall and because of this, for shortages to result. While this scenario is possible, especially in the presence of price controls, in this post we show another way that oil consumption can be limited. 

A very common way that oil usage (consumption) can be expected to decline is if high oil prices induce a recession. The countries that seem to be most susceptible to recession are countries that are (1) oil importers and (2) are heavy users of oil, since an increase in oil price has the most adverse impact on the financial health of these countries. When recession is induced, there are layoffs. These layoffs reduce oil usage in two ways: (1) less oil is used for making and transporting products that these workers would have made, and (2) the laid off workers are less able to afford products using oil, so reduce their purchase of oil products. 

Because of this relationship, competition for oil is likely to be very closely related to competition for jobs in the future. The countries that get the jobs can be expected to get a disproportionate share of oil that is available. 


Figure 5. Per Capita Energy Consumption, based on EIA data. 

If we look at per capita oil consumption (Figure 5) on a world basis, it has been close to flat since 1985, because oil production until very recently rose enough that oil growth more or less corresponded to population growth. China and India’s per capita oil consumption rose, meaning that the oil consumption of someone somewhere, such as the Former Soviet Union, needed to decline. 

Future Oil Supply 

If we look at historical oil production (Figure 6), it has been fairly “bumpy”: 


Figure 6. World oil production for crude, condensate and natural gas liquids. 1965-2009 from BP; 2010 from EIA. 

By fitting trend lines, we can see where oil production seems to be headed: 


Figure 7. World oil production from Figure 6, with fitted exponential growth trend lines. 

What we can see from Figure 7 is that the growth rate of world oil supply has gradually been slowing. The growth rate was highest in the 1965 to 1973 period, at 7.9% per year. Then we hit the “oops” period of 1973 to 1975, when we ran into conflict with OPEC regarding oil supplies. The trend rate dropped to 3.9% in the 1975 to 1979 period. Between 1979 and 1983, oil consumption dropped to a -3.9% per year, when we picked some of the low hanging fruit regarding oil usage (mostly by eliminating petroleum from electricity generation and downsizing automobiles). The trend between 1983 and 2004 shifted to +1.5% per year, and since 2004, seems to be about +0.2%. 

There are so many countries involved, that it is not easy to identify one country or area that is rising, but one country of note is Iraq. Its production in January, 2011, seems to be up by 300,000 barrels per day, relative to mid-2010, based on the latest data. Thus Iraq seems, for now, to be helping to keep world oil production flat, or even growing by a bit, despite increasing depletion elsewhere. 

Looking at Figure 7,  it looks like the “trend” in trend rates over time is down. In the absence of other information, we would expect production to remain at its recent trend rate of 0.2%, or alternatively, the trend rate could take another step downward, probably to an absolute decline in oil production. A recent announcement from Saudi Arabia suggests that its ability to offset declines elsewhere in the future is likely to be virtually nil, so a continued decline in production from the North Sea and elsewhere will need to be made up with new production elsewhere, or will lead to a worldwide decline in oil production. 

World population has been growing. If oil production remains flat or declines, and world population grows,  this means that someone has to be a loser, in terms of per capita consumption. I am not certain how this will turn out, but I see at least three forces that may come into play: 

1. Countries may figure out that permitting jobs to move to less developed countries is not in their best interests, and start increasing protectionism. This will tend to keep demand more level (higher for importers, and lower for growing economies). The overall impact on oil demand is less clear–less oil will be needed for long-distance transport, but more oil will be needed to maintain current lifestyles of workers. 

2. Countries that are in financial difficulty may find themselves increasingly shunned, as they seek to “restructure” their debt, and may find themselves increasingly cut off from buying oil products and the goods that that are made using oil products. This will tend to reduce aggregate world demand for oil, by reducing consumption in specific countries that have financial difficulty. 

3. There may be recession affecting a number of countries, reducing their demand for oil. We don’t know how exactly that this will change the shape of the world oil production curve, but Figure 8 shows my very rough guess as to how supply might be affected. (Your view may differ.) 


Figure 8. Historical crude, condensate, and NGL production based on BP and EIA data, plus a Guesstimate of Future Oil Supply. 

It seems to me that as we go forward, we are likely to see a jagged pattern in oil production decline, reflecting a combination of less demand for high-priced oil as oil supplies continue to be very tight, except at high prices. In addition, some countries can be expected to increasingly drop out of competition for oil, as their financial situations deteriorate. Thus, the pattern for decline in oil consumption can be expected to vary significantly from country to country, depending on their policies and their financial conditions. 

Clues as to Which Countries May Drop Out First 

If we look at the per-capita consumption of the PIIGS countries, we see that for the most part, these were countries that increased their consumption of oil, and then were not able to maintain the increase. 


Figure 9. Per capita oil consumption of PIIGS countries, based on EIA data. 

The difference is quite striking when we compare per-capita oil consumption to a few of the non-PIIGS European countries. 


Figure 10. Per capita oil consumption of selected European “non-PIIGS,” based on EIA data. 

Why is there such a different pattern between the PIIGS and the non-PIIGS? I haven’t researched the situation extensively, but it would seem as though the PIIGS countries tended to be agricultural countries that tried to develop more diversified (oil intensive) economies. They expanded and incurred a lot of debt, and now this debt is becoming difficult to pay back. As far as I can see, this economic growth was not based on the growth of stable, fairly cheap supply of electricity, such as hydro-electric or coal. Instead, growth depended fairly heavily on oil use, and the cost of oil rose. It may be that part of this growth in oil use occurred because of an improvement in standard of living–more cars, more vacations, bigger homes. 

My working hypothesis is that when oil prices went up, the economies of the PIIGS countries had too much debt for the new industries to provide enough revenue to service both the higher costs of oil and the debt costs. Countries which didn’t try to grow in this way didn’t have as much difficulty, although high oil prices are still a burden for them. They may eventually run into debt problems, just a little later. 

What are China and India and some of the other countries that are growing rapidly doing differently, that their economies haven’t collapsed? One thing they have going for them is the fact that their oil usage is at a vastly lower level, even after rapid growth. Another thing that they often have going for them is growing electricity production, using an energy source that is relatively cheap. In the case of China and India, this is mostly coal; in the case of some of the other lesser developed countries, it is hydro-electric. 

It seems as though at some price, each country will hit recessionary pressures and drop back in its demand for oil. This price will vary by country, depending on the country’s current debt situation, the extent to which the country can continue to “grow” its economy based on a growing source of cheap electricity, and how well international trade holds up with increased protectionism and higher oil prices. Countries depending on growing hydroelectric and coal-fired electricity are likely to hit limits, too, as these supplies reach natural limits. 

One situation which may affect how long oil prices can stay high for the United States is the existence of QE2, or “Quantitative Easing 2.” This seems to keep the dollar low relative to other currencies, thus allowing commodities prices to remain high. QE2 is scheduled to end June 30, or earlier. If it is allowed to expire, it would seem as though interest rates could rise materially (because QE2 also keeps interest rates low), and could lead to a rapid deterioration in the financial condition of the United States. If this should happen, it would seem as though the United States could be one of the countries that enters recession and significantly decreases its demand for oil. Of course, high oil price by itself may lead to this outcome quite soon, also. 

We cannot know how all of these forces will play out. Generally, I would expect that there will continue to be an upward push on the price for oil because of rising extraction costs, and because unrest in the Middle East is causing countries to provide additional benefits for their citizens, further raising their costs (estimated to be $95 barrel by the Wall Street Journal). As long as the world economy is expanding, rising demand will also tend to pull oil prices upward, because many countries are trying to compete for a supply of oil that is barely growing. 

The various countries around the world can be expected to be in differing positions with respect to their ability to pay high oil prices. Gradually (or not so gradually), the weakest ones will be pushed away from buying oil, either because of debt defaults and shunning by exporters (unless they have goods to trade in return), or because of recession, or both. World oil production seems likely to decline as the number of countries that can afford to continue to purchase high-priced oil declines. Ultimately, oil consumption can be expected to drop to close to 0, because no country will be able to afford to buy very much oil at a high price, and because oil companies will not be able to maintain necessary infrastructure for a very limited supply of oil. 

I don’t think that we can expect an analysis of the theoretical capacity of future world oil production to tell very much of the peak oil story. We really don’t know how much of the oil which seems to be available will actually be produced. A lot of the story will depend on the ability of individual countries to keep their economies in good enough shape that they can afford to buy high-priced oil. Many residents of countries that are shut out from oil supply are likely to find that oil products are not available at any price. 

Originally published on Our Finite World.