U.S. Financial Death Spiral

Guest Post by Greg Hunter’s USAWatchdog.com

Analyst and financial writer John Rubino has a new warning about being fooled into thinking the economy is improving because inflation and interest rates have fallen some recently.  Rubino says, “If the U.S. government is running crisis level deficits, which it is right now, borrowing money and paying interest on it means we are in a financial death spiral.  The debt goes up, the interest on the debt goes up and that raises the debt even further, and you just spiral out of control.  We are there right now.  The official U.S. debt is $33.5 trillion.  It’s growing by $1.7 trillion a year, and $1 trillion of that is interest costs.

Continue reading “U.S. Financial Death Spiral”

Imploding Pensions Take The Rest Of US Down With Them

Guest Post by John Rubino

It’s the same story pretty much everywhere: Cities and states promised ridiculously generous (by today’s standards) pensions to teachers, cops and firefighters, failed to sufficiently fund the plans and invested the money they did have very badly. And now the weight of the resulting unfunded obligations are crushing not just plan recipients but entire communities. Here’s a representative case:

Oregon PERS unfunded liability swells to $21 billion

(KTVZ) – This week, Oregon’s Public Employee Retirement System Board received an earnings report on the status of the PERS fund investment. The report said Oregon’s PERS fund fell by 4 percent in 2015, a loss of nearly $3 billion — and a Central Oregon lawmaker said that means major reforms are more urgent than ever.“The blow to PERS from the Moro court case left Oregon with an additional $5 billion in unfunded liability,” Sen. Tim Knopp, R-Bend, said Tuesday. “Now PERS is an additional $8 billion short of its target.”

In that ruling nearly a year ago, the state Supreme Court overturned the vast majority of the PERS reform cost-saving provisions enacted by the 2013 Legislature.

The current unfunded PERS liability now exceeds $21 billion, up from $18 billion last year, he noted.

PERS Communications Director David Crossley said while the PERS fund earned just over 2 percent last year, it did not achieve the “assumed savings rate” of 7.75 percent, so the liability increased by about $3 billion.

He noted that PERS had positive earnings, but lost value because it pays out about $3.5 billion in benefits a year.

PERS rates for school districts and local governments will rise in July 2017, Knopp said, forcing school districts to lay off teachers, reduce school days, increase class sizes, and cut programs like art and PE. Local governments will also have to make cuts to public safety and other critical services.

This combination of worse-than-expected investment returns and legal barriers to cost savings is playing out across the country. See Fitch downgrades Chicago after “worst possible outcome” in state supreme court pension reform bid.

What follows — “…forcing school districts to lay off teachers, reduce school days, increase class sizes, and cut programs like art and PE. Local governments will also have to make cuts to public safety and other critical services” — is also playing out in most states and cities.

And this, remember, is at the tail end of an epic bull market in financial assets. If pension plans aren’t fully funded now, they’ll fall into an abyss in the coming correction.

Continue reading “Imploding Pensions Take The Rest Of US Down With Them”

Another Atrocious Week Going Out With A Bang

Guest Post by John Rubino

On days when lots of financial numbers are released, the normal pattern is for some to point one way and some another, giving everyone a little of what they want and overall presenting a reassuringly muddled picture of the economy.

Not today. A wave of economic stats flowed out of Washington, almost all of them terrible, while corporate news was, in some high-profile cases, shocking. Let’s go to the highlight reel:

Retail sales fell again in December, bringing the 2015 increase to just 2.1% versus an average of 5.1% from 2010 through 2014. This kind of deceleration is out of character for year six of a gathering recovery, but completely consistent with a descent into recession.

The New York Fed’s Empire State Manufacturing Survey index plunged to -19.37 in January from -6.21 in December. This is a recession — deep recession — level contraction. Not a single bright spot in the entire report.

U.S. industrial production fell for the third straight month in December, and the previous month was revised down sharply. Factories are already in a recession that appears to be deepening.

On the company-specific front:

UK resource giant BHP Billiton wrote down the value of its US shale assets by $7.2 billion — two-thirds of its total investment — in response to plunging oil prices. Now everyone is wondering who’s next, and the list of likely candidates spans the entire commodities complex.

Chip maker Intel reported okay earnings but really disappointing margins and outlook. Its stock is down 9% as this is written mid-morning.

Walmart is closing nearly 300 stores and laying off most of the related 16,000 workers. It also cut its forward guidance aggressively.

There’s more, much of it related to plunging oil prices and their impact on developing world economies. For countries that grew temporarily rich on China’s infrastructure build-out, the end of that ill-fated program has produced something more like a depression than a garden-variety slowdown.

Continue reading “Another Atrocious Week Going Out With A Bang”

More Ominous Charts For 2016

Guest Post by John Rubino

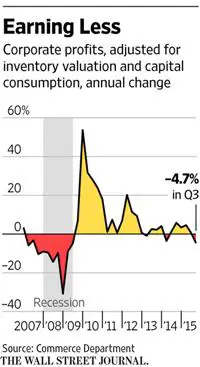
If 2015 was the year in which no investment strategy worked, 2016 is looking like the year in which all economic policies fail. Already, at what should be the blow-off peak of a long expansion, US corporate profits are instead rolling over:

Corporate profits

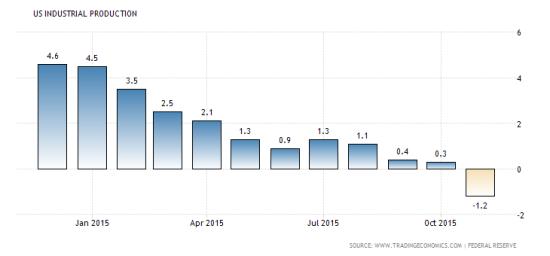
In recent quarterly reports, most companies blame their dimming fortunes on the strong dollar’s impact on foreign sales, an assertion that’s borne out by recent declines in industrial production. We’re selling less real stuff abroad, so factories are making less:

US industrial production Jan 16

The huge bright spot in an otherwise bleak manufacturing landscape is auto sales, which have snapped back nicely:

Continue reading “More Ominous Charts For 2016”

The “Real Stuff” Economy Is Falling Apart

Submitted by John Rubino via DollarCollapse.com,

Each month one or two high-profile government reports show the US is growing, adding jobs and generally recovering from the Great Recession. But it’s not clear how that can be, when the part of the economy that makes and moves real things keeps shrinking. Here’s a chart, published recently by Zero Hedge, showing that US manufacturing has been contracting for the past year:


Meanwhile, the companies that move physical things around are falling hard:

Continue reading “The “Real Stuff” Economy Is Falling Apart”

Wow, They Really Are Tapering

Guest Post by John Rubino

In the sound-money community there is universal skepticism about the Fed’s plan to stop monetizing the world’s debt. Hardly anyone thinks they’ll go through with it and absolutely no one thinks they’ll succeed if they do.

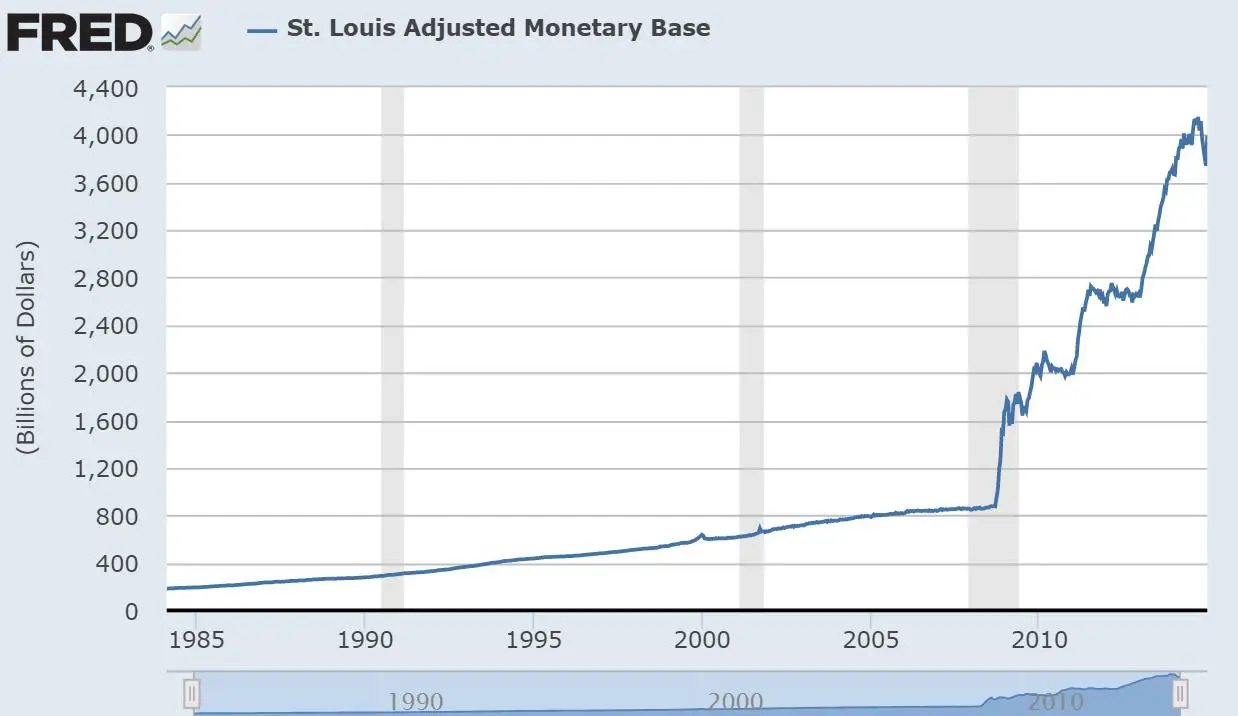
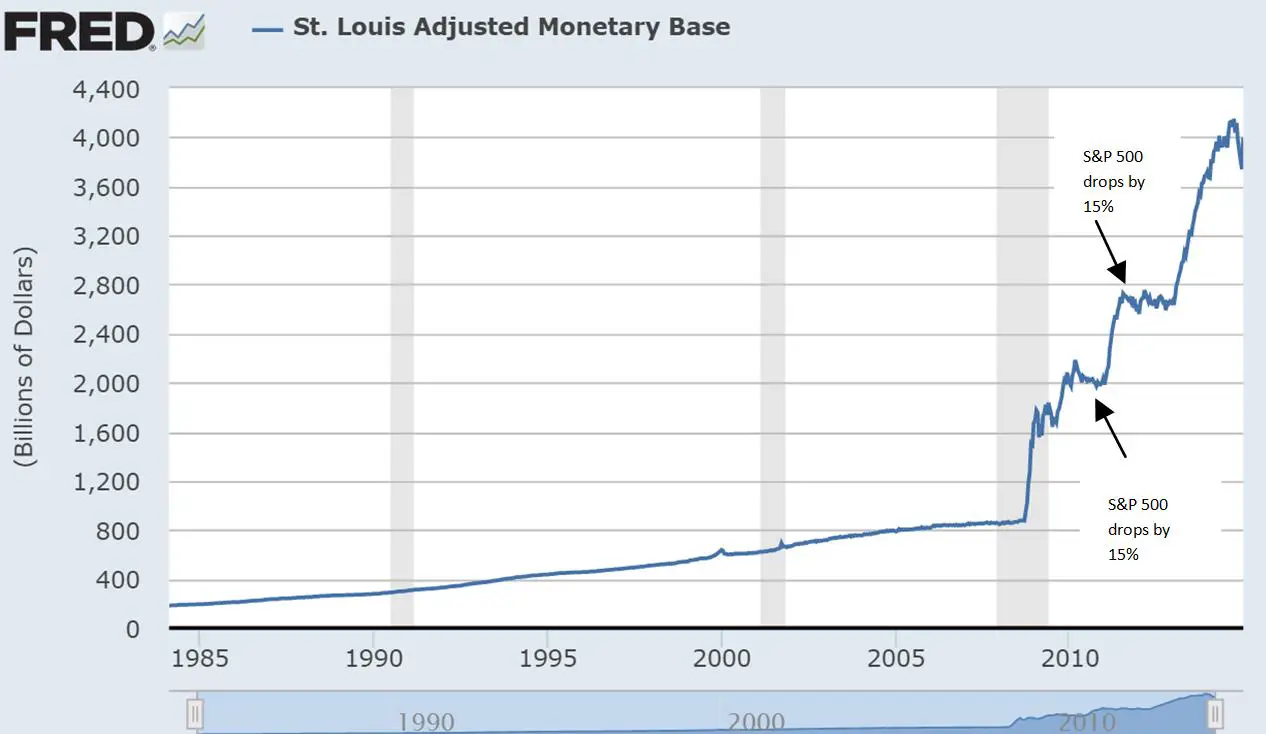
But the Fed is acting like it’s serious. Take a look at the monetary base, which is the amount of new currency that’s been created and pumped into the banking system. The trajectory since the 2008 crash tells you all you need to know about the “recovery,” which turned out to be just the Fed printing money and a few mostly rich people spending some of it. But check out the far right edge where the line turns negative. Not wildly negative, but still, the Fed does appear to have stopped adding and started subtracting. The money supply is falling.

Monetary base 2015

This kind of tightening would normally coincide with — or cause — rising interest rates. But that’s not yet part of the plan, so even in the face of manifestly tighter money, interest rates have been allowed (or forced) to decline.

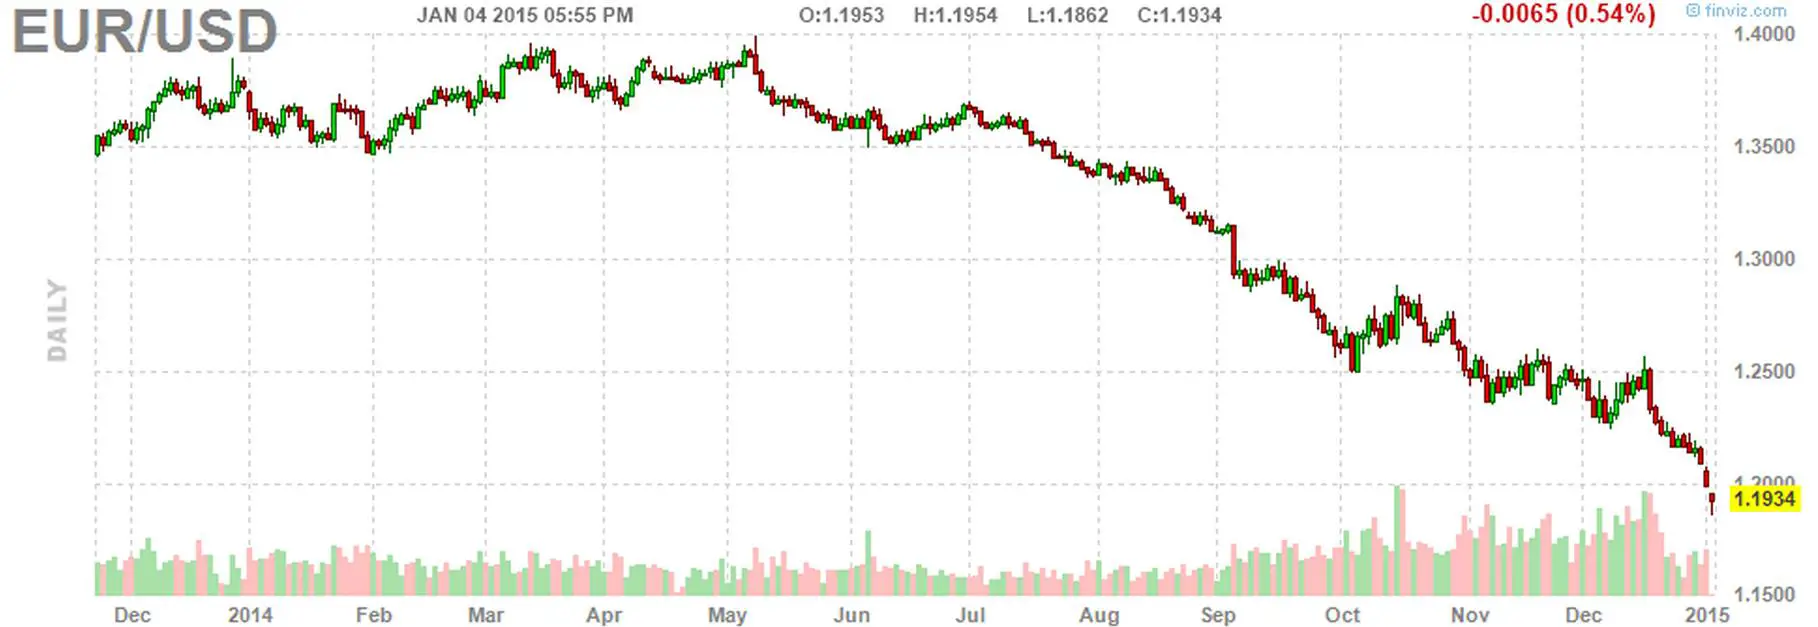
But the pressure of tighter money has to be released somewhere, and in this case it’s been the foreign exchange market. The euro, for instance, has tanked since mid-year.

Euro Jan 2015

Every other major currency is down as well, which is the same thing as saying that the dollar is up big. And a rising currency is functionally the same thing as higher interest rates. Consider: If you borrow money you have to pay back the principal plus interest. A higher interest rate obviously makes the loan harder to repay. But so does a rising currency because in order to pay dollars to a creditor you have to get those dollars, and if they’ve become more valuable in the meantime you have to pay up.

So the US is experiencing two of the three symptoms of tighter money: a falling money supply and rising currency. Will we eventually get the third, rising interest rates? That would be interesting to say the least. To understand why, let’s revisit the monetary base chart, with the addition of arrows showing what the stock market did during the previous two attempts at tapering. It tanked — or at least started to tank — and the government relented.

Monetary base plus stocks

Note that during those other two taper attempts the monetary base didn’t fall much if at all, and the dollar didn’t rise to anything like its current level. In other words, the Fed didn’t actually tighten, it just stopped loosening. This latest iteration is already more serious than the two that came before.

So either another stock market scare is coming, and soon, or the economy has finally achieved the fabled escape velocity in which it can grow under its own power without help from performance-enhancing monetary drugs. We should know the answer soon.

Spoiler alert: The sound-money crowd is right. This ends very badly.


Scenes From a (Suddenly) Nude Beach

Guest Post by John Rubino

Warren Buffett’s classic observation that “You only see who’s swimming naked when the tide goes out” is being tossed around more frequently these days, as the world gets yet another deflation scare. Zero Hedge just published a great piece on this topic, which should be read in its entirety. In the meantime here’s a summary of the story with a few added bits.

Let’s begin with the common sense premise that overly-easy money sends a false-positive signal to market participants, leading them to buy and build things that maybe shouldn’t be bought or built. Then, when money goes back to a more reasonable price, the bad decisions (malinvestment in economist-speak) are revealed and financial turmoil ensues.

Today’s situation has its roots in the 1980s, when the developed world got too lazy to live within its means and started borrowing way too much money. It then tried to inflate away its debts by creating a tidal wave of new currency and pushing interest rates down to unnaturally low levels. Flush with extra cash and cheap credit, consumers (especially in the US) bought huge amounts of imported junk. This in turn led China — the main producer of said junk — to go on an infrastructure/factory building spree of epic proportions, which shifted into hyper-drive after the 2008 crash. Chinese demand for industrial materials like copper, iron ore, and oil soared, pushing their prices far above historical averages.

This in turn led miners and drillers to mine and drill on an unprecedented scale, which caused the supply of industrial materials to surge. The flashiest case in point is the US shale oil boom, which sent domestic oil production back to levels not seen since Texas’ blockbuster oil fields were young.

But it was all a money illusion, and every part of this process has recently hit a wall. Consumers refuse to go more deeply into debt to buy non-necessities, even when money is nearly free. Faced with lower demand and poor cash flow from the past decade’s overbuilding, China has tapped the brakes on its infrastructure build-out. The US is trying to stop monetizing its debt, which has sent the dollar through the roof on foreign exchange markets, thus making life even harder for about half the world’s population.

As a result of the above, demand for basic materials is returning to normal levels, which, in the face of inflated supply, is tanking prices across the commodity complex.

In other words the tide has gone out, leaving a whole beach full of naked (and unfortunately not very attractive) bodies. Specifically:

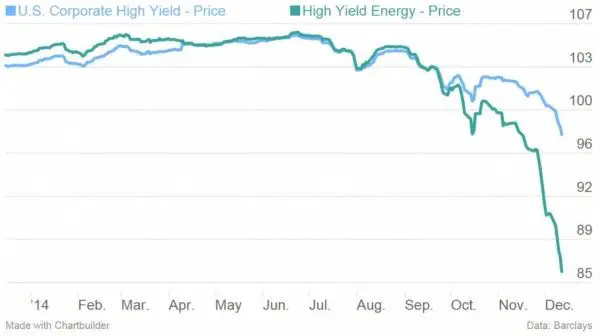
Shale oil junk bonds. Back when oil was over $100 a barrel, everybody wanted to lend to drillers, especially in the exotic (and as it turns out fatally-flawed) shale oil sector. $170 billion of energy-related junk bonds are now outstanding, and they are tanking along with the price of oil.

Oil junk bonds 2014

Emerging market economies. These countries and their major companies have accumulated about $6 trillion of dollar-denominated debt, and with the dollar up more than 10% in the past year, the aggregate losses on those loans could exceed half a trillion dollars. Suddenly, the emerging market miracle looks disturbingly like the Asian Contagion that nearly brought down the 1990s global economy.

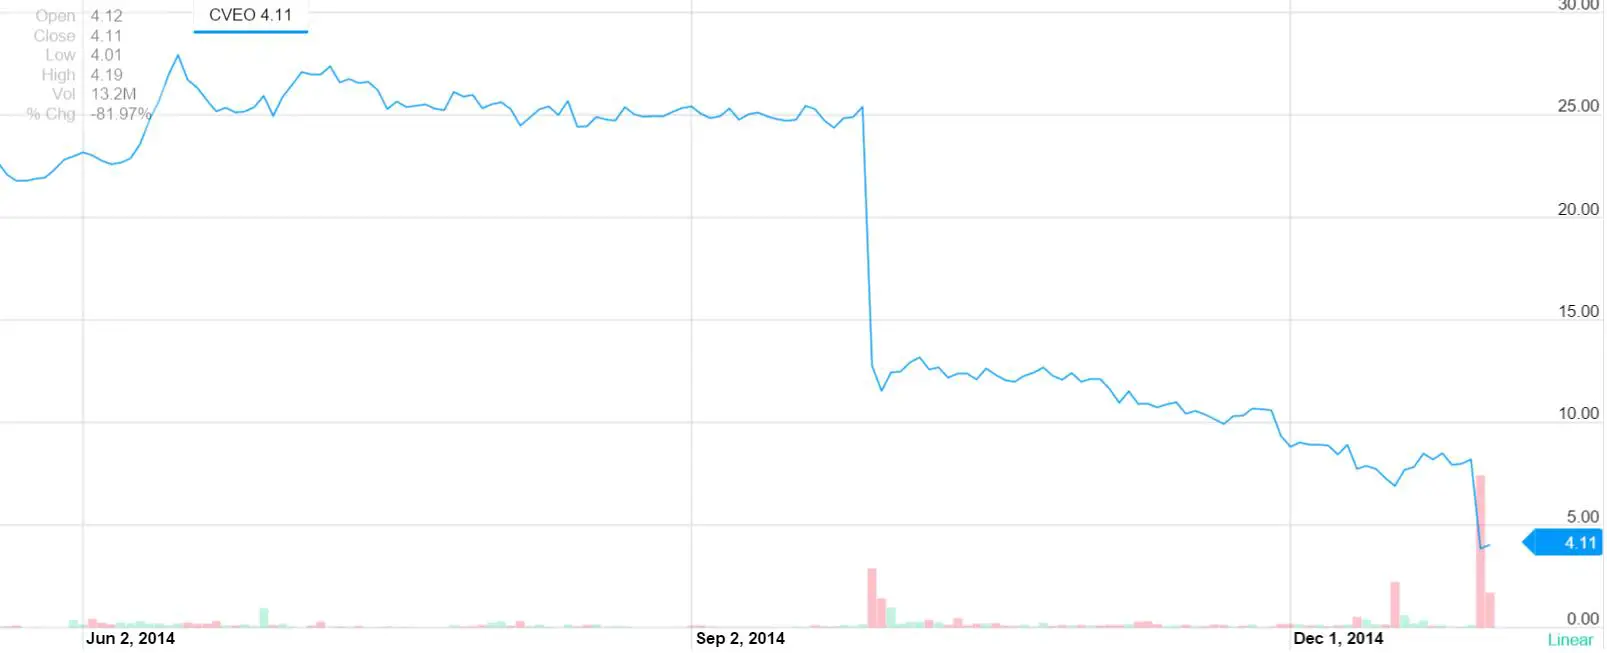
Mining/drilling firms. These guys ramped up in response to soaring oil, copper, iron ore, gold, and silver prices. Now many of them are earning less per unit of product than it costs to mine/drill it. Massive bankruptcies and consolidations are coming. One dot-comish sign of things to come is Civeo, which provides living quarters for workers pouring into oil fields and mines in Canada, Australia, and the US. With people pouring out instead of into these suddenly non-viable fields, the company’s services are no longer required.

Civeo 2014

The Texas economy. Texans are cool. But a big source of their cockiness vis-a-vis the rest of the country was due to the fact that the price of their main export — oil — was at historically high levels. Now that it’s not anymore, the Texas economy — like those of Brazil and Russia, is falling back to earth. JP Morgan Chase predicts a recession in 2015.

The US economy. It turns out that most of the full-time jobs gained in the past five years have come from the energy sector. Otherwise, it’s been part-time secretarial/fast food/temp work that no one actually wants and in any event can’t support a family. Reverse out the oil patch jobs and the $10 or so trillion it took to engineer the “recovery” will look like just another piece of money-illusion malinvestment.

Anyhow, that’s just a sampling of the badly-maintained bods suddenly on display. Most are now running for cover, which is an amusing sight for anyone not directly affected by their problems. Trouble is, it’s hard not to be affected by energy, debt and deflation.


Does Surging Demand For Gold & Silver Coins Signal a Bottom?

Guest Post by John Rubino

Reports of individuals snapping up near-record numbers of gold and silver coins are coming in from around the world:

U.S. Mint American Eagle gold coin sales set to rise sharply in Sept

(Reuters) – The U.S. Mint has sold nearly 50,000 ounces of American Eagle gold coins so far in September, almost double its total in August, as a sharp pullback in gold prices and geopolitical tensions boosted interest for physical products from retail investors.

With only six business days left until the end of September, sales of American Eagle bullion gold coins made for investors were 46,000 ounces, up 84 percent from August sales of 25,000 ounces, the latest U.S. Mint data showed on Monday.

Record highs in U.S. equities also prompted some retail investors to buy precious metal products to diversify their portfolios, said David Beahm, vice president at New Orleans coin dealer Blanchard & Co.

 German Bullion Dealers Report Major Increase in Sales

(Gold Reporter) Bullion dealers from all regions report that gold sales in the German bullion trade market surge since last week. Suppressed prices for gold and silver are obviously considered buying rates by German investors. The German precious metals trade reports a surge in sales.

“For about a week we record considerably increased turnover again, which is now on previous year’s level, so it doubled compared to the recent months.”, Rene Lehman from the internet dealer Münzland in Dresden told Goldreporter.

“We can confirm that customer demand has considerably increased in the recent days.“, said Dominik Kochmann, CEO of ESG Edelmetalle in Rheinstetten.

Daniel Marburger, Director of Coininvest GmbH in Frankfurt/Main also stated that “In the past seven working days we have seen an extreme surge in demand.”

Christian Brenner, Chief Executive of Philoro Edelmetalle GmbH: “Already in August we noticed an increase on orders compared to the previous months, but September… September beats it all. From a German viewpoint it’s the strongest month of 2014.”

Perth Mint Gold and Silver Bullion Sales Surge in August

(Coin News) Australian sales of bullion gold and silver surged in August after falling to a three-month low in July, new figures from the Perth Mint of Australia show.

August sales of Perth Mint gold coins and gold bars at 36,369 ounces rallied 44.9% from July and jumped 19.5% from the same time last year. Gold sales were the highest since June. Sales of Perth Mint silver coins and silver bars at 818,856 ounces in August advanced 41.7% from the prior month and grew 18.5% from August 2013. They were the strongest since January. In July, gold and silver bullion sales retreated from the previous month and from year-ago levels.

Individual buyers aren’t the dominant players in precious metals but they do make a difference. And their renewed enthusiasm is matched by some recent national trends:

China imports more gold for holiday; Indian demand set to climb

SINGAPORE (Reuters) – Top bullion consumer China has been importing more gold in September than in the previous month due to demand from retailers stocking up for the upcoming National Day holiday, market sources said.

Demand in India – the second biggest buyer of the metal – is also set to pick up as the festival and wedding season kicked off this week.

With gold trading close to a key psychological level of $1,200 an ounce, markets are keenly watching physical demand in Asia – the top consuming region – to see if it could lend support to prices.

“The physical volumes have been high this month compared to August. I would say imports could be at least 30 percent higher than last month,” said a trader with one of the 15 importing banks in China.

Russia Boosts Gold Reserves by $400M to Highest Since ’93

(Bloomberg) Russia added about 9.4 metric tons of gold valued at $400 million to reserves in July as it expanded holdings for a fourth consecutive month to the highest in at least two decades.

The country’s stockpile, the fifth-biggest, increased to 35.5 million ounces (1,104 tons) last month from 35.2 million ounces at the end of June, data posted on the central bank’s website showed. The amount of gold now held is the most since at least 1993, according to International Monetary Fund data.

Central banks may add as much as 500 tons to reserves this year, the World Gold Council said on Aug. 14. Nations increased holdings by 409 tons last year and 544 tons in 2012.

There’s no guarantee that this buying, encouraging as it seems, is anything more than a blip. But in the aggregate it does seem like a lot of buyers, old and new, are finding current prices to be attractive. That’s how bottoms form and new bull markets begin.

Are Cars About to Crash?

Guest Post by John Rubino

New car sales have been one of the bright spots of the US recovery. And they’re still at it:


September U.S. auto sales to rise 10 percent: JD Power, LMC

(Reuters) – Strong demand drove U.S. new car and truck sales 10 percent higher in September, adding momentum to the industry’s best August in more than a decade, consultants LMC Automotive and J.D. Power said on Thursday. 

Sales rose to 1.248 million new vehicles, or a seasonally adjusted annualized rate of 16.5 million vehicles. This follows a 17.5 million annualized rate in August.

“The strength in automotive sales is undeniable, as August sales performance was well above expectations and there is no evidence of a payback in September, suggesting that the auto recovery still has some legs,” LMC forecaster Jeff Schuster said.

LMC raised its full-year forecast for 2014 to 16.4 million vehicles from 16.3 million vehicles

Why have cars been so strong when housing in particular and consumer spending in general have been relatively limp? Two reasons. First, subprime lending has found a home in this market:


In a Subprime Bubble for Used Cars, Borrowers Pay Sky-High Rates

(New York Times) – Rodney Durham stopped working in 1991, declared bankruptcy and lives on Social Security. Nonetheless, Wells Fargo lent him $15,197 to buy a used Mitsubishi sedan. 

“I am not sure how I got the loan,” Mr. Durham, age 60, said.

Mr. Durham’s application said that he made $35,000 as a technician at Lourdes Hospital in Binghamton, N.Y., according to a copy of the loan document. But he says he told the dealer he hadn’t worked at the hospital for more than three decades. Now, after months of Wells Fargo pressing him over missed payments, the bank has repossessed his car.

This is the face of the new subprime boom. Mr. Durham is one of millions of Americans with shoddy credit who are easily obtaining auto loans from used-car dealers, including some who fabricate or ignore borrowers’ abilities to repay. The loans often come with terms that take advantage of the most desperate, least financially sophisticated customers. The surge in lending and the lack of caution resemble the frenzied subprime mortgage market before its implosion set off the 2008 financial crisis.

Auto loans to people with tarnished credit have risen more than 130 percent in the five years since the immediate aftermath of the financial crisis, with roughly one in four new auto loans last year going to borrowers considered subprime — people with credit scores at or below 640.

The explosive growth is being driven by some of the same dynamics that were at work in subprime mortgages. A wave of money is pouring into subprime autos, as the high rates and steady profits of the loans attract investors. Just as Wall Street stoked the boom in mortgages, some of the nation’s biggest banks and private equity firms are feeding the growth in subprime auto loans by investing in lenders and making money available for loans.

The extra demand generated by allowing (apparently) anyone with a heartbeat to buy has supported the price of used cars, making new cars more attractive by comparison. Which in turn makes leasing seem like a good deal for all concerned:


The Mystery Behind Strong Auto “Sales”: Soaring Car Leases

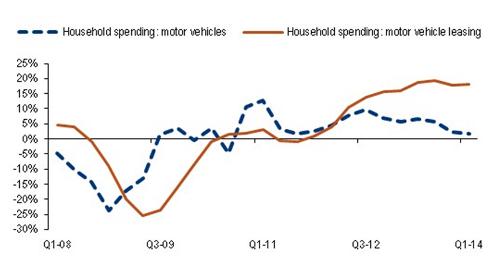
(Zero Hedge) – When it comes to signs of a US “recovery” nothing has been hyped up more than US auto companies reporting improving, in fact soaring, monthly car sales. On the surface this would be great news: with an aging car fleet, US consumers are surely eager to get in the latest and greatest product offering by your favorite bailed out car maker (at least until the recall comes). The only missing link has been consumer disposable income. So with car sales through the roof, the US consumer must be alive and well, right? Wrong, because there is one problem: it is car “sales” not sales. As the chart below from Bank of America proves, virtually all the growth in the US automotive sector in recent years has been the result of a near record surge in car leasing (where as we know subprime rules, so one’s credit rating is no longer an issue) not outright buying. 

From BofA:

“Leasing soars: Household outlays on leasing are booming at a 20% yoy pace – a clear sign that demand for vehicles is alive and kicking. With average lease payments lower than typical monthly ownership costs and with a down-payment not typically required to enter into a lease, the surge in vehicle leasing is likely a sign that financial restraints are still holding back some would-be buyers. Thus, as the economy improves, bottled-up household demand for vehicles could translate to higher sales.”

Chart 1: Households go for the low capital option: leasing soars
(yoy growth rate, inflation-adjusted)

Car leasing
It could also translate into even higher leases, which in turn bottlenecks real, actual sales.

Of course, the problem is that leasing isn’t buying at all. It is renting, usually for a period of about 3 years. Which means that at the end of said period, an avalanche of cars is returned to the dealer and thus carmaker, who then has to dump it in the market at liquidation prices, which in turn skews the ROA calculation massively. However, what it does do is give the impression that there is a surge in activity here and now… all the expense of massive inventory writedowns three years from now.

Which is precisely what will happen to all the carmakers as the leased cars come home to roost. But what CEOs know and investors prefer to forget, is that by then it will be some other management team’s problem. In the meantime, enjoy the ZIRP buying, pardon leasing, frenzy.

The above prediction is already coming true:


Falling used-car prices roil the auto market

(USA Today) – Used-car prices are sliding, a boon to penny-pinchers, but troubling for new-car sales. 

The auto industry sales recovery in recent years means millions of used cars, many coming off lease, are starting to flood the market. The result is a decline in used-car prices that zoomed sky-high after the recession. And the decline is leading to talk that new-car auto sales growth may be peaking.

“We’re going to see a tremendous increase in used-car supply over the next couple of years,” says Larry Dominique, an executive vice president of auto-pricing site TrueCar.

That used-car cascade could dampen new-car sales in three ways:

•Less valuable trade-ins. Car shoppers may find their trade-ins are worth less than they expected when they go to buy new vehicles. That means they’ll have to shoulder larger new-car loans or forgo the purchases.

•More expensive leases. Lease rates for new vehicles are based on predicted resale value. As resale prices fall, automakers adjust predicted depreciation schedules and have to raise lease prices.

Wholesale prices were down 0.4% in August vs. a year ago, down 1.6% from July and “prices should continue to trend down as supply outpaces demand,” writes Tom Kontos of Adesa Analytical Services, which tracks wholesale prices for used cars, in a note to the industry.

At retail, the average used car sold at a franchised auto dealership went for $10,883 last month, down 1.6% from a year ago and 2.4% from July, says CNW Research.

So falling used car prices will lead to massive write-downs by the auto companies now being forced to take back all those leased vehicles. Which means the currently rosy earnings projections for GM, Ford and the other automakers playing these games are wildly overoptimistic and will have to be scaled back in an, um, unruly fashion during the next couple of years.

This sudden unpleasant surprise will come just as the Fed has ended its last round of debt monetization and is hoping that the economy will be able to grow without help. But housing, the main linchpin of the consumer economy, is already flat-lining in much of the country (see Why Isn’t Housing a Bubble?). Add the auto industry to the negative column and there won’t be many bright spots by the end of 2015. And the Fed, no matter what it says today, will have no choice but to open the spigot once more.

We Are So Not Prepared For Another Oil Shock

Guest Post by John Rubino at Dollar Collapse

In one sense, energy doesn’t matter all that much to what’s coming. Once debt reaches a certain level, oil can be $10 a barrel or $200, and either way we’re in trouble.

But the cost of energy can still play a role in the timing and shape of the next financial crisis. The housing/derivatives bubble of 2006 -2008, for instance, might have gone on a while longer if oil hadn’t spiked to $140/bbl in 2007. And the subsequent recovery was probably expedited by oil plunging to $40 in 2008.

With the Middle East now lurching towards yet another major war, it’s easy to envision a supply disruption that sends oil back to its previous high or beyond. So the question becomes, what would that do to today’s hyper-leveraged global economy? Bad things, obviously. But before looking at them, let’s all get onto the same page with a quick explanation of why everyone seems so mad at everyone else over there:

The story begins in 570 A.D. in what is now Saudi Arabia, with the birth of a boy named Muhammad into a family of successful merchants. After having some adventures and marrying a rich widow, around the age of 40 he begins having visions and hearing voices which lead him to write a holy book called the Qur’an. More adventures follow, eventually producing a religious/political system called Islam that comes to dominate a large part of the local world.

In 632 Muhammad dies without naming a successor, creating a permanent fissure between the Shi’ites, who believe that only descendants of the Prophet Muhammad should run Islam, and the Sunnis, who want future leaders to be chosen by consensus.

Now fast forward to the end of World War I: British leader Winston Churchill sits down with some other old white guys to draw a series of rather arbitrary lines through the Middle Eastern territories recently captured from the Turkish Ottoman Empire. They name their creations Jordan, Syria, and Iraq and appoint kings to rule them. Unfortunately, the new borders enclose both Sunnis and Shi’ites, along with Kurds and Christians who don’t get along with either kind of Arab Muslim. Shortly thereafter, Israel is tossed into the mix and massive but unequally-distributed oil fields are discovered, pretty much guaranteeing instability for as far as the eye can see.

Since then, the Western powers have been trying to keep the oil flowing by periodically deposing/replacing leaders and making/breaking alliances. All without the slightest idea of what they’re doing. So the situation has gone from really bad in the 1960s and 1970s to potentially catastrophic today as various Middle Eastern dictatorships and terrorist groups plot to create a pan-Islamic “New Caliphate” while secretly developing weapons of mass destruction.

Which brings us to the present crisis: The US, having deposed Iraqi dictator Saddam Hussein and spent a trillion or so dollars trying to create a functioning democracy, has pulled out, only to see the new Shi’ite government oppress the Sunni minority into rebellion. With the help (or leadership, it’s not clear) of Syrian Islamists trained in that country’s ongoing civil war, the Sunnis are on the verge of taking over Iraq, and both the US and (Shi’ite) Iran are being pulled back in — apparently on the same side.

It’s a mess, in other words, and the flow of oil, of which Iraq and Iran produce a lot, is now threatened.

So what would $150/bbl oil mean today? Several things:

Another recession. The US economy contracted at an annual rate of about 2% in the first quarter and isn’t nearly as strong as analysts had predicted going forward. Let gas go to $5 a gallon, and the consumer spending on which the US economic model depends would dry up. Put another way, we might spend the same amount but it will be mostly for gas and not much else. So much for the recovery.

Equity bear market. Stock prices depend on corporate profits, which in turn depend on sales. If Americans buy less, corporations earn less. With blue chip equities currently priced for perfection, major companies faced with a sales slowdown will, if they want to keep their stock prices from tanking, have to borrow even more money and buy back even more shares, which will only work until interest costs start consuming what’s left of their profits. Then US stocks fall hard.

Currency crisis. If Saudi Arabia manages to stay out of this latest conflict, it will see its revenues surge as it sells the same amount of oil at higher prices. But it’s not happy with the US (something about us recently tilting towards Iran) and apparently no longer feels obligated to accept only dollars for its oil. Let it start accepting euros, yen and yuan, and the result will be lessened demand for dollars, a falling dollar exchange rate and all manner of turmoil in global bond markets.

Derivatives implosion. Derivatives — basically private bets on the behavior of interest rates, currency exchange rates and corporate bond defaults — on the books of major banks have actually increased in the five years since those instruments nearly destroyed the global financial system. There are between half a quadrillion and one quadrillion dollars face value of derivatives out there, and a spike in financial market volatility would cause a lot of them to blow up.

There are other possible consequences of a major Middle East war, but the preceding is enough to make the point that the more leveraged a system is, the more vulnerable it is to external shocks. And no one has ever been as leveraged as we are right now.

Amazingly Deceptive Headlines, Part 1

I couldn’t agree more with John Rubino and his assessment of the captured propaganda spewing corporate media. They are nothing but mouthpieces for the establishment. Their headline is designed to make the reader think that foreign countries continue to desire U.S. debt and are buying it with abandon. Nothing could be further from the truth, as Russia dumps Treasuries, with China and Japan selling too. Only Zero Hedge questioned the storyline.

Russia Dumps 20% Of Its Treasury Holdings As Mystery “Belgium” Buyer Adds Another Whopping $40 Billion

Belgium is a tiny, barely solvent country, with a GDP of $420 billion. This country has supposedly bought $200 billion of US Treasuries in the last few months and now owns $381 billion of our debt. That is a laughable statistic. This country is clearly being used as a conduit for an unnamed entity to buy our debt, because the Fed is tapering and the rest of the world knows that buying our debt at 2.50% is a guaranteed losing proposition.

The headlines in the MSM should be SCREAMING about the fact that Belgium could not possibly be buying this much debt. But no, that isn’t their job. They are supposed to keep the sheeple sedated and calm. Deception is the name of the game.


Guest Post by John Rubino at Dollar Collapse

Reporters and their editors (and the corporations that employ them) have the power to shape readers’ perceptions by, for instance, choosing what fact to put first in a story or which expert to quote in what context. But the most powerful tool is the simplest: the headline. Because many people read only that, and many others have their perception of an article shaped by the first words they see, this sentence fragment is frequently as important as everything that comes after.

Consider this, from the Associated Press:


Foreign Holdings of US Treasury Debt Hits Record

Foreign buyers of U.S. Treasury securities increased their holdings in March to a record high.

The Treasury Department said Thursday that total foreign holdings rose 1 percent to $5.95 trillion from $5.89 trillion in February.

China, the largest foreign buyer of Treasury debt, reduced its holdings by less than 0.01 percent to $1.27 trillion. Japan, the second-largest buyer, cut its holdings 0.8 percent to $1.2 trillion.

Belgium, Luxembourg, Switzerland, major oil exporting nations and Caribbean countries involved in banking all increased their holdings. Meanwhile, Russia shed almost 21 percent of its holdings in March following international tensions over its move to annex part of Ukraine.

Russia controls $100.4 billion worth of U.S. Treasury securities, or just 1.7 percent of all foreign holdings. The United States and Russia have imposed sanctions on each other after parts of the Crimean Peninsula with ethnic and political ties to Russia began an attempt to secede from Ukraine in late February.

Foreign demand for U.S. Treasury securities is expected to remain strong this year, aided by more borrowing certainty with a congressional agreement to suspend the debt limit until March 2015.

Now, let’s tease out a few facts:

Trading powers China and Japan cut their Treasury holdings, while superpower wannabe Russia dumped fully one-fifth of its dollar-denominated debt. Meanwhile, Belgium and Luxembourg and a few others more than made up the slack, enabling the Associated Press to open with a glowingly-positive message (foreign investors love dollars!).

The truth appears to be something else entirely. How could Belgium and Luxembourg (total combined population 12 million) buy enough US debt to offset Russia dumping 21% of its Treasuries? The answer is that it’s highly unlikely they would do this in a single month unless they’re part of an under-the-table deal through which Western powers are hiding the fact that major holders of dollars appear to be losing faith in the currency and/or bridling at US foreign policy arrogance.

So the cover-up is the real story, and a more honest headline would feature Belgium’s purchases and the reasons for this shift in dollar ownership. “Russia sells Treasuries while Belgium buys; analysts wonder why” would be both more honest and more provocative without being sensationalistic.

But of course it would also pose a difficult question, which is apparently no longer the corporate media’s job.

THE MONEY BUBBLE

John Rubino, who runs the great Dollar Collapse website, has been one of TBP’s biggest supporters from the very beginning. He always posts my articles in his Best of the Web section. He and James Turk wrote a great book in 2004. If you had heeded their advice, you would have made a lot of money. They are back with a new book called The Money Bubble. They will be right again, because the facts are on their side. Support John and his efforts by purchasing his new book. He’s one of the good guys.


In their 2004 book The Coming Collapse of the Dollar , James Turk and John Rubino advised readers to bet against the housing bubble before it popped and to buy gold before it soared. Those were literally the two best investment ideas of the decade.

Now Turk and Rubino are back to say that history is about to repeat. Instead of addressing the causes of the 2008 financial crisis, the world’s governments have continued along the same path, accumulating even more debt and inflating even bigger financial bubbles.

So another — even bigger — crisis is coming. Whether it ends up being called a “crack-up boom” or “the End of Paper Money” or “the Second Great Depression,” it will change everything, from the kinds of investments that create new fortunes to the kinds of money that most of us save and spend.

Among many other things, the authors explain:

• How governments are hiding the scope of the problems they face.

• Why the world’s paper currencies will soon stop functioning as money.

• How you can protect your savings from the threats posed by this transition from “unsound” paper currencies to “sound” money like gold and silver.

• How you can actually make money — perhaps a lot of it — during this transition.

“Because the Money Bubble involves the world’s major currencies rather than just a discrete asset class like houses or tech stocks, its bursting will be both far more devastating for the unprepared and far more profitable for those able to understand it and act accordingly. Our goal is to usher you into this small but happy second group.” — James Turk and John Rubino, The Money Bubble