

Off the microphone of RE
Follow us on Twitter @doomstead666
Friend us on Facebook
Aired on the Doomstead Diner on November 18, 2014

Discuss this Rant at the Podcast Table inside the Diner

Speedy Gonzalo Lira sez, “OOPS! I guess I made a MEEESTAKE!”
Snippet:
…Remember back to 2008-2009 when Hank Paulson pulled out the Bazooka to bail out the TBTF Banks, and then Helicopter Ben Bernake launched the first of his QE ships? Pundits in the Econ Blogosphere went berserk, predicting imminent Hyperinflation of the Dollar. John Williams, Speedy Gonzalo Lira, Mish, you name it they all predicted rampant HI which somehow never arrived here.
Meanwhile in the dark secluded corners of the internet, a few people like Nicole Foss of The Automatic Earth, Steve Ludlum from Economic Undertow and myself all predicted a deflationary event coming down the pipe, at least for the Dollar.
What is the situation today? Deflation is now the word of the day spoken fearfully by Central Bank chieftains, and even notorious Hyperinflation predicting sites like Zero Hedge are on the Deflation Bandwagon…
For the rest, LISTEN TO THE RANT!!!


Two iconic Andy Warhol paintings of Elvis Presley and Marlon Brando sold for more than USD 151 million at auction in New York today, shattering pre-sale estimates by several million dollars.
Pop-art legend Warhol’s “Triple Elvis” — a 1963 silkscreen depicting three images of the King of Rock and Roll posing as a gunslinging cowboy — sold for USD 81.9 million at the Christie’s sale.
[img [/img]
[img [/img]
HUGE Bubble going on in Fine Art now as the Chinese launder hot money in this market.
Might be a good time for you to cash in on your Stamp Collection.
With luck, you can liquidate the stamps to a Chinese Investor and then buy a Ton of Silver on the Cheap here.
RE
Market Caps November 2014
Ali Baba 300 Billion
Google 370 Billion
Facebook 207 Billion
Novartis 255 Billion
JPMorgan Chase 226 billion.
Nice Big Numbers.
You think they will hold up?
RE
Million (and multi-million) dollar home sales hit record in Bay Area
Sales of multi-million dollar homes hit a record in six of the Bay Area’s nine counties last quarter, according to a DataQuick report released Thursday.
A previous report, from Paragon Real Estate Group, showed that sales of luxury homes in San Francisco exploded in the second quarter of this year.
The new DataQuick numbers show the trend is not limited to San Francisco, where a record 179 homes priced at $2 million or more closed in the second quarter. Santa Clara County also hit a new high, with 399 homes selling for $2 million or more in the second quarter. San Mateo, Alameda, Marin and Napa also hit records for multi-million dollar sales. The Bay Area as a whole also set a record, with 1,117 multi-million-dollar homes changing hands.
The report also looked at sales of homes for $1 million and up in the second quarter. Here, only San Francisco and Santa Clara counties set records, but they were enough to life the entire Bay Area to a record. “The 5,734 sales there of $1 million or more represented an all-time high. The previous peak was 5,699 in second-quarter 2005,” DataQuick said.
[img [/img]
[img [/img]
[img [/img]
Golden,
Interesting article on marketwatch this morning.
http://www.marketwatch.com/story/time-to-dump-the-barbarous-relic-from-your-portfolio-2014-11-17?dist=beforebell
I just realized that the cartoonish nature of the graphics, used to emphasize points the way a child might, bright and colorful and not requiring thought, designed more as a bright and shiny object to capture attention, perfectly match the medium being employed to minimize actual thought, and the quality of thought that goes into the product itself. A wonderful combination of thought and presentation designed for pre-schoolers. Perhaps early elementary, if the students are “special”.
@ Card 802
Thanks for the reply. IMHO the article you presented is of very low quality, and was written by someone who has absolutely no understanding of either the Gold market, nor any knowledge at all of what Gold is.
We all have differing opinions on matters. I’m prejudiced, I am one of the religious Gold Bugs that the author is ridiculing. As a devout worshiper in the Golden Temple for half a century now, it is unlikely I will change my religion or worship a Paper and Ink or Tin God.
Thanks Anyway, I realize you were trying to be helpful.
“I just realized that the cartoonish nature of the graphics, used to emphasize points the way a child might, bright and colorful and not requiring thought, designed more as a bright and shiny object to capture attention, perfectly match the medium being employed to minimize actual thought, and the quality of thought that goes into the product itself. A wonderful combination of thought and presentation designed for pre-schoolers. Perhaps early elementary, if the students are “special”. ”
@reply John
Yes, If it were hamburg it would be known as Pink Slime. His brain is so massive and his thoughts of such depth and complexity that he fills his ideas with fillers, much like the Pink Slime manufacturers, so we may comprehend and learn from His Wizardry.
His mission is to “Save as Many as He Can.” Yes, like Obama, he is Our Savior, and he must dumb down his message so the greatest number of dolts can comprehend it.
Where would we ever be without him? Imagine a life without Jack Daniels and Eggs. Thanks RE, Our Dear Savior
I liked the picture of speedy Gonzalez! That cheered me up. Maybe they will poke the bear too hard and start something to take our minds off all the good stuff going on around us.
“Speedy Gonzalo Lira sez, “OOPS! I guess I made a MEEESTAKE!” ———– RE
THAT is fuckin’ RACISSS as shit …. you hypocrite moose-eating supermarket prepper!!!
Golden,
I thought as a gold bug you may get a good laugh out of the mainstream view on what they believe is real money. Just think how many average Joe’s will sell low, because of ignorant mainstream “experts”
I love deflation experts. I have a tan car. This is a fact. A deflationist is the person who will try to convince be my car is actually green.
Food, Shelter, Medical Care, and Transportation —- let’s call those items The Basics, stuff I need on a constant basis;
—- food …. I can hardly think of any item that costs the same or less than last year
—- shelter …. out taxes went up another couple hundred bucks last quarter, heating is more, even the garbage collector increased his fee. Nothing is cheaper this year.
—- Medical Care …. insurance premium went up, a lot. A few months ago my dad spent a FEW HOURS in an Emergency Room, the bill was over $4,000
—- Transportation …. ok, gas is cheap. Ya got me there.
So, yeah, I love experts who say deflation is here, or coming. I can only say, “Bring It!!”. Oh, yeah, one other thing …. Blow Me.
Deflation is one of the things central banks and governments hate the most, so it’s one of the things they will fight to the bitter end to reverse. We will pay now and in the future for their grand efforts.
We are all Japanese now.
Golden says…
Yes, If it were hamburg it would be known as Pink Slime. His brain is so massive and his thoughts of such depth and complexity that he fills his ideas with fillers, much like the Pink Slime manufacturers, so we may comprehend and learn from His Wizardry.
Pink slime. Good one. Even funnier when you look at the name of the website he harps on. Talk about an ego run amuck, I glanced at it quickly, it looks as though a single comment thread here has more participants than his entire site. You would think it would be obvious that his quality of work isn’t designed to attract thinking people at all. Children, or those of an intellectual equivalent, sure, but adults? Forget about it, if I want to know what the sheeple think I can wander a suburbia apartment complex anywhere in America, I hardly need one of them bragging about how their pathetic lives have any meaning, or are of any value in the greater scheme of things. This gang goes under first. Under ANYTHING, if the sheer size of their incompetence on the most basic things not related to their suburban sheeple lifestyle is any indication. I mean, can’t put engine oil in an engine? Yes, you will certainly survive doom! Maybe that is why the booze is necessary? The first hint of trouble, and demise by alcohol poisoning is the way to go!!
Stucky says:So, yeah, I love experts who say deflation is here, or coming. I can only say, “Bring It!!”. Oh, yeah, one other thing …. Blow Me.
Yes…well… certainly I don’t confuse reverse engineers general ignorance on the topic of economics with this particular…how do people say it politely..lifestyle choice. Perhaps my last pictograph of what jack daniels does to him should be modified. Maybe his Jack Daniels habit and this other…thing…happened at the same time?
[img [/img]
No deflation until the value of gov’t bonds (US & everyone else’s) breaks down and interest rates break out to the upside.
THAT will be the inflection.
In the meantime, every dollar in credit conjured by the BOJ, the Fed, the EU central bank, etc. is flowing into the creation of new debt, which is deemed “wealth.”
Think about that! Central banks are (for the moment) appearing to create WEALTH out of thin air !!!
Only those with no connection to “real things” can entertain such stupid ideas. This means, only the uber-rich, politicians and those in the MSM. The rest of us can see just how naked are our icky emperors.
So we wait, and wait, and wait. TWENTY YEARS I’ve waited for the value of bonds to break down, so I guess I must be patient………….
Thanks for the hits gang! Pulling in 10 listens/hour!
[img [/img]
RE
Today, from The Economist:
http://www.economist.com/blogs/buttonwood/2014/11/deflation-and-markets
Deflation and the markets
Trends in low places
Nov 18th 2014, 14:03 by Buttonwood
[img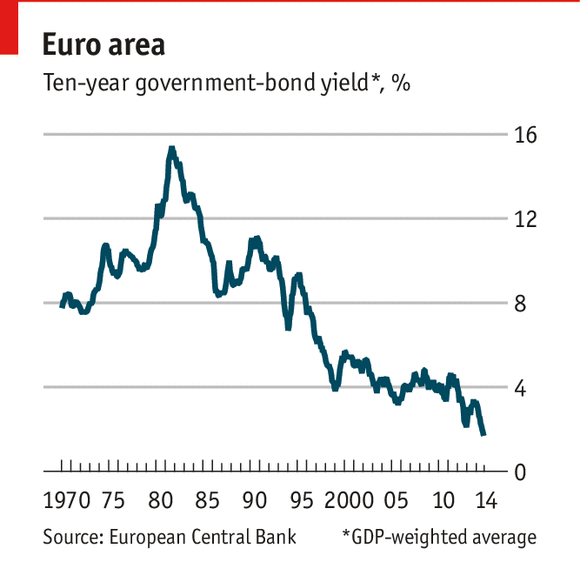 [/img]
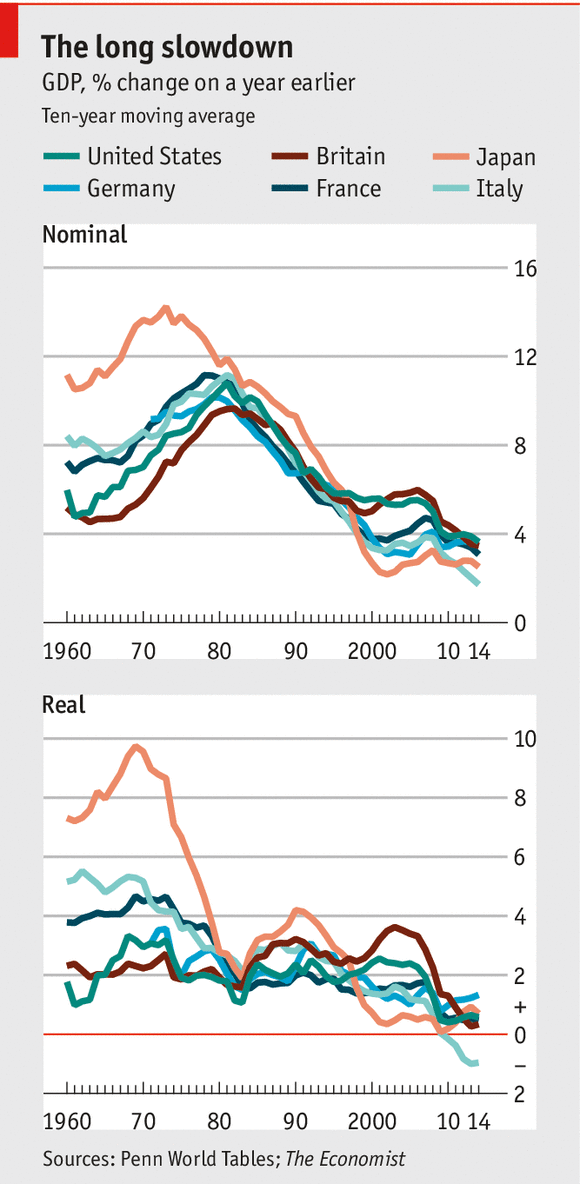 [/img]
THE longer the chart, the clearer the picture can become.
At the start of 2014, it was hard to find an investor who was bullish on government bonds; economic growth was bound to pick up, central banks would start to normalise monetary policy and yields would head higher. Even now, the latest Bank of America survey of fund managers shows just 5% think government bonds will deliver the best returns over the next 12 months, compared with 63% that plump for equities. But this chart shows a GDP-weighted composite of euro zone bond yields. The trend is inexorably down; even the debt crisis of 2010-12 was barely a blip.
[img
Now of course, extrapolation is always a danger; trends can change. Last night, your blogger took part in a debate about the future of Europe in which one panellist predicted surging inflation, causing investors to lose faith in the euro. But it is very hard to see any sign of that happening. Inflation remains very low; some euro zone countries are in deflation; and the money supply is barely growing (up 2.5% year-on-year).
And it is not too hard to see why bond yields are so low when one looks at the long-term charts (this may be a repeat but it’s a goodie).
Nominal and real GDP growth have been on the same remorseless downward trend as bond yields. Some people may be debating whether Europe has turned Japanese but it already has done. There is even the same debate over whether the central bank has been too slow in delivering monetary stimulus and politicians too slow in delivering structural reform. What is the Japanese for schadenfreude?
It may well be that there is little that can be done to stop the rot, given the demography. More QE may well be attempted but as David Owen of Jefferies writes
The economist Richard Koo has done much to highlight the potential ineffectiveness of QE in a balance sheet recession. This ia particularly likely to be the case when nominal GDP growth approaches the zero bound, given the need for nominal GDP growth to help restructure balance sheets, creating the ingredients to help drive recovery. QE may help underpin asset prices, but not feed throuigh to the wider real economy, or if it does the lags involved could be especially long.
Our leader line has shifted to QE with a twist; an infrastructure fund backed by the ECB. But there aren’t any easy answers. Investors have been arguing that Japanese bond yields are too low for more than a decade; they have stayed low. The trade is known as “the widowmaker”.
From George Washington via Zero Hedge
http://www.zerohedge.com/news/2014-11-18/why-qe-may-lead-deflation-long-run
Why QE May Lead to DEFLATION In the Long Run
George Washington’s picture
Submitted by George Washington on 11/18/2014 14:55 -0500
Bank of Japan
Bond
Central Banks
China
Excess Reserves
Federal Reserve
Global Economy
India
Japan
Larry Summers
Monetary Policy
Nomura
Quantitative Easing
Real Interest Rates
recovery
Richard Koo
St Louis Fed
St. Louis Fed
Switzerland
The Economist
Volatility
Wall Street Journal
inShare1
Preface: Financial experts have been debating since the start of the 2008 financial crisis whether inflation or deflation is the bigger risk. That debate is beyond the scope of this essay. However, it might not be either/or. We might instead have “MixedFlation” … inflation is some asset classes and deflation in others.
Quantitative easing (QE) was supposed to stimulate the economy and pull us out of deflation.
But the third round of quantitative easing (“QE3″) in the U.S. failed to raise inflation expectations.
And QE hasn’t worked in Japan, either. The Wall Street Journal noted in 2010:
Nearly a decade after Japan’s central bank first experimented with the policy, the country remains mired in deflation, a general decline in wages and prices that has crippled its economy.
***
The BOJ began doing quantitative easing in 2001. It had become clear that pushing interest rates down near zero for an extended period had failed to get the economy moving. After five years of gradually expanding its bond purchases, the bank dropped the effort in 2006.
At first, it appeared the program had succeeded in stabilizing the economy and halting the slide in prices. But deflation returned with a vengeance over the past two years, putting the Bank of Japan back on the spot.
So why didn’t quantitative easing work in Japan? Critics say the Japanese central bank wasn’t aggressive enough in launching and expanding its bond-buying program—then dropped it too soon.
***
Others say Japan simply waited too long to resort to the policy.
But japan has since gone “all in” on staggering levels of quantitative easing … and yet is still mired in deflation.
The UK engaged in substantial QE. But inflation rates are falling there as well.
And China engaged in massive amounts of QE. But it’s also falling into deflation.
Indeed, despite massive QE by the U.S., Japan and China, there is now a worldwide risk of deflation.
So why hasn’t it worked?
The Telegraph noted in June:
The question is why the world economy cannot seem to shake off this “lowflation” malaise, even after QE on unprecedented scale by the US, Britain, Japan and in its own way Switzerland.
***
Narayana Kocherlakota, the Minneapolis Fed chief, suggested as far back as 2011 that zero rates and QE may perversely be the cause of deflation, not the cure that everybody thought. This caused consternation, and he quickly retreated.
Stephen Williamson, from the St Louis Fed, picked up the refrain last November in a paper entitled “Liquidity Premia and the Monetary Policy Trap”, arguing that that the Fed’s actions are pulling down the “liquidity premium” on government bonds (by buying so many). This in turn is pulling down inflation. The more the policy fails – he argues – the more the Fed doubles down, thinking it must do more. That too caused a storm.
The theme refuses to go away. India’s central bank chief, Raghuram Rajan, says QE is a beggar-thy-neighbour devaluation policy in thin disguise. The West’s QE caused a flood of hot capital into emerging markets hunting for yield, stoking destructive booms that these countries could not easily control. The result was an interest rate regime that was too lax for the world as a whole, leaving even more economies in a mess than before as they too have to cope with post-bubble hangovers.
The West ignored pleas for restraint at the time, then left these countries to fend for themselves. The lesson they have drawn is to tighten policy, hoard demand, hold down their currencies and keep building up foreign reserves as a safety buffer. The net effect is to perpetuate the “global savings glut” that has starved the world of demand, and that some say is the underlying of the cause of the long slump. “I fear that in a world with weak aggregate demand, we may be engaged in a futile competition for a greater share of it,” he said.
The Bank for International Settlements [the “central banks’ central bank”] says the world is suffering from addiction to stimulus. “The result is expansionary in the short run but contractionary over the longer term. As policy-makers respond asymmetrically over successive financial cycles, hardly tightening or even easing during booms and easing aggressively and persistently during busts, they run out of ammunition and entrench instability. Low rates, paradoxically, validate themselves,” it said.
Claudio Borio, the BIS’s chief economist, says this refusal to let the business cycle run its course and to purge bad debts is corrosive. The habit of turning on the liquidity spigot at the first hint of trouble leads to “time inconsistency”. It steals growth and prosperity from the future, and pulls the interest rate structure far below its (Wicksellian) natural rate. “The risk is that the global economy may be in a deceptively stable disequilibrium,” he said.
Mr Borio worries what will happen when the next downturn hits. “So far, institutional set-ups have proved remarkably resilient to the huge shock of the Great Financial Crisis and its tumultuous aftermath. But could (they) withstand yet another shock?” he said.
“There are troubling signs that globalisation may be in retreat. There is a risk of yet another epoch-defining and disruptive seismic shift in the underlying economic regimes. This would usher in an era of financial and trade protectionism. It has happened before, and it could happen again,” he said.
The Economist reported last year:
Is QE deflationary? Yes, quite obviously so. Consider:
A central bank that is deploying QE is almost certainly at the zero lower bound.
QE will only help get an economy off the zero lower bound if paired with a commitment to higher future inflation.
If a central bank is deploying QE over a long period of time, that means it has not paired QE with a commitment to higher future inflation.
Prolonged QE is effectively a signal that the central bank is unwilling commit to higher inflation.
QE therefore reinforces expectations that economic activity will run below potential and demand shocks will not be completely offset.
QE will be associated with a general disinflationary trend.
Don’t believe me? Here is a chart of 5-year breakevens since September of 2012, when the Fed began QE3, the first asset-purchase plan with no set end date:
(The article then goes onto say that QE can be deflationary or inflationary depending on what else the central bank is doing.)
Michala Marcussen – global head of economics at Société Générale – believes that QE may be deflationary in the long run because:
Excess capacity is deflationary and the means to deal with it is to shut it down. Indeed, we expect China [which also engaged in massive QE] for now to exert deflationary pressure on the global economy.
***
Unproductive investment is by nature ultimately deflationary. This is a point also worth recalling when investing in paper assets fuelled by QE liquidity and not underpinned by sustainable economic growth.
Prominent economist John Cochrane thinks he knows why. As he explained last year:
Here I graphed an interest rate rise from 0 to 5% (blue dash) and the possible equilibrium values for inflation (red). (I used ?=1 ?=1 ).
As you can see, it’s perfectly possible, despite the price-stickiness of the new-Keynesian Phillips curve, to see the super-neutral result, inflation rises instantly.
***
Obviously this is not the last word. But, it’s interesting how easy it is to get positive inflation out of an interest rate rise in this simple new-Keynesian model with price stickiness.
So, to sum up, the world is different. Lessons learned in the past do not necessarily apply to the interest on ample excess reserves world to which we are (I hope!) headed. The mechanisms that prescribe a negative response of inflation to interest rate increases are a lot more tenuous than you might have thought. Given the downward drift in inflation, it’s an idea that’s worth playing with.
Bloomberg noted earlier this month:
Now, the Neo-Fisherites [including Minneapolis Fed President Narayana Kocherlakota] have been joined by a very heavy hitter — University of Chicago economist John Cochrane. In a new paper called “Monetary Policy with Interest on Reserves,” he explains a mechanism by which higher interest rates raise inflation. Unlike Williamson’s model, Cochrane’s model obtains a Neo-Fisherian result without appealing to fiscal policy. In fact, he finds that in some cases, raising interest rates can even stimulate the economy in the short term! He concludes succinctly:
The basic logic is pretty simple: raising nominal interest rates either raises inflation or raises real interest rates. If it raises real interest rates, it must raise consumption growth. The prediction is only counterintuitive because for so long we have persuaded ourselves of the opposite[.]
Cochrane has a simple explanation of the model’s key predictions on his blog. He hypothesizes that now that the Fed pays interest on the reserves that banks hold with the Fed, monetary policy will be even more Neo-Fisherian — i.e., even more perverse.
***
Cochrane’s arguments are based on simple equations that are at the heart of most modern macroeconomic models. If the Neo-Fisherites are right, then everything the Fed has been doing to try to stimulate the economy isn’t just useless — it’s backward.
Now, the overwhelming majority of empirical studies tell us that QE, and Fed easing in general, tends to raise inflation in the short term. But what if that’s at the cost of lower inflation in the long term? Japan has been holding interest rates at zero for many years, and its economy has been in and out of deflation. Massive QE has noticeably failed to make the U.S. hit its 2 percent inflation target. What if mainstream macroeconomics has it all upside down, and prolonged periods of low interest rates trap us in a kind of secular stagnation that is totally different from the kind Harvard economist Larry Summers talks about?
It’s a disquieting thought.
One of the main architects of Japan’s QE program – Richard Koo – Chief Economist at the Nomura Research Institute – explains that QE helps in the short-run … but hurts the economy in the long run (via Business Insider):
Initially, long-term interest rates fall much more than they would in a country without such a policy, which means the subsequent economic recovery comes sooner (t1). But as the economy picks up, long-term rates rise sharply as local bond market participants fear the central bank will have to mop up all the excess reserves by unloading its holdings of long-term bonds.
Demand then falls in interest rate sensitive sectors such as automobiles and housing, causing the economy to slow and forcing the central bank to relax its policy stance. The economy heads towards recovery again, but as market participants refocus on the possibility of the central bank absorbing excess reserves, long-term rates surge in a repetitive cycle I have dubbed the QE “trap.”
In countries that do not engage in quantitative easing, meanwhile, the decline in long-term rates is more gradual, which delays the start of the recovery (t2). But since there is no need for the central bank to mop up large quantities of funds, everybody is no more relaxed once the recovery starts, and the rise in long-term rates is far more gradual. Once the economy starts to turn around, the pace of recovery is actually faster because interest rates are lower. This is illustrated in Figure 2.
costs of qe
Indeed, things which temporarily goose the economy in the short-run often kill it in the long-run … such as suppressing volatility.
Postscript: Quantitative easing fails in many other ways, as well …
The original inventor of QE – and the former long-term head of the Federal Reserve– say that QE has failed to help the economy. Numerous academic studies confirm this. And see this.
Economists also note that QE helps the rich … but hurts the little guy. QE is one of the main causes of inequality (and see this and this). And economists now admit that runaway inequality cripples the economy. So QE indirectly hurts the economy by fueling runaway inequality.
A high-level Federal Reserve official says QE is “the greatest backdoor Wall Street bailout of all time”. And the “Godfather” of Japan’s monetary policy admits that it “is a Ponzi game”.
So if I understand this correctly…suburban sheeple have zero ability to think for themselves, and can only parrot what their betters, some even contributors to this website I’d bet, say?
What a surprise…NOT. And the most telling statement was that made by the poster who noted, correctly, that the things of importance have not decreased in price over the past year. Those with zero common sense try and negate these obvious indicators of how wrong they are by pretending that a bond yield here, or a single, volatile commodity decreasing, there, substitute for SOME BASIC COMMON FUCKING SENSE.
Sheeple…your name is reverse engineer. And I realize that just by WRITING this I might put the truth of it beyond your ability to understand, but that is okay, because large parts of the world don’t cater to the lowest common fucking denominator in the intellect department.
Deflation my aching bunghole.
The govt needs inflation to wipe away some of the debt. Deflation – bah humbug.
“the things of importance have not decreased in price over the past year.”- Imbecile John
That Deaf, Dumb & Blind Kid sure plays a mean Pinball
[img [/img]
RE
Gas Price Slide Hits 53 Days as National Average Nears Four-Year Low
(WASHINGTON, November 17, 2014) The national average price of gasoline has remained below $3.00 per gallon for 17 days, with more than three-quarters of U.S. gas stations now reporting prices below this benchmark. Today’s national average price for regular unleaded gasoline is $2.89 per gallon, which is the lowest mark since December 2, 2010. Today’s price represents a savings of four cents per gallon compared to one week ago, a savings of 24 cents compared to a month ago and 32 cents compared to one year ago.
National Average Gas Price Comparison 2011 to 2014 November 17 2014
[img [/img]
The price at the pump is closely tied to the wholesale price of crude oil, and falling global oil prices have been the primary contributing factor to the price at the pump declining for 53 consecutive days. This is the longest streak of declines since 2008. West Texas Intermediate (WTI) crude oil, the traditional U.S. benchmark, dropped to its lowest level in more than three years this past Thursday ($74.21 per barrel). Lower crude oil costs are the main reason why drivers are paying an average of 81 cents per gallon less than the 2014 peak of $3.70 per gallon (April 28). The downward pressure on prices is expected to continue through the Thanksgiving holiday, meaning drivers are likely to be giving thanks for the cheapest seasonal prices since 2009 when the national average registered $2.63 on the holiday.
AAA Top Ten Most Expensive Average Gas Prices November 17 2014
Across the country, state averages continue to tick downward with consumers in 48 states and Washington, D.C. experiencing week-over-week savings at the pump. Thirty-five states are reporting an average less than $3.00 per gallon and three states, including Montana, North Dakota and Pennsylvania, are just fractions of a cent from also falling below this benchmark. Drivers in South Carolina ($2.63), Mississippi ($2.66) and Tennessee ($2.66) are paying the nation’s lowest averages for retail gasoline. The nation’s three most expensive markets – Hawaii ($3.96), Alaska ($3.59) and New York ($3.24) – are among those reporting savings over this same period, and for the second consecutive week no state has an average that is above the $4.00 per gallon mark.
Month-over-month comparisons show that drivers in every state and Washington, D.C are paying less to refuel their vehicles. West Coast and Rocky Mountain states are registering the largest drops in prices at the pump, led by California (-37 cents), Oregon (-34 cents), Montana (-31 cents) and Arizona (-30 cents). Consumers in 20 states and Washington, D.C. are saving a quarter or more per gallon versus one month ago, and those in every state but Iowa are enjoying double-digit discounts at the pump. The monthly discount in Iowa falls just short of this threshold at 9.97 cents.
AAA Top Ten Largest Yearly Savings in Gas Prices November 17 2014
The most dramatic discounts are evident when comparing year-over-year averages. Drivers in every state and Washington, D.C. are paying less, and those in 47 states and D.C. are saving a dime or more per gallon when they refuel their vehicles. Averages are down by a quarter or more in 33 states and Washington, D.C., and motorists in Delaware (-42 cents), South Carolina (-42 cents) and California (-42 cents) are saving the most per gallon over this period.
Global prices for crude oil continue to fall, touching lows not seen since 2010. Market analysts continue to speculate on what action the Organization of Petroleum Exporting Countries (OPEC) will take during the upcoming meeting, scheduled for Nov 27. Should the cartel opt to cut production, the price at the pump for motorists could return higher. If OPEC instead chooses to maintain market share by leaving production unchanged, global oil prices could slide even further. At the close of Friday’s formal trading on the NYMEX, WTI settled $1.61 higher at $75.82 per barrel.
From Ambrose
RE
http://www.telegraph.co.uk/finance/economics/10999086/Europes-bond-yields-lowest-since-15th-century-Genoa-on-deflation-Russia-risk.html
Europe’s bond yields lowest since 15th century Genoa on deflation, Russia risk
German, French and Dutch yields have been sliding for months as the eurozone recovery wilts and several countries flirt with recession
Closeup of the map of Europe seen on the face of a 10 Euro Cent coin in Paris, February 15, 2012
David Owen, from Jeffries, said investors are starting to price in quantitative easing by the
By Ambrose Evans-Pritchard
8:13PM BST 29 Jul 2014
Bond yields have fallen to the lowest level in modern history in Germany, France and the eurozone’s core states, signalling a high risk of deflation and mounting concerns about sanctions against Russia.
The yield on German 10-year bonds fell to a record low of 1.11pc in intra-day trading, partly on safe-haven flows. French yields dropped in tandem to 1.5pc. These levels are far below rates hit during the 1930s or even during the deflationary episodes of the 19th Century.
“Yields fell this low in Genoa in the 15th century but there has been nothing like this in Europe in modern times,” said professor Richard Werner, from Southampton University. “This reflects the weakness in nominal GDP and a slow economic implosion caused by credit contraction. The European Central Bank is at last starting to act but it is only scratching the surface.”
German, French and Dutch yields have been sliding for months as the eurozone recovery wilts and several countries flirt with recession, but the latest plunge reflects a confluence of forces. “Investors may fear that the worsening tensions with Russia could be the external shock that finally pushes the eurozone into a deflation trap,” said Simon Tilford, from the Centre for European Reform.
Bond yields have also fallen to all-time lows in Spain and Italy but the “risk-spread” over German Bunds has been widening over recent weeks. The cost of insuring Italy’s debt through credit default swaps has risen by a third since June.
European diplomats reached a deal on Tuesday on “tier 3” sanctions aimed at shutting Russian banks out of global capital markets and slowly suffocating the Russian economy, though the original plan to limit technology for oil and gas exploration has been diluted. Creditors have already frozen a $1.5bn loan for VTB bank due to be agreed last week.
The European Commission said the measures are likely to cut 0.3pc of GDP off EU economic growth this year, and 0.4pc next year, even if the crisis is contained without a serious disruption of energy supplies. “This is a significant hit to growth. It implies such low growth in parts of southern Europe that it makes it almost impossible to arrest the rise in debt ratios,” said Mr Tilford.
The Moscow newspaper Izvestia said Russia’s parliament is already drawing up legislation to blacklist “aggressor countries”, specifically targeting auditors and consultants. These include Deloitte, KPMG, EY (formerly known as Ernst & Young), Boston Consulting and McKinsey.
Tim Ash, from Standard Bank, said this would trigger clauses on bond covenants that rely on external audits. “If they go down this path they could provoke a brutal market reaction,” he said.
David Owen, from Jefferies, said a lack of genuine economic recovery is what lies behind Europe’s falling yields, already replicating the pattern seen in Japan in the 1990s. “A third of all countries in the eurozone are already in deflation once you strip away taxes, and another four have no inflation, including France and Spain,” he said.
“Corporate profits fell in the first quarter, and so did household disposable income, if you exclude Germany. We are seeing no growth at all in world trade, which is highly unusual. The CPB trade index rolled over in May and fell 0.6pc,” he said.
Mr Owen said investors are starting to price in quantitative easing by the ECB, which would entail sovereign bond purchases and potentially push yields lower. The Bundesbank would be the biggest buyer on a pro-rata basis under the ECB’s “key”, but German debt is relatively scarce. “Investors know this and it is driving Bund yields even lower,” he said.
For Russia, deep recession looks inevitable. The commission said sanctions will cut Russia’s growth by 1.5pc in 2014, and by 4.8pc in 2015. A return to the Soviet stagnation of the early 1980s is becoming all too likely.
http://www.zerohedge.com/news/2014-11-18/china-home-price-slump-sends-iron-ore-plunging-2009-lows-50-2014
China Home Price Slump Sends Iron Ore Plunging To 2009 Lows (-50% In 2014)
Submitted by Tyler Durden on 11/18/2014 20:11 -0500
Iron Ore prices crashed below the critical $70/mt level overnight, lows not seen since the bottom in 2009, as China’s home prices fell for the second month in a row, accelerating losses. Average property prices across China dropped 2.6% YoY in October (a bigger drop than September’s 1.2% YoY slip) with only 1 out of 70 cities seeing any positive price change (Zhengzhou +0.2% MoM). What is perhaps most entertaining is the 38.6% YoY rise in new home starts China just experienced – the biggest jump ever – as the first sign of demand (or hint from PBOC that they would ‘help’ with mortgages) and supply floods the market. The ‘market’ appears not to believe the hype.
China home prices continue to slide…
With 69 of 70 cities seeing falling prices…
Source: @M_McDonough
And that led to more weakness in Iron Ore (and copper) prices…
which is ironic because the Chinese homebuilders went crazy in October increasing new home starts by 38.6% YoY in October…!!
That will not end well.
From Investing.com
Follow the Link to see the graphs accompanying the article. Here’s one though:
[img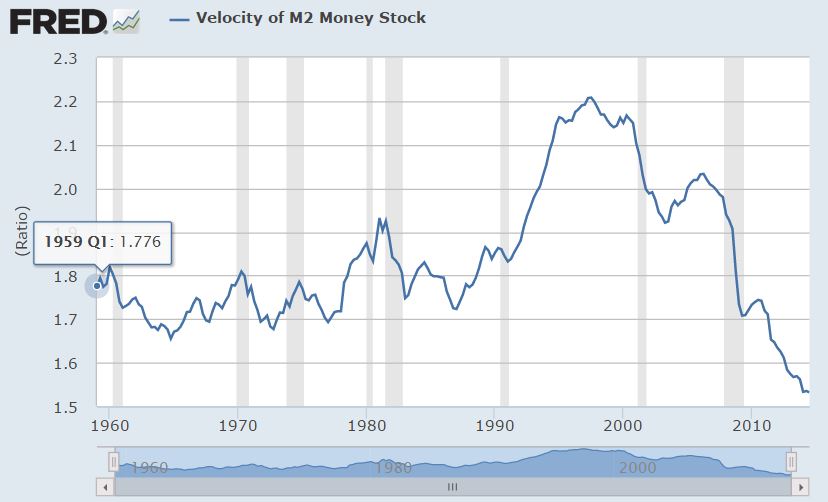 [/img]
RE
http://www.investing.com/analysis/is-deflation-still-a-threat-to-gold-232978
Is Deflation Still a Threat to Gold?
By Doug Eberhardt Commodities Nov 19, 2014 05:51AM GMT
When you talk to investors as to why they buy gold, many look to the precious metal as being a hedge against inflation. But since 2011 we have been experiencing deflation and the yellow metal has felt the affect of an overall declining commodity market.
Many that have been relentlessly bullish on gold since 2011 point to inflation in the money supply. Indeed we do have inflation in M2 Money Supply as you can clearly see from the following chart. The problem is it’s not circulating.
M2 Money Stock
M2 Money Stock
Money Velocity Zilch
What about Money Velocity? With all that printing going on, money is not circulating in the economy. The Fed doesn’t like this but even putting interest rates to zero won’t force consumers and businesses to spend. We have not seen this much of decline in velocity for as long as the Federal Reserve Bank of St. Louis reveals on their chart; 54 years. This is a modern day unprecedented issue the Fed is fighting and is a possible precursor to more QE down the road if necessary to get money moving (inflation target of 2%).
Velocity of M2 Money Stock
Velocity of M2 Money Stock
Bernanke when he was Fed Chairman was clear in what the Fed would do during deflation in his 2002 speech Deflation: Making Sure “It” Doesn’t Happen Here. And people complain about Fed transparency (j/k Austrian economists). There is no doubt in my mind that a Yellen led would implement more QE if interest rates started to shoot up past 3.06%.
Higher Interest Rates Coming?
The financial media keeps telling us the economy is moving along just fine and higher rates are coming based on the fact the Fed says higher rates are coming. But what does the price action of rates show us? Interest rates are still low. The 3.06% rate mentioned above comes from the high of the last 12 months reached last year.
10 Year Daily Chart
10 Year Daily Chart
A decline of .02 on the 10 Year Treasury Note was the reaction for interest rates today despite the better than expected PPI report.
Commodities Declining
While we will get bounces in various commodities from time to time, like Natural Gas of late with the onslaught of winter snow hitting 50% of America earlier than expected, they are still mired in deflation and the Fed just can’t see it.
Have you seen commodity charts since 2011? Below is a chart of the Continuous Commodity Index (CCI). The Continuous Commodity Index is the CRB index in its original equal weight form from 1957.
CCI Index
CCI Index
As you can see from the chart, the 17 commodities that make up the index, including grains, oil and metals, all are falling in price since 2011.
Sure, when you go to the grocery store you’ll see many products that have higher prices. But some of that is related to the California drought driving up food prices. You also should consider the fact that more in America are on Food Stamps than ever before. If the government is buying a lot of the food, guaranteed, then the prices will move higher.
One cannot consider higher college tuition costs or government health care related prices being higher inflation related because anything the government guarantees in price gives the companies doing the selling carte blanche to raise prices.
Dollar Still Bullish
As you can see from the chart below the dollar has been bullish since 2011. This just so happens to be the year for the top in gold and silver. Deflation has a tendency to be dollar bullish, the opposite of inflation.
I had mentioned in an article from August of last year where I said I was dollar bullish that I eventually will become bullish on the dollar and precious metals at the same time. We’re not there yet, but I explained this scenario as to why in Chapter 4 of my first book Buy Gold and Silver Safely and will be explaining it further in my next book Illusions of Wealth.
US Dollar Index Daily Chart
US Dollar Index Daily Chart
What the Fed Can’t See
Dollar Strength Hurts Producers
Japan and Europe sure know that in order to become more competitive and see your economy grow you have to make your currency weaker. Does the Fed know this? Can they even do anything about dollar strength when perception out there is it’s a safe place to keep your wealth right now. If you are Japanese do you want your wealth in yen or dollars? Same goes for Europe right now with the decline of the Euro. What about South America countries like Brazil and Argentina? All of these countries want weaker currencies so they can improve their exports. Japan seems to be the most proactive.
A stronger dollar hurts producers here in the U.S.
Currencies that are too strong or too weak not only affect individual economies, but tend to distort international trade and economic and political decisions world-wide. This is compounded by the fact that individual consumers can benefit from changes in the value of a currency, while producers in the same country are hurt.
Europe and Japan Experiencing Recession and Deflation
Japan and Europe had worse than expected data come out yesterday. Economic data showed the Japanese economy in the last quarter contracted fueling hopes of more stimulus or a postponement of a sales tax hike due next year.
The IMF came out last week and said that the euro zone growth could be worse than expected.
Does the Fed not see that this could have an effect on the U.S.? Are some of the M&A deals offsetting the fact that American industrial production declined? Is the stock market possibly overvalued or does price action trump everything and follow the trend higher with stops? The trend is your friend and it sure hasn’t hurt those with 401k’s.
Perhaps the Fed Only Looks at Consumer Confidence
Does consumer confidence really mean anything? Aren’t they the last to know what’s going on? Did the majority of consumers not see the 2008 crisis coming? Perhaps the Fed believes the consumer knows all, but clearly they don’t despite October’s good consumer confidence numbers. Maybe the Fed should listen to the Measure of CEO Confidence where “slightly more than 44 percent of business leaders anticipate economic conditions will improve over the next six months, down from 53 percent last quarter.” Of course you can expect the bank CEO’s to keep their high salaries without a care for the economy since they know the most about how to make money; get it from the Fed!
The Fed is Reactive
The Fed reacts AFTER the fact. See the 2008 financial crisis which followed the Fed’s lowering of interest rates pre 2008 to do what; stimulate the economy. And when this current lower interest rate experiment fails we will see more intervention. Anyone see a pattern here? If not, study Japan. Then look to Europe for more problems. Eventually the U.S. will be swallowed up even more into this deflationary spiral and the Fed will fight it all the way.
The Fed also has their own issues to worry about now too as funding the government may be an issue again with the new Republican controlled Congress installed in 2015.
The Fed is going to be under more scrutiny with Republican control of the House and Senate in 2015.
A proposal was introduced in June to curtail how the central bank sets monetary policy…The measure would mandate the Federal Open Market Committee to map a plan or rule for how it would adjust interest rates.
Of course Fed Chairman Janet Yellen doesn’t like this claiming “the measure would interfere with the independence of monetary policy, by bringing political pressures to bear on the committee’s judgment.”
The Fed also ignores things like U-6 unemployment rate which is still over 11% and believe the economists who predict stronger fundamentals. How can you ignore this?
How All this Deflation Relates to Gold Today
Gold prices are still feeling the effects of many of the issues I brought up above. This includes a stronger dollar, no real inflation, commodities in a downward trend, countries experiencing deflation, strong treasuries, no money velocity and you can add a stock market that keeps money moving towards it rather than a beaten down asset like gold. One can’t ignore this.
My advice is to still dollar cost average into a position in the metals. While many utilize ETFs such as (GLD) or (SLV) to play the metals I prefer an investor hold the real thing.
My thoughts are that many of these indicators I follow will see gold break to lower lows after this run up we are experiencing and I do think the psychological figure of $1,000 will be taken out. After we take out that price level we may test the $850 level to break the back of gold bugs and get the CNBC cheerleaders to claim the gold bull dead. It is between this level that I will be writing my all in article. My indicators haven’t let me down so far and hopefully they won’t in trying to provide further good analysis.
For those that don’t know I write my current thoughts on my website 5 days a week, Sunday through Thursday. While we do concentrate on the gold and silver markets, I try to give my micro analysis on the miners and other investments (JNUG), )NUGT), (GDX), (JDST), (UGAZ), (TNA), (TZA), (USO)) where I see opportunity. Many calls have done quite well the past few weeks and I’ve received a lot of emails from readers thanking me for this recently added section to the site.
Yen in FREEFALL!
[img]http://cpasuccess.typepad.com/.a/6a00d834520c5769e2017c315f55ff970b-pi[/img]
RE
All Eyes On The Freefalling Yen Which Just Plunged To Fresh 7 Year Lows
Submitted by Tyler Durden on 11/19/2014 06:55 -0500
Once again all eyes are on the carry-trade driving Yen, whose avalance into oblivion is picking up speed, and where the formerly unimaginable USDJPY level of 120 as presented here in September, is now looking like this week’s business, with the only question how long until Albert Edwards’ next target of 145 is hit leading to nuclear currency warfare between Japan, Korea, China and ultimately, the US and Europe. Unfortunately, for Japan, at this point the terminal currency collapse will do nothing to incrementally boost exports or its economy, and the former Japan finmin was on the tape warning again that the Japanese recession will persist as USDJPY over 115 is now hurting Japan, something which should by now have been clear to most.
Then again with a money-printing Keynesian lunatic in charge, for whom there is now no turning back, Japan really has no options. The good news, at least for the US which is now openly pulling the strings behind Japan’s monetary policy, is that the soaring Yen will continue to drag correlation algos higher, and send the S&P500 to fresh all time highs even as the Japanese economy is devastated.
In other news, the much hyped Stock Connect between China and Hong Kong is a dud with volumes plunging and CLSA calling it a ghost traing. According to Bloomberg, about 2.6 billion yuan, or 20%, of the 13 billion yuan northbound daily quota was taken on day 3 of the link vs 100% and 37% on the 2 opening days. Of the Shanghai connect stocks, 242 were up, and 249 down; of the Hong Kong connect stocks only 81 were up, while 159 down.
Worse, the commodity rout continues, with the slide in iron ore prices has been a particular focus in the commodity complex with Dalian iron futures hitting a second consecutive record low as data in China continues to fail to impress. Nonetheless, precious metal prices have continued to see support with spot gold managing to break out of its tight overnight range to touch the USD 1,200/oz level
European equities enter the North American crossover mostly in the green after picking up off their worst levels which were seen earlier in the session following overnight weakness in Asian equities and pulling back some of yesterday’s gains. In terms of the rebound, nothing fundamental has been attributed the move higher, although it does coincide with the Gilt-led softness seen in fixed income products following the less dovish than expected BoE minutes release, which also saw short-sterling reverse its earlier flattening pattern. Despite the upside for European stocks, the FTSE 100 trades in the red as the continuing decline in iron prices has placed weight on the mining-heavy FTSE index, with names such as Rio Tinto and Antofagasta seeing a bout of underperformance.
Bulletin Headlines Summary
GBP/USD pulls off session lows following a less dovish than anticipated BoE minutes release, which has also placed pressure on fixed income products.
European equities trade mostly in the green with no sustained direction, although the FTSE 100 underperforms as Iron ore miners continue to feel the squeeze of the slide in iron ore prices.
Looking ahead, attention turns towards the release of US housing starts, building permits, DoE crude oil inventories and of course the FOMC minutes release.
Treasuries decline with core euro zone sovereigns amid heavy corporate issuance calendar and as investors awaits release of minutes from Fed’s October meeting.
Bank of England policy makers voted 7-2 to keep the key interest rate at a record low this month as some of the majority began to raise concerns about potential inflation pressures
Obama plans to issue a reprieve for undocumented immigrants whose children were born in the U.S., part of an order that would shield between 4m and 5m from deportation, according to people familiar with the proposal
Prime Minister Shinzo Abe invoked the American Revolution in calling a snap election and shelving a further increase in a tax that sank Japan into recession
BOJ’s Kuroda secured a wider majority today and warned inflation could fall below 1% after the world’s third- largest economy slid into recession
Keystone XL pipeline backers came up one vote short in the Senate and vowed to try again in January, when they expect to have enough support to send a bill to Obama
Sovereign yields mostly higher. Asian stocks mostly lower. European stocks gain, U.S. equity-index futures lower. Brent crude and gold higher, copper falls
US Event Calendar
7:00am: MBA Mortgage Applications, Nov. 14 (prior -0.9%)
8:30am: Housing Starts, Oct., est. 1.025m (prior 1.017m)
Housing Starts m/m, Oct., est. 0.8% (prior 6.3%)
Building Permits, Oct., est. 1.040m (prior 1.018m, revised 1.031m)
Building Permits m/m, Oct., est. 0.9% (prior 1.5%, revised 2.8%)
2:00pm: Minutes of October 28-29 FOMC meeting released
FX
One of the more notable movers in FX markets has been GBP following the BoE minutes. Despite residing at session lows in anticipation of an overtly dovish release, GBP saw a sharp move higher as the report revealed a 7-2 split and was not as dovish as some had expected. More specifically, particular focus was paid on comments that a tighter labour market is likely to lead to wage growth soon and the fact that the MPC majority said there is a risk of inflation overshooting the 2% target. Furthermore, CAD has continued to weaken with weakness being attributed to the failure of the Keystone pipeline bill to be passed in the Senate which would have seen the construction of an oil pipeline from Canada to US gulf refineries. Additionally, the decline in iron ore prices has filtered through to FX markets, with AUD seen lower throughout overnight and European trade with yesterday’s jaw-boning of the AUD and cross-related selling in AUD/JPY also placing further weight on the Antipodean currency. Elsewhere, overnight, USD/JPY broke back above 117.00 to trade at its highest since
COMMODITIES
The slide in iron ore prices has been a particular focus in the commodity complex with Dalian iron futures hitting a second consecutive record low as data in China continues to fail to impress. Nonetheless, precious metal prices have continued to see support with spot gold managing to break out of its tight overnight range to touch the USD 1,200/oz level. In the energy complex, despite opening lower following last nights API inventories which revealed a build of 3700k vs. Prev. drawdown of 1500k, energy prices have ebbed higher throughout European trade as participants look ahead to today’s DoE inventories with the headline expected to reveal a drawdown of 1500k, a number which is higher than initially forecasted.
DB’s Jim Reid Concludes the Overnight Recap
So after much excitement yesterday following Prime Minister Abe’s snap election announcement, sales-tax delay and planned stimulus package all eyes have turned to the BoJ meeting this morning. In terms of the headlines, as expected QE has remained steady at ¥80tn annually with the board having voted 8-1 in favour. After last month’s 5-4 vote it seems consensus has been built around the new measures which will be a relief to policy makers, especially after the measures announced this week. Taking a closer look at the details, the central bank notes that the outlook in Japan’s economy is ‘expected to continue its moderate recovery trend, and the effects including those of the subsequent decline in demand following the front-loaded increase prior to the consumption tax hike are expected to dissipate gradually’. CPI is expected to remain at the current level for the time being whilst there is some mention that QQE is so far exerting its intended effects with the Bank expected to continue with stimulus for as long as necessary to achieve the 2% target. The result is certainly a positive for Kuroda following what was largely a split decision last month on extending QE. The press conference takes place as we go to print so this is worth keeping an eye on for Kuroda’s take on this week’s fiscal events.
In terms of how markets are reacting post BoJ, the Nikkei is currently trading -0.14% having opened around +0.7% stronger and then declining to trade -0.3% lower post the decision. The JPY has weakened a further 0.37% versus the Dollar to now trade at 117.29 and mark a seven year low. Elsewhere bourses are mixed around Asia. The CSI 300, Hang Seng and Kospi are +0.11%, -0.41% and -0.01% respectively.
As well as the BoJ news to digest today, we’ve also got the FOMC minutes to look forward to later. It’s easy to make an argument either way with regards to what we might expect. On the one hand, we could make a case that the details could be something of a non-event with the focus shifting immediately to the December meeting. On the other hand DB’s Joe Lavorgna summed it up well at the start of the week, commenting that the statement from the October 28th- 29th meeting was notably more hawkish than expected, particularly with regards to the economy and upgrading its assessment of the labour market. Joe also mentions the lack of commentary around a stronger dollar or recently tightening financial conditions, so conceivably these could be mentioned. All in all the key will be whether the minutes rubber stamp the edging up in hawkishness or whether it will throw the doves an olive branch.
Whilst on the US, the S&P 500 continues to extend its record closing highs (+0.51%) after trading in a relatively narrow range over the past week. As well as being supported from the positive tone extending from Abe’s announcement, macro data did little to dampen sentiment. The NAHB housing market index surprised to the upside with the 58 print ahead of expectations of a 55 reading. Digging deeper into the details, all three subcomponents of the index – present conditions, expectations and buyers traffic – rose along with gains in all four regions of the country to cause the index to print just short of September’s post recession high (59). Our US colleagues point out that the NAHB series leads housing construction by around six months and so they expect a marked improvement in residential construction over the next couple of quarters, boosting total housing-related spending which they feel is enough to sustain a 3%-plus real GDP growth over next year. – a pretty bold call. Meanwhile the PPI reading for October was relatively strong. The headline (+0.2% mom) reading and ex. food and energy print (+0.4% mom) beat expectations of -0.1% and +0.1% respectively. Away from the macro prints, the Fed’s Kocherlakota was in the press once again, this time commenting that the Fed is risking its credibility by not acting aggressively enough to bring inflation back up to its 2% target. He also reiterated that inflation will not rise back to this target until 2018 with the potential for a turnaround in inflation through 2015 ‘very unlikely’. Treasuries were generally stronger across the board, the 10yr rallying 2bps whilst the DXY closed down 0.33% at the end of play.
Turning our focus to Europe yesterday, the Stoxx 600 closed +0.61% and the Euro rallied +0.67% versus the Dollar following an unexpectedly stronger German ZEW survey print with the 11.5 reading (0.5 expected) marking the first rise in German investor confidence for eleven months. Closer to home, UK CPI data was largely in line. The +1.3% yoy headline figure a touch higher than the +1.2% consensus although the core print came in slightly under expectations at +1.5% yoy (vs. +1.6% yoy expected). DB’s George Buckley noted that despite yesterday’s print showing a slight rise, he is revising his forecasts down to +0.9% by year end, rising to +1.6% in 2015 and then +1.9% in 2016, highlighting in particular that December will be a likely flashpoint for the CPI given the +6.4% rise in household energy bills last year not being repeated and thus taking 0.3% off the headline rate. Interestingly George also points out a move in sterling could take over three years to fully impact CPI inflation, suggesting that the annual rise in Sterling to peak in July this year will likely impact CPI towards the end of 2016. Elsewhere the RPI print came in line at +2.3% yoy whilst PPI input was softer at -8.4% yoy (-8.3% yoy expected). Gilts closed flat and elsewhere 10y Bunds ended 0.5bp firmer. Credit markets generally underperformed, Xover finished 4bps wider over the day although we highlight that this was perhaps due to more technical factors around significant new issuance. New issuance in the US market is also causing some indigestion.
Just wrapping up the market moves yesterday, WTI and Brent extended declines, down 1.68% and 1.21% respectively and have continued to trade weaker overnight. Ahead of the OPEC meeting next week, the FT has reported the apparent lack of consensus between members which is underlying the struggles the group is facing given surging US output. In terms of an outcome for the meeting, a disagreement between members is surely a worst case scenario so it will be interesting to see if we hear any of the major producers align comments in the mean time.
In terms of the highlights today, we kick off in Europe this morning with the September construction output print (market looking for +1.5% mom) along with current account data whilst later in the day we expect to hear from the ECB’s Praet speaking on the ‘long-term financing of the economy’ in Frankfurt. As well as this, we will be keeping an eye on the BoE’s November minutes today. Over in the US and away from the highlighted FOMC minutes we have October building permits and housing starts data (DB expecting 1.1m versus 1.025m consensus) and the MBA’s new mortgage applications. Given the strong NAHB print yesterday it will be interesting to see whether today’s housing data confirms the trend.
Picking and choosing, I see.
http://www.zerohedge.com/news/2014-11-18/one-readers-shocked-response-upon-learning-his-health-insurance-cost-just-doubled
Did you forget this one RE?
http://www.zerohedge.com/news/2014-11-18/record-beef-prices-soaring-28-got-you-down-then-drown-your-sorrows-cheaper-alcohol
Beef Prices go up because of insufficient water to feed cattle.
Health Insurance costs go up because that Ponzi is coming apart at the seams.
Credit however continues to contract for all but the TBTF Banks. Reason for that should be obvious. If you control credit creation, you can always issue it to yourself until the system collapses.
Overall, credit contraction is forced because of resource constraints. Obvious it had to collapse at some point.
Should get interesting from here.
RE
Jeebus Lawd Almighty!!!
RE, channeling his inner Flash, goes ape-shit copying and pasting …. trying, so to say, to prove my tan car is blue. Hilarious.
I guess someone REALLY wants to win an argument!
Good luck wif dat. Fact: virtually EVERY bill we have this year is HIGHER than last year. Deflation, my fuckin’ bunghole! I’ll believe my lying eyes before I give credence to these ridicules charts.
So solly.
Golden,
I thought as a gold bug you may get a good laugh out of the mainstream view on what they believe is real money. Just think how many average Joe’s will sell low, because of ignorant mainstream “experts”
Thanks for the clarification card802.
I should have known, the “You Can’t Eat Gold” line always burns my ass. I can’t count how many times a moon faced fuck head has hit me with that one.
The Fed just printed and handed out a couple of trillion to their friends both here and abroad, and I am still arguing with shit heads about the merits of Gold over fiat.
After skimming it, I’m glad I missed this thread. Been working on my response to Stucky’s post.
Stucky said:
” Fact: virtually EVERY bill we have this year is HIGHER than last year. Deflation, my fuckin’ bunghole!”
That’s why I suggest that people stock up on things like basic clothes (socks, u-wear etc.) instead of holding that money in savings beyond an emergency fund. It’s a virtual certainty those things will be more expensive next year and every year after. Everytime you shop for those items buy 2-3 times more than you need.
If you think you’ll be replacing appliances in the next 2-5 years or more, buy them now if you have room to store them. Going to be more expensive and crappier in the future and they’re going to come equipped with technology that reports your usage of them back mother ship.
Golden Ox aid:
“and I am still arguing with shit heads about the merits of Gold over fiat.”
Why bother? Those same shit heads will just try to rob you when TSHTF and realize YOU were right.
Reverse Engineer, EXACTLY as I said before, please let us know when you demonstrate the ability to think for yourself (let alone critically) and maybe what you WRITE will be worth reading. But if you are just a parrot sheeple (a subset of sheeple who specialize in not thinking and merely parroting their sheeple betters), there is more value in watching bobble heads on the telly with the volume turned off than waste a nano-second on your amateurish and completely unoriginal attempt to negate the most basic of facts…there are quite a few things that MATTER to a majority of the people in America that are going up in price, and will continue to do so, regardless of what some apartment dwelling Julia Child wanna be might think.
Stick to your recipes, drinking yourself to your sheeple happy place, and copy and paste skills, because sure as hell you don’t have what it takes to weave together a believable story when you choose to ignore reality. Run along now cupcake.
http://www.zerohedge.com/news/2014-11-19/usdjpy-hits-118-abes-worst-nightmare-weaker-currency-weaker-stocks
USDJPY Hits 118 – Abe’s Worst Nightmare: Weaker Currency, Weaker Stocks
Submitted by Tyler Durden on 11/19/2014 14:47 -0500
Having kneejerked higher, stocks read the most important section of the FOMC Minutes – that they will not be rescued next time – and decided it was time to take some off. This is clearly not acceptable and so USDJPY was leveraged ever higher and just broke 118.00. The problem is… US and Japanese stocks are entirely decoupled from this surge in the momentum igniter…
The JPY ignition is not working…
In Japanese stocks…
[img [/img]
And US…
[img [/img]
Since the FOMC Minutes…
[img [/img]
Competitive Currency Devaluation & Deflation now @ 200 Listens!
Yen, Euro & Oil Podcast @ 287
Japan Goes Full Retard @ 357
Thanks Fans!!!
[img [/img]
RE
Even Forbes is finally catching up with me. 🙂
RE
http://www.forbes.com/sites/investor/2014/11/17/japan-in-recession-warnings-of-a-global-financial-crisis/
Japan In Recession: Warnings Of A Global Financial Crisis
Bert Dohmen, Contributor
The major central banks have pursued a “zero interest rate policy” known as ZIRP, since the financial crisis of 2008-2009. More than $10.5 trillion of artificial credit were created. Has this unprecedented policy, never before seen in history, caused sustainable economic recoveries?
The evidence says: “No way.”
No recession, not even the Great Depression, has seen such anemic economic growth. Looking at it scientifically, instead of as an economist, we must ask, “Have central bank efforts to ‘stimulate’ actually done the opposite?” Has ZIRP actually contributed to global deflation?
Speaking at the International Finance Forum 2014 Conference in Beijing on November 1, 2014, the very influential Jaime Caruana, General Manager at the Bank for International Settlements (BIS), often called the “central bank for central bankers,” warned:
… the build-up of financial imbalances risks a future financial crisis, an impaired financial sector and a debt overhang.
The U.S. Federal Reserve has created an unprecedented $4 trillion out of thin air. The ECB in Europe has bought hundreds of billions of euros of government bonds in the market place. It is now apparently ready to create one trillion euros via new bond purchases.
Japan is an excellent example of the folly of central bank “stimulus.” In 2013 Japan surprised the markets with a huge $1.4 trillion stimulus and bond buying program. In proportion to GDP, that is twice the amount of the U.S. Federal Reserve’s last, huge quantitative easing effort. But Japan did something unintelligent: it raised the sales tax mid-year. In early 2014, I had predicted in the Wellington Letter that this planned tax hike would drive Japan’s economy back into recession.
After this summer’s sales tax hike in Japan, we wrote that Japan’s economy was coming to a screeching halt. Immediately thereafter, in the quarter ending June, Japan’s GDP plunged an amazing 7.1%. Such a plunge is usually only seen during depressions.
But economists didn’t worry, and just blamed it on the sales tax hike. We replied: it doesn’t matter what caused it, but it is happening. How can anyone ignore such a catastrophic decline?
On November 17, 2014 Japan released another shock: in the quarter ending September, GDP growth declined 1.6%. Two consecutive declining quarters qualify as a “recession.” That’s what they got for the biggest central bank stimulus in world history.
The Japanese government apparently had advance notice. On October 31, they announced another record shattering expansion of stimulus of about $800 billion. The reason: “inflation” is not rising as expected.
Additionally, the government and its pension fund will purchase ETFs in the market, not just in Japan’s own, but around the world. This is unprecedented. Governments everywhere usually follow the strategy: “if something doesn’t work, do more of it.”
Europe will now have a skirmish with deflation and recession. Deflation is appearing everywhere. Some of the major countries are on the borderline of recession. Even Germany saw negative economic growth last quarter. All the central bank’s (ECB) stimulus have done nothing except kept the zombie banks afloat.
What to do? On Nov. 17, the head of the ECB, Mario Draghi, announced that buying government bonds from around the euro zone is an option. He didn’t say that Germany must consent, although it is prohibited by German law for the country to participate in such action. Germany’s leadership recognizes the dangers of these programs.
China’s private sector economy is now going into recession in spite of the ‘official’ GDP growth of 7.3%, which is largely fiction. According to my work, China has been in a severe credit crunch since June 2013 when short term interest rates quadrupled overnight, from around 6% to 25%. Analysts ignored it and said it was “just a fluke.” Well, such flukes don’t happen in very large markets. It was a signal that the China credit crisis was accelerating and that the government was losing control.
China says that it will not bail out private companies. But it is ready to buy huge amounts of local government debt, railway bonds, and provide liquidity to the governmentally owned banks, in order to let the immense credit bubble deflate slowly without causing a deep recession. That seldom works, if ever.
…
Read the rest at Forbes
Fans? Of audio gibberish designed by sheeple, for sheeple?
Are you sure you want to consider THOSE folks….fans? Playing to the lowest common denominator might be all you are capable of in life, but shoot for more man!! It is not too late to reorient your life around quality thought and analysis instead of…what was it Golden said….dispensing red slime and then chest thumping as though this is something of value?
Aspire to be MORE!! There are enough sheeple in the world…strive to be..BETTER!! There are REASONS why people who can think critically are so afraid of your…kind.
[img [/img]
Actually, about half the referrals come from TBP. 🙂
RE
John – a friendly word of advice. There is an old adage about never wrestle a pig – you both get dirty and the pig likes it.
I will leave it to you to decide who is the pig in this analogy.
Another old adage is never bring a Knife to a Gunfight, and don’t send an Imbecile into an argument that takes some Intelligence. Pitching Ad Hom is no substitute for making a decent argument. Regurgitaing Sheeple over and over again is ridiculous, because that applies to just about everyone here by Imbecile John’s definition. Admin lives in a suburban community outside Philadelphia, Stucky lives in a suburban community in New Jersey, SSS lives on a Golf Course in FL etc.
Gasoline prices and many commodities from Copper to Iron are all experiencing deflation. Even Wheat prices have show a steady downward trend since 2012.
[img [/img]
Beef prices and Produce prices are being hit by production problems due to drought in many neighborhoods. So if you buy a lot of beef and fresh veggies, your bills probably are going up. Mine have been going down here overall, particularly with respect to gasoline, I’m paying a full Dollar less per gallon now than I was 6 months ago.
Anyhow, Imbecile John just does disruptive trolling, he doesn’t have any worthwhile arguments and overall he hasn’t got any real good ideas other than his fantasyland Jeremiah Johnson idea, which is not gonna work anywhere in the lower 48, and would be pretty hard to pull off up here too.
RE
Deflation puts Petrobras in the DEEP DOO DOO.
RE
http://www.telegraph.co.uk/finance/newsbysector/energy/oilandgas/11242193/Oil-industry-risks-trillions-of-stranded-assets-on-US-China-climate-deal.html
Oil industry risks trillions of ‘stranded assets’ on US-China climate deal
Petrobas’ hopes of becoming the world’s first trillion dollar company have deflated brutally
Petrobas stock has dropped 87pc from the peak
By Ambrose Evans-Pritchard
9:52PM GMT 19 Nov 2014
Brazil’s Petrobras is the most indebted company in the world, a perfect barometer of the crisis enveloping the global oil and fossil nexus on multiple fronts at once.
PwC has refused to sign off on the books of this state-controlled behemoth, now under sweeping police probes for alleged graft, and rapidly crashing from hero to zero in the Brazilian press. The state oil company says funding from the capital markets has dried up, at least until auditors send a “comfort letter”.
The stock price has dropped 87pc from the peak. Hopes of becoming the world’s first trillion dollar company have deflated brutally. What it still has is the debt.
Moody’s has cut its credit rating to Baa1. This is still above junk but not by much. Debt has jumped by $25bn in less than a year to $170bn, reaching 5.3 times earnings (EBITDA). Roughly $52bn of this has been raised on the global bond markets over the last five years from the likes of Fidelity, Pimco, and BlackRock.
Part of the debt is a gamble on ultra-deepwater projects so far out into the Atlantic that helicopters supplying the rigs must be refuelled in flight. The wells drill seven thousand feet through layers of salt, blind to seismic imaging.
The Carbon Tracker Initiative says the break-even price for these fields is likely to be $120 a barrel. It is much the same story – for different reasons – in the Arctic ‘High North’, off-shore West Africa, and the Alberta tar sands. The major oil companies are committing $1.1 trillion to projects that require prices of at least $95 to make a profit.
The International Energy Agency (IEA) says fossil fuel companies have spent $7.6 trillion on exploration and production since 2005, yet output from conventional oil fields has nevertheless fallen. No big project has come on stream over the last three years with a break-even cost below $80 a barrel.
“The oil majors could not even generate free cash flow when oil prices were averaging $100 ,” said Mark Lewis from Kepler Cheuvreux. They have picked the low-hanging fruit. New fields are ever less hospitable. Upstream costs have tripled since 2000.
“They have been able to disguise this by drawing down legacy barrels, but they won’t be able to get away with this over the next five years. We think the break-even price for the whole industry is now over $100,” he said.
A study by the US Energy Department found that the world’s leading oil and gas companies were sinking into a debt-trap even before the latest crash in oil prices. They increased net debt by $106bn in the year to March – and sold off a net $73bn of assets – to cover surging production costs.
The annual shortfall between cash earnings and spending has widened from $18bn to $110bn over the last three years. Yet these companies are still paying normal dividends, raiding the family silver to save face.
This edifice of leverage – all too like the pre-Lehman subprime bubble – will surely be tested after the 30pc plunge in Brent crude prices to $78 since June.
Prices could of course spike back up at any moment. Data from the US Commodity Futures Trading Commission show that speculators have taken out big bets on crude oil futures. NYMEX net long contracts have reached 276,000. This is a wager that the OPEC cartel will soon cut output.
Yet there is little sign so far that the Saudis are ready to do so on a big enough scale to make a difference. JP Morgan expects US crude to slide to $65 over the next two months, a level that could lead to a “cumulative default rate” of 40pc for the low-grade energy bonds that have financed much of the fracking boom, if it drags on for two years.
Gordon Kwan from Nomura says OPEC (or at least the Saudi-led part) is “engaged in a price war with US shale producers” and will not rest until it has inflicted serious damage. He thinks Saudi Arabia will deflate US crude prices to $70 and hold them there for three to six months, targeting high-cost shale plays in the Bakken and Eagle Ford fields.
OPEC has a clear motive to do this. The US has slashed its net oil imports by 8.7m barrels a day (b/d) since 2005, equal to the combined exports of Saudi Arabia and Nigeria. Yet this game of chicken could be dangerous. There will be collateral damage along the way.
Deutsche Bank says the oil price needed to balance the budget is $162 for Venezuela, $136 for Bahrain, $126 for Nigeria, and over $100 for Russia. Algeria is extremely high, and already sliding into political crisis. Any one of these countries could fly out of control.
Nor is it certain that $70 oil prices will in fact stop the US juggernaut. Shale wildcatters have hedged much of their production by selling forward into 2015 and 2016. They can withstand a short hit. Citigroup’s Edwin Morse says shale critics are “wildly underestimating” the resilience of key US fields.
Yet the greater question is whether any of the world’s oil projects in high-cost regions make sense as China and the US agree to slash carbon emissions. The accord signed between President Barack Obama and China’s Xi Jinping last week – if ratified by the US Congress – has devastating implications. Oil companies have booked vast assets that can never be burned.
These are the world’s G2 superpowers, the two biggest economies and biggest polluters. Their deal marks the end of a bitter stand-off between the rich nations and the emerging economies that has dogged climate talks for years. It isolates the dwindling band of hold-outs, and greatly increases the likelihood of a binding global accord in Paris next year.
The IEA says that two-thirds of all fossil fuel reserves are rendered null and void if there is a deal to limit CO2 levels to 450 particles per million (ppm), the target level agreed by scientists to stop the planet rising more than two degrees centigrade above pre-industrial levels.
Chevreux’s Mr Lewis said the fossil fuel industry would lose $28 trillion of gross revenues over the next two decades under a two degree climate deal, compared with business as usual. The oil companies would face “stranded assets” of $19 trillion.
The Obama-Xi deal does not in itself secure the two degree goal but it does commit China to peak CO2 emissions by 2030 for the first time. China will raise the share of renewable energy by 2020 from 15pc to 20pc, a remarkable target that can only be achieved by breakneck expansion of solar power.
China is already shutting down its coal-fired plants in Beijing. It has imposed a ban on new coal plants in key regions after a wave of anti-smog protests. Deutsche Bank and Sanford Bernstein both expect China’s coal use to peak as soon as 2016, a market earthquake given that the country currently consumes half the world’s coal supply.
The US in turn has agreed to cut emissions by 26-28pc below 2005 levels by 2025, doubling the rate of CO2 emission cuts to around 2.6pc each year in the 2020s.
Whether or not you agree with the hypothesis of man-made global warming, the political reality is that the US, China, and Europe are all coming into broad alignment. Coal faces slow extinction by clean air controls, while oil faces a future of carbon pricing that must curb demand growth far below what was once expected and below what is still priced into the business models of the oil industry.
This is happening just as solar costs fall far enough to compete toe-to-toe with diesel across much of Asia, and to reach “socket parity” for private homes in much of Europe and America. The technological advantage is moving only in one direction only as scientists learn how to capture ever more of the sun’s energy, and how to store the electricity cheaply for release during the night. The cross-over point is already in sight by the mid-2020s.
Mr Lewis said shareholders of the big oil companies are starting to ask why their boards are ignoring so much political and technological risk, investing their money in projects that are so likely to prove ruinous, and doing so mechanically as if nothing had changed.
“Alarm bells are ringing. Investors can see that this is unsustainable. They are starting to ask whether it wouldn’t be better to return cash to shareholders, and wind down the companies,” he said.
Great fortunes were made in 18th Century in the British canal boom. The network of waterways halved coal prices and drove the first leg of the Industrial Revolution. Yet you had to know when the game was up.
The canal industry was on borrowed time even before the Liverpool and Manchester Railway first opened in 1830, unleashing the railway mania that entirely changed the character of Britain.
These historic turning points are hard to call when you are living through them but much of today’s the fossil fuel industry has a distinct whiff of the 19th Century canals, a pre-modern relic in a world that his moving on very fast.
Revere says:
“Another old adage is never bring a Knife to a Gunfight, and don’t send an Imbecile into an argument that takes some Intelligence.”
says the only proven sheeple spotted in the open on this website….still waiting for a fine audio gibberish report on how to use air miles you accumulate buying everything you need at the local grocery store…and liquor store…and gas station…by either you, or your apartment dwelling neighbors.
In the meantime, the volume at which you drone (quick question for the group, is it common for drunk people to amp up their volume by default?) gibberish and common sheeple thought does not change the quality of the red slime you are shoveling.