

The biggest question we had ahead of today’s unprecedented GDP drop was “how do we show it on a chart without losing the impact of all other prints?” Well, for better or worse, this is the best we could come up with: at -32.9% annualized, Q2 GDP just plunged by the most on record.

And while the drop – which was generally priced in – was some 5 times worse than the adjusted Q1 GDP of -6.9%, it was just fractionally better than the -34.5% expected. Then again, with a third of the US economy effectively going offline in Q2, a worse outcome than during the great depression, a few percent here and there doesn’t really matter.
Some more details:
The second-quarter decrease in real GDP reflected decreases in consumer spending, exports, inventory investment, business investment, and housing investment that were partially offset by an increase in government spending. Imports, a subtraction in the calculation of GDP, decreased.
That said, the biggest contributor to the overall GDP drop was the crash in consumption – the decrease in consumer spending reflected decreases in services (led by health care) and goods (led by clothing and footwear).

Breaking down the components of GDP we get the following:
- Personal Consumption accounted for the bulk, or -25.05%, of the overall -32.9% GDP drop, and 5x more than the -4.75% Q1 GDP drop
- Fixed Investment subtracted another -5.38% from Q2 GDP, far worse than the modest -0.23% drop in Q1. Nonresidential fixed investment, or spending on equipment, structures and intellectual property fell 27% in 2Q after falling 6.7% prior quarter
- Change in Private Inventories subtracted another -3.98%, 3x more than the -1.34% in Q1
- Net Exports contributed 0.68% to GDP, consisting of a -9.38% drop from Exports offset by a 10.06% boost from imports. The decrease in exports primarily reflected a decrease in goods (led by capital goods).
- Government consumption was a paltry 0.82%, up from 0.22% in the previous quarter

For those following the PCE data, the GDP price index fell 1.8% in 2Q after rising 1.4% prior quarter; core PCE q/q fell -1.1% in 2Q after rising 1.6% in the prior quarter.
Meanwhile, even though we already knew this, real disposable personal income (DPI)—personal income adjusted for taxes and inflation—increased 44.9% in the second quarter after increasing 2.6% in the first quarter. The increase in DPI was more than accounted for by an increase in personal current transfer receipts – i.e., government social benefits. Personal saving as a percent of disposable personal income was 25.7 percent in the second quarter, compared with 9.5 percent in the first quarter.
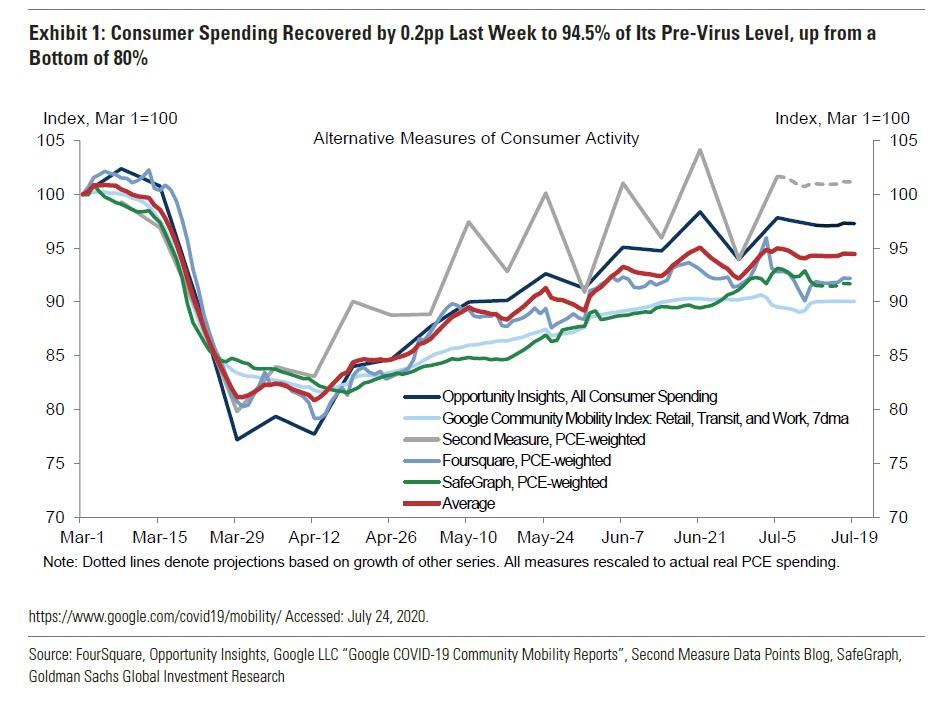
That said, the GDP collapse was expected, and in fact may be spun as “better than expected.” The real question is what happens next, and is Q3 the V-shaped recovery quarter. Alas, as both the Fed yesterday, and we showed last week, the high frequency data indicate that the US economy peaked in late June and is once again rolling over.
It is my sincere desire to provide readers of this site with the best unbiased information available, and a forum where it can be discussed openly, as our Founders intended. But it is not easy nor inexpensive to do so, especially when those who wish to prevent us from making the truth known, attack us without mercy on all fronts on a daily basis. So each time you visit the site, I would ask that you consider the value that you receive and have received from The Burning Platform and the community of which you are a vital part. I can't do it all alone, and I need your help and support to keep it alive. Please consider contributing an amount commensurate to the value that you receive from this site and community, or even by becoming a sustaining supporter through periodic contributions. [Burning Platform LLC - PO Box 1520 Kulpsville, PA 19443] or Paypal
-----------------------------------------------------
To donate via Stripe, click here.
-----------------------------------------------------
Use promo code ILMF2, and save up to 66% on all MyPillow purchases. (The Burning Platform benefits when you use this promo code.)


If this is how bad they say it is, imagine how bad it really is.
Just what Dr Fauci ordered…
Waiting for Trump to tell us that if we had voted Democrat, it would have printed -50%. Winning!
And who here is surprised? Speak up. And win your prize.
Green shoots and V-shaped recovery.
A rising tide hides the barnacles.
All the excuse congressional whores need to pass another 3 or 4 trillion stimulus.
Housing hasn’t taken a hit and neither has the stock market. No problem.
Now more than ever…Gold and Silver are “Real Money “.
The “Big Dump ” is coming soon, make sure you’ve got plenty of financial paper for the butt wiping .
Within 5 years the “Franklin’ will be single ply and an inch shorter.
John Williams at his Shadowstats site lays out the Details. Facts and stats for something that is trivially obvious to any observer that may be looking at reality of what is happening.
http://www.shadowstats.com/article/depression-special-report
An article from 2009?
Many people suspected that the 1929 crash,i.e.”the Great Depression” was engineered.We know that this “Greater Depression” is a planned event.Kill the American economy over the Wuhan Flu ,but didn’t do shyte when ebola arrived here in 2014? Makes total sense,don’t it.
Can anyone explain why Trumpty Dumpty is not giving talks nightly about how to get our country back on it’s feet? What do they have on him? Or is he just in on it. Bueller?
I’m always amazed that people are surprised by this. WE SHUT DOWN THE EFFING ECONOMY! What did people expect?