

Submitted by EPB Macro Research’s Eric Basmajian,
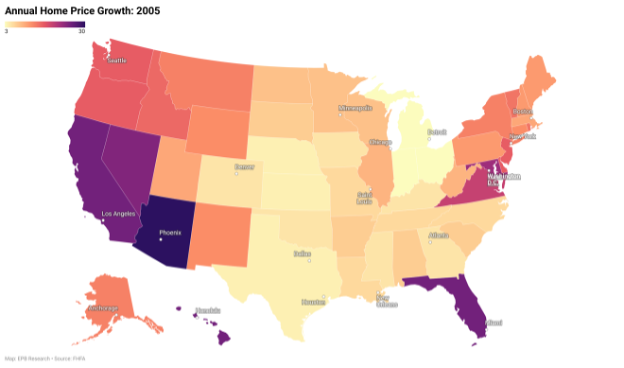
This is a map of home price growth at the housing bubble’s peak in 2005.
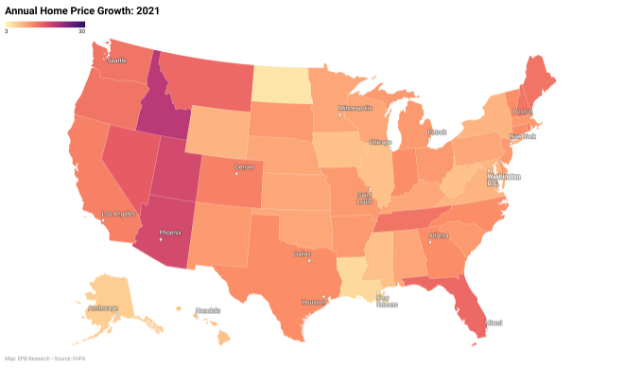
And this is a map of home price growth at the peak of the housing bubble in 2021.
See the difference?
When we look at home price growth at the peak of the last bubble in 2005, what we see is that home price growth was very concentrated in certain states and cities. Arizona, Nevada, California and Florida saw annual home price growth above 20%.
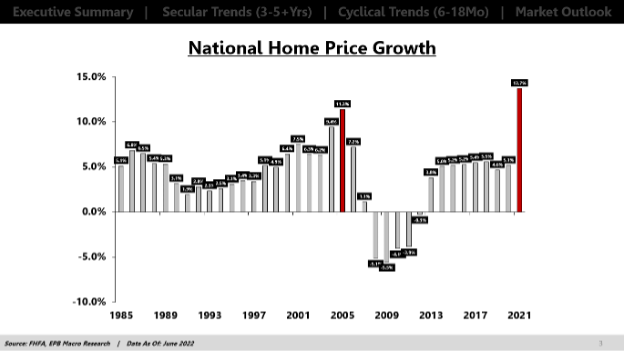
National home price growth averaged about 11% at the peak in 2005.
Today, national home price growth is higher than at the peak of the last housing bubble at almost 14% and when we look at the previous maps, we can see the price appreciation is much more broad based. The biggest bubble in 2005, which was Arizona, was crazier than the biggest bubble today, which is Idaho but today there are 38 states with annual home price growth over 10%. At the peak in 2005, only 26 states had annual home price growth above 10%.
So will a housing crash today be worse than 2008 given how much more pervasive the rampant home price growth has been? For that we’ll have to look at the leading indicators of home price growth, debt levels, and Federal Reserve policy.
There are several key leading indicators of real home price growth that I noted in my most recent post on home prices.
We discussed the months supply of newly constructed homes, the mortgage spread or mortgage rates, and the growth rate of real M2.
The months supply metric shows how many months it will take to clear the current pool of inventory at the current pace of sales. Months supply has exploded to 10.9 which means it will take almost 11 months to get rid of all the inventory of new homes in the pipeline at the current rate of sales. The months supply of newly constructed homes is a leading indicator of home price growth. Higher months supply today means lower home prices to follow.
We’re more concerned about the inventory of new homes compared to existing homes because all the economic activity and jobs are attached to new construction rather than existing homes.
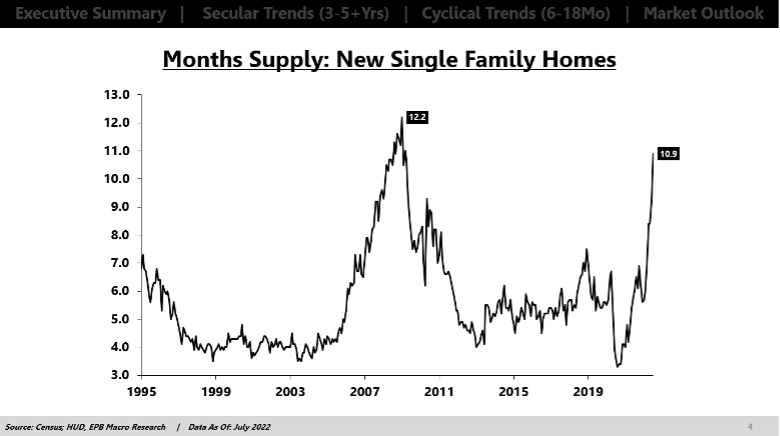
In 2008, the months supply figure exploded to 12.2 so it’s not quite as bad yet, although it could get there.
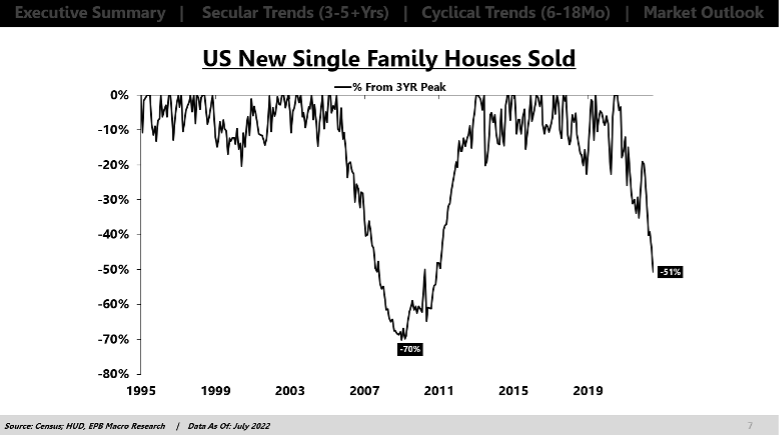
The pace of sales volume is completely collapsing today and there’s no signs of a slowdown in the pace of decline. The volume of new home sales is down 51% since August 2020. In 2008 and into 2009, new home sales fell by 70% so it’s not quite as bad yet, but we haven’t hit bottom yet.
In terms of mortgage rates, we have a problem today that is WORSE than 2008. In 2006, mortgage rates jumped 1.3% on a year over year basis. So in 2006, when the housing bubble started to pop mortgage rates were 6.8% compared to 5.5% a year earlier. This spike in mortgage rates kills home prices because people just can’t afford rising home prices and rising mortgage rates.
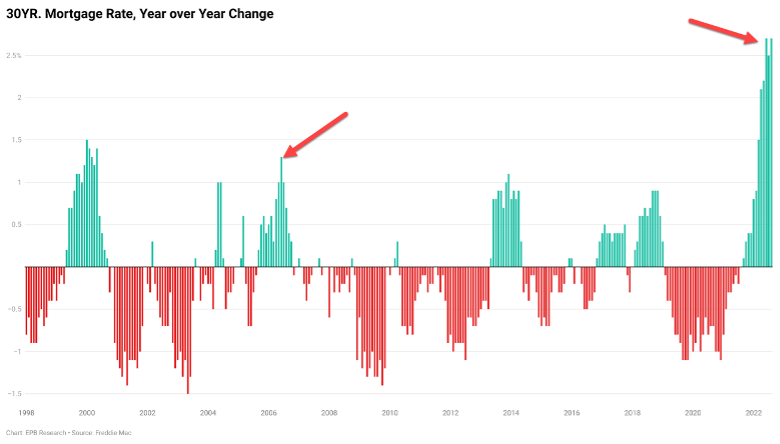
While mortgage rates today are 5.6%, lower than in 2006, the spike or the pace of increase is much worse. Mortgage rates today are more than 2.7% higher than just one year ago!
So the pace of increase in mortgage rates is double the pace of the 2006 period that caused that housing bubble to pop. That’s an ominous sign that will cause buyer demand to stop dead in it’s tracks…something we are already starting to witness with new home sales crashing 51%.
The next metric to consider is the rate of liquidity growth or money growth.
In the lead up to the peak in the housing bubble in 2006, liquidity growth was NOT excessive. The bubble in 2006 and the crash in 2008 was more about a debt crisis and cheap credit.
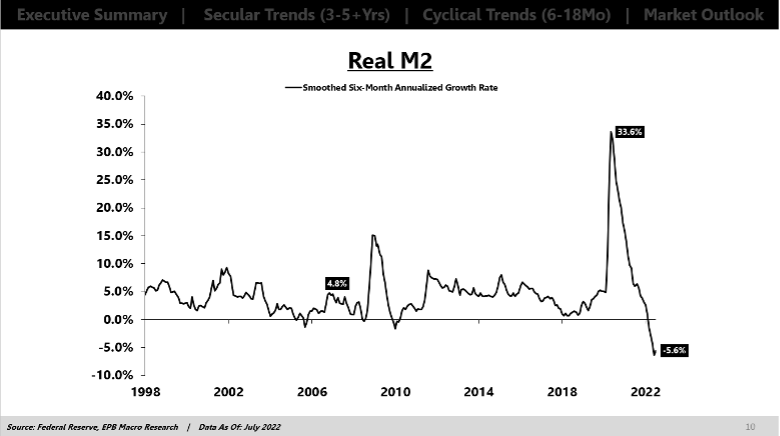
Money growth in 2020 and 2021 was more than six times as high as it was in the mid 2000s which is why the housing bubble this time is more broad based rather than concentrated in select cities like it was in 2005 and 2006. Todays’ bubble is more about record liquidity growth that was channeled into financial assets.
And when big institutions started to access the single family home market, housing became just another financial asset that was an easy recipient of this excess liquidity that historically stayed trapped in the stock market. This is a major difference to the 2008 bubble. The banks helped to facilitate a housing bubble by granting loans to households, but most of the housing activity was in the household sector itself.
Today, we have financial innovation in which big institutions and private equity funds that can easily access the Fed’s new liquidity have moved into single family homes. We don’t know what a housing downturn will look like now that bigger players are involved. These are speculators vs. home owners.
Money growth never contracted or slowed below 0% when the 2006 housing bubble popped, not until mid 2008. Today, money growth is falling sharply as the Federal Reserve pulls liquidity out of the system to correct an ongoing inflation problem.
So just as easily as home prices went up because of liquidity, we may see the reverse.
So the inventory issue is not quite as bad as 2008 which is a good thing but the spike in mortgage rates is way worse and the contraction in liquidity growth is more intense.
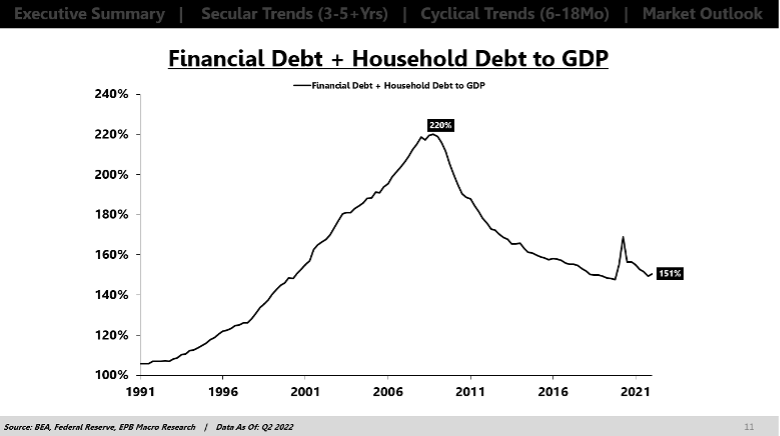
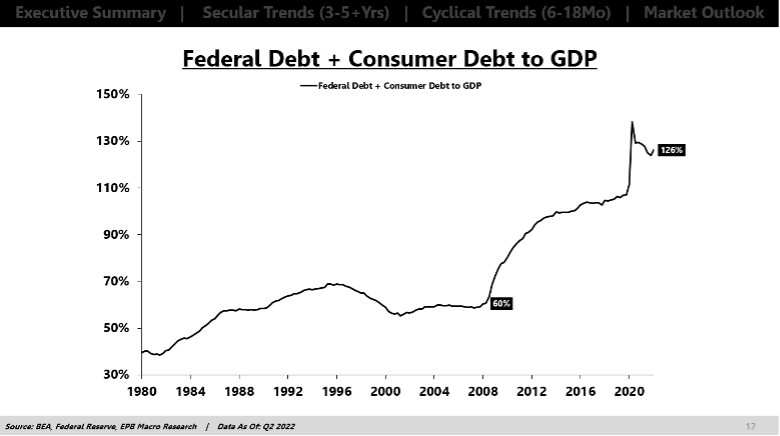
The debt bubble was worse in 2008 because the debt was concentrated in the banking sector and the household sector in the form of mortgages. Together, the household and financial sector had almost 220% debt to GDP compared to 150% today. So the 2008 crisis started as a housing problem but it morphed into a banking crisis.
Today, we have a housing problem that by most metrics is on pace to be worse than 2008 but we don’t have the private sector debt toxicity to turn the housing downturn into a banking meltdown.
Today we have a bigger debt problem in the Federal Government and the household debt is concentrated in what we call consumer debt, mainly student loans and auto loans, not so much mortgage debt.
Today we have a much broader bubble than we did in the peak of 2005 and 2006. The month’s supply of new homes is surging towards 2007-2008 levels but it’s not there yet. Mortgage rates are spiking way faster so the affordability crisis is worse, particularly when you add on food inflation, rent inflation and gas inflation. Also the rate of liquidity contraction is more intense to correct a big mistake the Fed made in 2020 and 2021.
The 2022 housing crash certainly has the potential to be worse than 2008 if we’re talking about the housing market itself. There’s much less of a chance that this housing downturn morphs into a global banking crisis. The nonfinancial shadow banking sector? That’s a story for another day…
This video explains the impending troubles headed for the housing market.
It is my sincere desire to provide readers of this site with the best unbiased information available, and a forum where it can be discussed openly, as our Founders intended. But it is not easy nor inexpensive to do so, especially when those who wish to prevent us from making the truth known, attack us without mercy on all fronts on a daily basis. So each time you visit the site, I would ask that you consider the value that you receive and have received from The Burning Platform and the community of which you are a vital part. I can't do it all alone, and I need your help and support to keep it alive. Please consider contributing an amount commensurate to the value that you receive from this site and community, or even by becoming a sustaining supporter through periodic contributions. [Burning Platform LLC - PO Box 1520 Kulpsville, PA 19443] or Paypal
-----------------------------------------------------
To donate via Stripe, click here.
-----------------------------------------------------
Use promo code ILMF2, and save up to 66% on all MyPillow purchases. (The Burning Platform benefits when you use this promo code.)


Yes. And then we’ll buy a little house on the prairie.
A temporary blip. Buyers expect a crash because of interest rates and past experience.
As the DYX indicates , despite money creation , foreigners are hungry for DOLLAR denominated private assets.
Real estate in certain regions will go down 10 to 20% and then soar despite higher interest rates.
There will be inflation nation wide that the Fed can’t stop because the government will be able to sell T Bills to the Fed at elevated interst rates. The Fed gets the bonds , the government gets the Federal Reserve notes.
There will be less private sector lending due to higher rates but the government borrowing will subsume that.
When the real estate buyers see the inflation, that new higher interest rate will look low. And they will jump at the 10 to 20% price discount in prime safe real estate regions.
What is coming is going to be more awful than anything since 1929. Almost 100 years, the crisis of the 4th Turning is here. I cannot imagine what will happen. Worse than WWII and Stalin? Is that possible. I hope not.
Back then, people still wanted to live in those “hot” states.
Cultural demographics are at play. Idaho is a redoubt for white people, which is why it is the top growth market. Any state that can do the same will maintain housing values or even increase values. Builders should concentrate their efforts in states that are white-friendly and get out of the woke states. Whites could turn Vermont and Maine Red if they concentrate there. They already have most of New Hampshire. MA to MD/DC are lost. Virginia is in a renaissance. Cultural secession and flight will drive the markets.
5 million illegals since Biden, accelerating numbers flowing over the border.
Those people are flowing everywhere and they are having lots of babies.
Getting interesting to say the least. They are staying in hotels for now.
Idaho became a boom state due to the growth of high paying construction jobs. 40% of all jobs in Idaho are construction related in some way. Prior to the housing boom Idaho population grew slowly due to the lack of good paying jobs.
Now with Idaho property values falling at the fastest rate in the country, the building is slowing and the construction jobs are going away. Many of the people who came to Idaho to cash in on the boom will have no choice but to relocate when their jobs go away and they must search for employment somewhere else.
There is a lot of bullshit surrounding this issue, but when you break it down to the root analysis, every housing boom and bust is basically the same animal although circumstances often vary.
Every boom is fueled by speculation of rising prices due to expanding credit. The crash comes when prices reach a point of exhaustion, and speculative gains turn into speculative loses.
In 2008 prices became unsustainable, and the market crashed when the realization became undeniable that prices were falling. This happened despite mortgage rates falling by approximately 50% from 2008 to the trough of bust in 2012.
This time not only are prices completely out of line with intrinsic value, and speculation rampant, we are facing the complete opposite situation with mortgage rates rising 50% instead of falling.
It does not take a rocket scientist to deduce from these circumstances that this crash will be much worse than 2008.