THE OLIGARCH STORYLINE IS GROWING OLD AND TIRED

The headline from the MSM this morning was that consumer spending was really strong in December after a fantastic November.

Consumer spending rose a seasonally adjusted 0.4% last month, the Commerce Department said. Economists polled by MarketWatch had forecast a 0.2% gain. The advance in December follows an upwardly revised 0.6% increase in November. The pace of spending in the last two months of the year marked the strongest back-to-back gain since the first two months of 2012.

The lead into this story makes it sound like the consumer is healthy and doing fantastic. You have to go over to Zero Hedge to find a chart that says it all.


Does this chart show a healthy consumer? It shows me we’ve entered a world of pain. Buried in the propaganda spewed by the corporate legacy media is the FACT that real disposable income FELL in December. The consumer had to delve into their dwindling savings to create that STRONG spending in December and November. The savings rate was 5.1% in September and plummeted to 3.9% by December. Last December the savings rate was 8.7%.

Do the oligarchs realize their propaganda doesn’t pass the smell test? They desperately want the ignorant masses to believe consumer spending was strong in November and December. We know for a fact that retail sales absolutely sucked in November and December from the Commerce Dept report from two weeks ago. Sales declined at auto dealerships, furniture retailers, electronics stores, and home stores. We know for a fact that virtually every large retailer in the country has reported dreadful sales and profit results for their Christmas season. Wal-Mart issued a profit warning today. Target issued one two weeks ago. Macys, Sears, and JC Penney are closing stores.

A critical thinking individual might wonder how consumer spending could be really strong if every major retailer is reporting horrific results. Luckily for the oligarchs, critical thinking is a skill not used too much in this country. Edward Bernays’ students of propaganda in the government and MSM know this and utilize our ignorance to the max.

The MSM story mentioned that the increase is being driven by spending on services. Now we are getting to the truth. The average American is ramping up their consumption in Obamacare premiums, utility bills, tolls, sewer fees, and the myriad of other government driven costs. The average American is dipping into their savings to pay for the massive Obamacare premium increases. I guess that doesn’t make a good headline on Marketwatch.com.

Going to the actual data reveals a few more interesting tidbits about the strong consumer:

  • Total personal income, before inflation, in December was 1% below last year.
  • Total wages, before inflation, were up by a whole .6%.
  • No need to worry. Government entitlement transfers soared by $53 billion over the last year.
  • Bernanke did his part by making sure senior citizens and savers didn’t earn one nickle more than last year in interest.
  • You’ll be happy to know that even though wages barely budged, the government syphoned  off an additional $100 Billion of your money in taxes versus last December.
  • Disposable income was 2% lower than last December, before inflation.
  • Americans spent $400 billion more this December than last December by drawing down savings and borrowing. They didn’t spend this at retailers. They borrowed for 7 years to essentially rent new cars, paid more for food, energy, rent, tuition, and Obamacare premiums.

Does this present a picture of a strong consumer? My favorite piece of data from the government website is at the very bottom. It is Real per capita disposable income. It takes into consideration inflation and the fact that the US population grows by 2.2 million people per year. This info paints the real picture of the American consumer.

The real disposable personal income per person in this country was $36,877 in December. It was $38,170 last December. That is a 3.4% decline. And remember, that is using the hugely understated CPI. Now for the really good stuff. The real disposable personal income per person was $37,584 in May of 2008. We are now almost six years later and disposable income per person in this country is still lower than it was in 2008.

Obama proclaimed all the great things he had accomplished in his five years in office. If unemployment has plummeted and the economy is booming at 4%, how can this be so? It can’t. You’ve been fed a fake storyline. It’s like the American Dream. You have to be asleep to believe it.

And anyone peddling the storyline that 2014 will be better is a knave or a fool – or works for CNBC. Over 1.2 million people just got booted off  the long-term unemployment rolls. The SNAP program will be doling out $5 billion less of your tax dollars in 2014. The stock market appears to be a tad shakey. Obamacare premium increases will be pounding those employed. Small businesses will not be hiring. Retailers are firing thousands of employees. Energy prices will set new records. Droughts in the West will result in higher food prices. Home prices will fall as home sales stagnate.

Sounds like a recipe for a great 2014. The storyline has been played out. The people don’t believe anything the oligarchs say. We have been lost in a blizzard of lies, but we can see the truth off in the distance if we look hard enough.

THE RETAIL DEATH RATTLE

“I was part of that strange race of people aptly described as spending their lives doing things they detest, to make money they don’t want, to buy things they don’t need, to impress people they don’t like.”Emile Gauvreau

If ever a chart provided unequivocal proof the economic recovery storyline is a fraud, the one below is the smoking gun. November and December retail sales account for 20% to 40% of annual retail sales for most retailers. The number of visits to retail stores has plummeted by 50% since 2010. Please note this was during a supposed economic recovery. Also note consumer spending accounts for 70% of GDP. Also note credit card debt outstanding is 7% lower than its level in 2010 and 16% below its peak in 2008. Retailers like J.C. Penney, Best Buy, Sears, Radio Shack and Barnes & Noble continue to report appalling sales and profit results, along with listings of store closings. Even the heavyweights like Wal-Mart and Target continue to report negative comp store sales. How can the government and mainstream media be reporting an economic recovery when the industry that accounts for 70% of GDP is in free fall? The answer is that 99% of America has not had an economic recovery. Only Bernanke’s 1% owner class have benefited from his QE/ZIRP induced stock market levitation.

Source: WSJ

The entire economic recovery storyline is a sham built upon easy money funneled by the Fed to the Too Big To Trust Wall Street banks so they can use their HFT supercomputers to drive the stock market higher, buy up the millions of homes they foreclosed upon to artificially drive up home prices, and generate profits through rigging commodity, currency, and bond markets, while reducing loan loss reserves because they are free to value their toxic assets at anything they please – compliments of the spineless nerds at the FASB. GDP has been artificially propped up by the Federal government through the magic of EBT cards, SSDI for the depressed and downtrodden, never ending extensions of unemployment benefits, billions in student loans to University of Phoenix prodigies, and subprime auto loans to deadbeats from the Government Motors financing arm – Ally Financial (85% owned by you the taxpayer). The country is being kept afloat on an ocean of debt and delusional belief in the power of central bankers to steer this ship through a sea of icebergs just below the surface.

The absolute collapse in retail visitor counts is the warning siren that this country is about to collide with the reality Americans have run out of time, money, jobs, and illusions. The most amazingly delusional aspect to the chart above is retailers continued to add 44 million square feet in 2013 to the almost 15 billion existing square feet of retail space in the U.S. That is approximately 47 square feet of retail space for every person in America. Retail CEOs are not the brightest bulbs in the sale bin, as exhibited by the CEO of Target and his gross malfeasance in protecting his customers’ personal financial information. Of course, the 44 million square feet added in 2013 is down 85% from the annual increases from 2000 through 2008. The exponential growth model, built upon a never ending flow of consumer credit and an endless supply of cheap fuel, has reached its limit of growth. The titans of Wall Street and their puppets in Washington D.C. have wrung every drop of faux wealth from the dying middle class. There are nothing left but withering carcasses and bleached bones.

The impact of this retail death spiral will be vast and far reaching. A few factoids will help you understand the coming calamity:

  • There are approximately 109,500 shopping centers in the United States ranging in size from the small convenience centers to the large super-regional malls.
  • There are in excess of 1 million retail establishments in the United States occupying 15 billion square feet of space and generating over $4.4 trillion of annual sales. This includes 8,700 department stores, 160,000 clothing & accessory stores, and 8,600 game stores.
  • U.S. shopping-center retail sales total more than $2.26 trillion, accounting for over half of all retail sales.
  • The U.S. shopping-center industry directly employed over 12 million people in 2010 and indirectly generated another 5.6 million jobs in support industries. Collectively, the industry accounted for 12.7% of total U.S. employment.
  • Total retail employment in 2012 totaled 14.9 million, lower than the 15.1 million employed in 2002.
  • For every 100 individuals directly employed at a U.S. regional shopping center, an additional 20 to 30 jobs are supported in the community due to multiplier effects.

The collapse in foot traffic to the 109,500 shopping centers that crisscross our suburban sprawl paradise of plenty is irreversible. No amount of marketing propaganda, 50% off sales, or hot new iGadgets is going to spur a dramatic turnaround. Quarter after quarter there will be more announcements of store closings. Macys just announced the closing of 5 stores and firing of 2,500 retail workers. JC Penney just announced the closing of 33 stores and firing of 2,000 retail workers. Announcements are imminent from Sears, Radio Shack and a slew of other retailers who are beginning to see the writing on the wall. The vacancy rate will be rising in strip malls, power malls and regional malls, with the largest growing sector being ghost malls. Before long it will appear that SPACE AVAILABLE is the fastest growing retailer in America.

The reason this death spiral cannot be reversed is simply a matter of arithmetic and demographics. While arrogant hubristic retail CEOs of public big box mega-retailers added 2.7 billion retail square feet to our already over saturated market, real median household income flat lined. The advancement in retail spending was attributable solely to the $1.1 trillion increase (68%) in consumer debt and the trillion dollars of home equity extracted from castles in the sky, that later crashed down to earth. Once the Wall Street created fraud collapsed and the waves of delusion subsided, retailers have been revealed to be swimming naked. Their relentless expansion, based on exponential growth, cannibalized itself, new store construction ground to a halt, sales and profits have declined, and the inevitable closing of thousands of stores has begun. With real median household income 8% lower than it was in 2008, the collapse in retail traffic is a rational reaction by the impoverished 99%. Americans are using their credit cards to pay their real estate taxes, income taxes, and monthly utilities, since their income is lower, and their living expenses rise relentlessly, thanks to Bernanke and his Fed created inflation.

The media mouthpieces for the establishment gloss over the fact average gasoline prices in 2013 were the second highest in history. The highest average price was in 2012 and the 3rd highest average price was in 2011. These prices are 150% higher than prices in the early 2000’s. This might not matter to the likes of Jamie Dimon and Jon Corzine, but for a middle class family with two parents working and making 7.5% less than they made in 2000, it has a dramatic impact on discretionary income. The fact oil prices have risen from $25 per barrel in 2003 to $100 per barrel today has not only impacted gas prices, but utility costs, food costs, and the price of any product that needs to be transported to your local Wally World. The outrageous rise in tuition prices has been aided and abetted by the Federal government and their doling out of loans so diploma mills like the University of Phoenix can bilk clueless dupes into thinking they are on their way to an exciting new career, while leaving them jobless in their parents’ basement with a loan payment for life.


The laughable jobs recovery touted by Obama, his sycophantic minions, paid off economist shills, and the discredited corporate legacy media can be viewed appropriately in the following two charts, that reveal the false storyline being peddled to the techno-narcissistic iGadget distracted masses. There are 247 million working age Americans between the ages of 18 and 64. Only 145 million of these people are employed. Of these employed, 19 million are working part-time and 9 million are self- employed. Another 20 million are employed by the government, producing nothing and being sustained by the few remaining producers with their tax dollars. The labor participation rate is the lowest it has been since women entered the workforce in large numbers during the 1980’s. We are back to levels seen during the booming Carter years. Those peddling the drivel about retiring Baby Boomers causing the decline in the labor participation rate are either math challenged or willfully ignorant because they are being paid to be so. Once you turn 65 you are no longer counted in the work force. The percentage of those over 55 in the workforce has risen dramatically to an all-time high, as the Me Generation never saved for retirement or saw their retirement savings obliterated in the Wall Street created 2008 financial implosion.

To understand the absolute idiocy of retail CEOs across the land one must parse the employment data back to 2000. In the year 2000 the working age population of the U.S. was 213 million and 136.9 million of them were working, a record level of 64.4% of the population. There were 70 million working age Americans not in the labor force. Fourteen years later the number of working age Americans is 247 million and only 144.6 million are working. The working age population has risen by 16% and the number of employed has risen by only 5.6%. That’s quite a success story. Of course, even though median household income is 7.5% lower than it was in 2000, the government expects you to believe that 22 million Americans voluntarily left the labor force because they no longer needed a job. While the number of employed grew by 5.6% over fourteen years, the number of people who left the workforce grew by 31.1%. Over this same time frame the mega-retailers that dominate the landscape added almost 3 billion square feet of selling space, a 25% increase. A critical thinking individual might wonder how this could possibly end well for the retail genius CEOs in glistening corporate office towers from coast to coast.

This entire materialistic orgy of consumerism has been sustained solely with debt peddled by the Wall Street banking syndicate. The average American consumer met their Waterloo in 2008. Bernanke’s mission was to save bankers, billionaires and politicians. It was not to save the working middle class. You’ve been sacrificed at the altar of the .1%. The 0% interest rates were for Jamie Dimon and Lloyd Blankfein. Your credit card interest rate remained between 13% and 21%. So, while you struggle to pay bills with your declining real income, the Wall Street bankers are again generating record profits and paying themselves record bonuses. Profits are so good, they can afford to pay tens of billions in fines for their criminal acts, and still be left with billions to divvy up among their non-prosecuted criminal executives.

Bernanke and his financial elite owners have been able to rig the markets to give the appearance of normalcy, but they cannot rig the demographic time bomb that will cause the death and destruction of our illusory retail paradigm. Demographics cannot be manipulated or altered by the government or mass media. The best they can do is ignore or lie about the facts. The life cycle of a human being is utterly predictable, along with their habits across time. Those under 25 years old have very little income, therefore they have very little spending. Once a job is attained and income levels rise, spending rises along with the increased income. As the person enters old age their income declines and spending on stuff declines rapidly. The media may be ignoring the fact that annual expenditures drop by 40% for those over 65 years old from the peak spending years of 45 to 54, but it doesn’t change the fact. They also cannot change the fact that 10,000 Americans will turn 65 every day for the next sixteen years. They also can’t change the fact the average Baby Boomer has less than $50,000 saved for retirement and is up to their grey eye brows in debt.

With over 15% of all 25 to 34 year olds living in their parents’ basement and those under 25 saddled with billions in student loan debt, the traditional increase in income and spending is DOA for the millennial generation. The hardest hit demographic on the job front during the 2008 through 2014 ongoing recession has been the 45 to 54 year olds in their peak earning and spending years. Combine these demographic developments and you’ve got a perfect storm for over-built retailers and their egotistical CEOs.

The media continues to peddle the storyline of on-line sales saving the ancient bricks and mortar retailers. Again, the talking head pundits are willfully ignoring basic math. On-line sales account for 6% of total retail sales. If a dying behemoth like JC Penney announces a 20% decline in same store sales and a 20% increase in on-line sales, their total change is still negative 17.6%. And they are still left with 1,100 decaying stores, 100,000 employees, lease payments, debt payments, maintenance costs, utility costs, inventory costs, and pension costs. Their future is so bright they gotta wear a toe tag.

The decades of mal-investment in retail stores was enabled by Greenspan, Bernanke, and their Federal Reserve brethren. Their easy money policies enabled Americans to live far beyond their true means through credit card debt, auto debt, mortgage debt, and home equity debt. This false illusion of wealth and foolish spending led mega-retailers to ignore facts and spread like locusts across the suburban countryside. The debt fueled orgy has run out of steam. All that is left is the largest mountain of debt in human history, a gutted and debt laden former middle class, and thousands of empty stores in future decaying ghost malls haunting the highways and byways of suburbia.

The implications of this long and winding road to ruin are far reaching. Store closings so far have only been a ripple compared to the tsunami coming to right size the industry for a future of declining spending. Over the next five to ten years, tens of thousands of stores will be shuttered. Companies like JC Penney, Sears and Radio Shack will go bankrupt and become historical footnotes. Considering retail employment is lower today than it was in 2002 before the massive retail expansion, the future will see in excess of 1 million retail workers lose their jobs. Bernanke and the Feds have allowed real estate mall owners to roll over non-performing loans and pretend they are generating enough rental income to cover their loan obligations. As more stores go dark, this little game of extend and pretend will come to an end. Real estate developers will be going belly-up and the banking sector will be taking huge losses again. I’m sure the remaining taxpayers will gladly bailout Wall Street again. The facts are not debatable. They can be ignored by the politicians, Ivy League economists, media talking heads, and the willfully ignorant masses, but they do not cease to exist.

“Facts do not cease to exist because they are ignored.”Aldous Huxley

SPIN BABY SPIN

The consumer is back baby. The MSM is gaga over the “surge” in August spending, driven by subprime 7 year 0% auto loans to pimps and hos in West Philly. Maybe the University of Phoenix dropouts are using their student loans to buy iGadgets and bling. Here is a link to the “fantastic” data:

http://www.bea.gov/newsreleases/national/pi/pinewsrelease.htm

I just can’t help myself. Let me take a look at the data and give you a few FACTS you may not see in the MSM spinfest:

  • Real disposable personal income, using the fake BLS inflation numbers, is up a HUGE 1.6% in the last year. In reality, using inflation numbers from the real world, real disposable income has declined. This is consistent with the FACT that retailers are reporting negative or flat comp store sales.
  • Real disposable income per capita was up an even more pathetic 1% in the last year, as the country’s population grew by 2.2 million people.
  • To give you some perspective on how the average person (not a Wall Street asshole) has progressed in the last five years, the real disposable personal income per person in May of 2008 was $37,584. Today it is $36,357. The average American, after the four year Obama recovery, has 3.3% LESS disposable income.
  • Americans have been forced to REDUCE their savings by $22 billion in the last year to just make ends meet in this fantastic economy. Three cheers for a near record low savings rate.
  • Personal income is up $500 billion in the last year, but in this warped Orwellian world we live in, only 50% of this is generated by wages paid by businesses to workers. The $2.4 trillion per year taken out of your pocket or borrowed from future generations and handed out to the non-producers in this country is hysterically counted as personal income.
  • You’ll be thrilled to know that dividend income paid to the .1% is up by $71 billion in the last year, while interest income paid to senior citizens and savers is virtually flat and down $150 billion since August 2008. Over this time, Bernanke has stolen over $400 billion from savers and handed over to his puppet masters on Wall Street.
  • Great news for Obama and the government drones in DC. They have sucked $172 billion more in taxes from you compared to last year. Bye Bye payroll tax cut. I’m sure they’ll put the money to good use funding more IRS agents to enforce Obamacare.
  • The American consumer is back. Their disposable personal income was up $336 billion in the last year and they spent $359 billion of that. Oops!!! How long can you continue to spend more than you have? I guess we’ll find out.

Good bye from the NO SPIN zone. I hope you liked my daily dose of reality.


Consumer spending bounces back in August

Faster pace of outlays suggests economy hasn’t slowed all that much

By Jeffry Bartash, MarketWatch

WASHINGTON (MarketWatch) — Consumers opened up their wallets in August and spent more in July than previously reported, suggesting that U.S. growth might not soften quite as much in the third quarter as economists had forecast.

Consumer spending rose a seasonally adjusted 0.3% last month, marking the third-fastest increase of the year, the Commerce Department said Friday. And spending in July rose twice as fast as initially estimated –— 0.2% instead of 0.1%.

The rise in spending was aided by the biggest increase in worker earnings in six months. Personal income jumped 0.4% in August.

Economists surveyed by MarketWatch had forecast a 0.3% increase in consumer spending and a 0.4% rise in personal income.

The larger increase in incomes allowed Americans to salt away a bit more cash. The savings rate of Americans rose to 4.6% from 4.5%. The savings rate, however, hasn’t topped 5% since late last year.

Consumer spending represents as much as 70% of the U.S. economy and is the biggest influence on growth. The bounce-back in spending could generate faster growth in the third quarter than economists had been expecting. Gross domestic product is forecast to rise 1.9%, down from 2.5% in the second quarter, according to the latest estimates.

Consumers boosted purchases of autos in August to the highest rate in more than six years, and the month is always big for back-to-school purchases. Americans spent more on durable goods and services, but purchases of everyday items was basically unchanged.

Inflation, meanwhile, edged up 0.1% in August based on the latest reading from the personal consumption expenditure price index. The core rate, which omits food and energy, rose a slightly faster 0.2%.

Both PCE indexes have risen a scant 1.2% over the past 12 months, indicating that inflation remains contained. That gives the Federal Reserve the room to continue its a massive bond-buying program meant to stimulate the U.S. economy.

The Fed surprised Wall Street earlier this month by maintaining its current rate of purchases. A big reason was the apparent slowdown in economic growth and hiring toward the end of the summer.

Yet a slew of recent indicators, including the consumer spending report, suggest the economy has not slowed all that much from the spring. The U.S. grew at a 2.5% rate in the April-to-June period

ILLUSION OF RECOVERY – FEELINGS VERSUS FACTS

“There is no means of avoiding a final collapse of a boom brought about by credit expansion. The alternative is only whether the crisis should come sooner as the result of voluntary abandonment of further credit expansion, or later as the final and total catastrophe of the currency involved.” – Ludwig von Mises


The last week has offered an amusing display of the difference between the cheerleading corporate mainstream media, lying Wall Street shills and the critical thinking analysts like Zero Hedge, Mike Shedlock, Jesse, and John Hussman. What passes for journalism at CNBC and the rest of the mainstream print and TV media is beyond laughable. Their America is all about feelings. Are we confident? Are we bullish? Are we optimistic about the future? America has turned into a giant confidence game. The governing elite spend their time spinning stories about recovery and manipulating public opinion so people will feel good and spend money. Facts are inconvenient to their storyline. The truth is for suckers. They know what is best for us and will tell us what to do and when to do it.

The false storyline last week was the dramatic surge in new jobs. This fantastic news was utilized by the six banks that account for 80% of the stock market trading to propel the NASDAQ to an eleven year high and the Dow Jones to a four year high. The compliant corporate press did their part with blaring headlines of good cheer. The entire sham was designed to make Joe the Plumber pull out one of his 15 credit cards and buy a new 72 inch 3D HDTV for this weekend’s Super Bowl. When you watch a CNBC talking head interviewing a Wall Street shyster realize you have the 1% interviewing the .01% about how great things are.

What you most certainly did not hear from the MSM is that the NASDAQ is still down 42% from its 2000 high of 5,048. None of the brain dead twits on CNBC pointed out the S&P 500 is trading at the exact same level it reached on April 8, 1999. Twelve or thirteen years of zero or negative returns are meaningless when a story needs to be sold. On Friday the hyperbole utilized by the media mouthpieces was off the charts, leading to an all-out brawl between the critical thinking blogosphere and the non-thinking “professionals” spouting the government sanctioned propaganda. Accusations flew back and forth about who was misinterpreting the data. I found it hysterical that anyone would debate the accuracy of BLS (Bureau of Lies & Swindles) data.

The drones at this government propaganda agency relentlessly massage the data until they achieve a happy ending. They use a birth/death model to create jobs out of thin air, later adjusting those phantom jobs away in a press release on a Friday night. They create new categories of Americans to pretend they aren’t really unemployed. They use more models to make adjustments for seasonality. Then they make massive one-time adjustments for the Census. Essentially, you can conclude that anything the BLS reports on a monthly basis is a wild ass guess, massaged to present the most optimistic view of the world. The government preferred unemployment rate of 8.3% is a terrible joke and the MSM dutifully spouts this drivel to a zombie-like public. If the governing elite were to report the truth, the public would realize we are in the midst of a 2nd Great Depression.


The unemployment rate during the Great Depression reached 25%. Without the BLS “adjustments” the real unemployment rate in this country is 23%. Cheerleading and packaging the data in a way to mislead the public does not change the facts:

  • There are 242 million working age Americans. Only 142 million Americans are working. For the math challenged, such as CNBC analysts, that means 100 million working age Americans (41.5%) are not working. But don’t worry, the BLS says the unemployment rate is only 8.3%. Things are going so swimmingly well in this country the other 33.2% are kicking back enjoying the good life.
  • The labor force participation rate and employment to population ratio are at 30 year lows. The number of Americans supposedly not in the labor force is at an all-time record of 87.9 million. A corporate MSM pundit like Steve Liesman would explain this away as the Baby Boomers beginning to retire. Great storyline, but the facts prove that old timers are so desperate for cash they have dramatically increased their participation in the labor market.


  • The data being dished out by the government on a daily basis does not pass the smell test. The working age population since 2000 has grown by 30 million people. The number of people working has grown by only 4.7 million. A critical thinker would conclude the unemployment rate should be dramatically higher than the reported 8.3%. But the government falsely reports the labor force has only increased by 11.8 million in the last eleven years. They have the gall to report that 17.9 million Americans just decided to leave the workforce. The economy was booming in 2000. It sucks today. Don’t more people need jobs when times are tougher? The Boomers retiring storyline has already proven to be false. The fact that 46 million (15% of total population) people are on food stamps is a testament to the BLS lie. A look at history proves how badly the current figures reek to high heaven:
    • 2000 to 2011 – Not in Labor Force increased by 17.9 million.
    • 1990’s – Not in Labor Force increased by 5 million.
    • 1980’s – Not in Labor Force increased by 1.7 million.
  • The Not in the Labor Force category is utilized to hide how bad the employment situation in this country really is. They conclude that 17 million out of 38 million Americans between the ages of 16 and 24 are not in the labor force. That is complete bullshit. From the time I turned 16, I worked. Everyone I knew worked. I worked through high school and college. It is a lie that 45% of these people don’t want a job. If you dig into their data, you realize the horrific state of employment in this country:
    • 74% of 16 to 19 year olds are not employed
    • 85% of black 16 to 19 year olds are not employed
    • 31% of black 25 to 54 year old men are not employed
    • 40% of 20 to 24 year olds are not employed
    • 22% of 25 to 29 year old males are not employed
    • 22% of 50 to 54 year old males are not employed
    • According to the BLS, 11% of men between 25 and 54 are not in the labor force

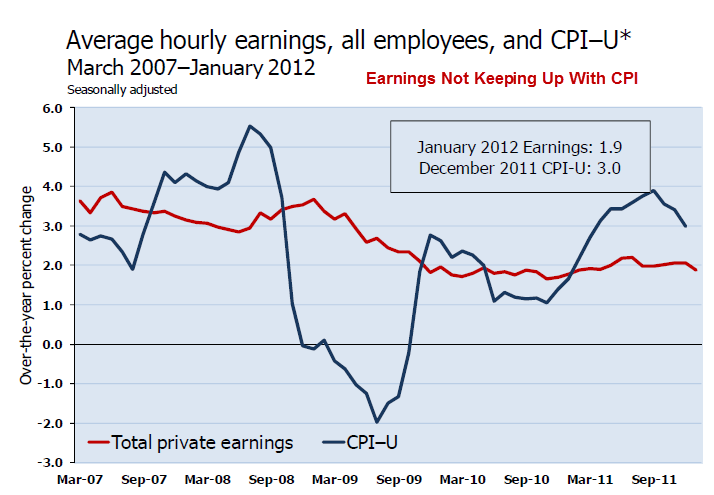
Not only is real unemployment at Depressionary levels, but those that do have jobs are falling further and further behind. Wages have gone up less than 2% in the last year and have been rising at an annual rate below 3% for the last four years. According to our friends at the BLS, inflation has risen 3% in the last year. This is almost as ludicrous as their unemployment rate. Anyone living in the real world, as opposed to the BLS model world, knows that inflation on the things we need to live has been rising in excess of 10%. It is a fact that if you measure CPI exactly as it was measured in 1980, at the outset of our great debt inflation, it exceeds 10% versus the fake 3% reported without question by the MSM to a non-thinking public. A poor schmuck making the median salary of $25,000 who gets a 2% raise thinks he has $500 more to spend when in reality he has lost $2,000 of purchasing power. Federal Reserve created inflation is an insidious hidden tax that destroys the 99%, while enriching the 1%.

Until Debt Do Us Part

“Insanity is doing the same thing, over and over again, but expecting different results.”Albert Einstein

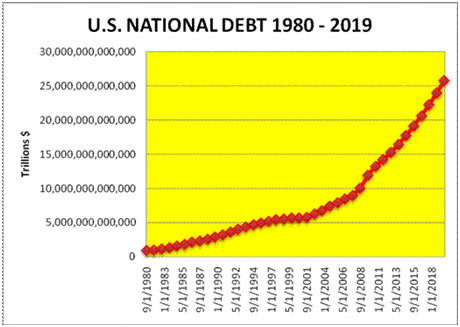
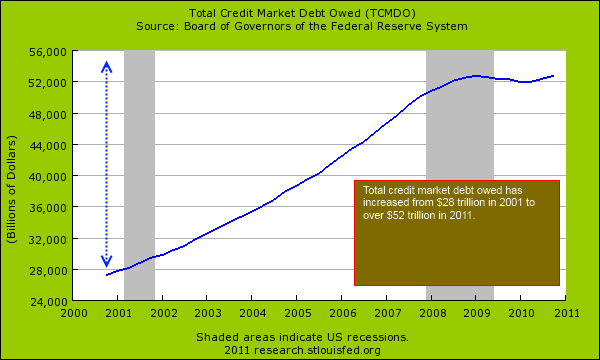
The recovery storyline being touted by the oligarchy of politicians, bankers and media is designed to make consumers feel better. This is a key part of their master plan. Any honest assessment of the financial disaster that struck in 2008 would conclude it was caused by too much debt peddled to too many people incapable of paying it back, too few banks having too much power, the Federal Reserve keeping interest rates too low for too long, and that same Federal Reserve doing too little regulating of the Too Big To Fail Wall Street mega-banks. I wonder what Albert Einstein would think about the “solutions” rolled out to fix our debt problem. Would he find it insane that total credit market debt has actually risen to an all-time high of $53.8 trillion, up $533 billion from the previous 2008 peak? Our leaders have added $6.1 trillion to our National Debt in the last four years, a mere 66% increase. This unprecedented level of borrowing certainly did not benefit the American people, as real GDP has risen by $96 billion, or 0.7%, over the last four years.

Would Einstein find it insane that the governing elite would encourage the 4 biggest banks, that were the main culprits in creating a worldwide financial collapse, to actually get bigger? The largest banks in the U.S. now control 72% of all the deposits in the country versus 68.5% in 2008. The Too Big To Fail are now Too Bigger To Fail. Rather than liquidating the bad debts, breaking up the insolvent banks, selling off the good assets to well run banks, firing the executives, and wiping out the shareholders & bondholders foolish enough to invest in these badly run casinos, the powers that be chose to protect their fellow .01% brethren and throw the 99% under the bus.

Ben Bernanke, in conjunction with Tim Geithner and his masters on Wall Street, implemented a zero interest rate policy designed to enrich the Wall Street banks, force investors into the stock market, and encourage Americans to borrow and spend like it was 2005 again. Rather than accepting that our economy has been warped for decades, with over-consumption utilizing debt as the driving force, and allowing a reset, the Federal Reserve insanely encouraging banks and consumers to do the same thing again. We do know Bernanke has stolen $450 billion of interest income going to savers and senior citizens and handed it to Jamie Dimon, Vikrim Pandit, Lloyd Blankfein and the rest of the Wall Street cabal. The “austerity is bad” storyline is pounded home on a daily basis by the politicians, corporate chieftains, Wall Street billionaires, and MSM pundits. The definition of austere is “practicing great self-denial”. Did you see the mob scenes on Black Friday? Americans are incapable of any self-denial, let alone great self-denial, and the masters of our country will not allow it to happen. One look at our GDP figures confirms the non-austerity occurring in this country. In 2007, prior to the collapse, consumer spending accounted for 69.7% of GDP. Today, consumer spending accounts for 71% of GDP, with investment accounting for 12.7% of GDP. In the good old days of 1979 prior to the epic debt bubble, when the financial industry do not run this country, consumer spending accounted for 62% of GDP and investment accounted for 19% of GDP. What an insane concept. You spend less than you make and save the difference. You then invest that money where you can get a reasonable return (.15% in a money market account is not exactly reasonable).

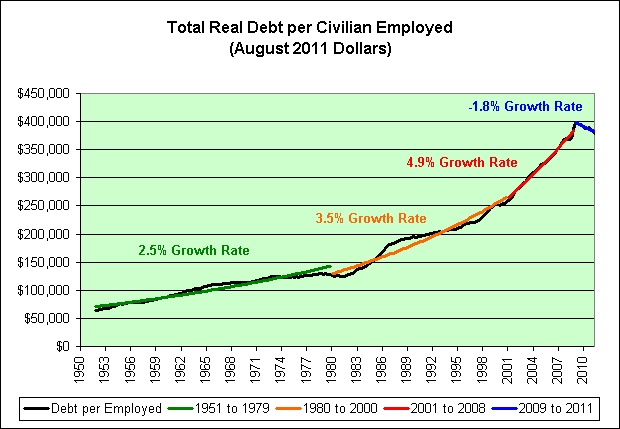
As Ludwig von Mises pointed out, a false boom created by credit expansion will ultimately collapse. We had the chance in 2008 – 2009 to voluntarily abandon the Wall Street induced credit expansion and allow our country to reset. The pain and misery would have been great, especially for the 1% who own most of the stocks, bonds and peddle the debt to the ignorant masses. As you can see in the chart below, the powers that be need debt per employed American to grow at an ever increasing rate to maintain their power and wealth. The miniscule reduction in debt from 2009 to 2011 was unacceptable. The governing powers will not be satisfied until von Mises’ final currency catastrophe is achieved.

Bernanke and his Wall Street puppet masters’ plan is actually quite simple. It’s essentially a confidence game. A confidence game (also known as a con, flim flam, gaffle, grift, hustle, scam, scheme, or swindle) is an attempt to defraud a group by gaining their confidence. The people who commit such tricks are often known as con men, con artists, or grifters. The con man often works with one or more accomplices called shills, who help manipulate the mark into accepting the con man’s plan. In a traditional confidence game, the mark is led to believe that he will be able to win money or some other prize by doing some task. The accomplices may pretend to be random strangers who have benefited from successfully performing the task. Bernanke and the 1% are the con men. They are attempting to defraud the 99% by convincing them their “solutions” will benefit them. The shills acting as accomplices are Wall Street bankers, bought off economists, politicians, journalists, and mainstream media pundits. You are the mark. The game has multiple facets but is based on more freely flowing low interest easy debt. The con man has reduced interest rates to zero at the behest of his puppet masters. The Wall Street accomplices offer enticing financing to the marks for big ticket items like automobiles, furniture and electronics. As the marks go further into debt, the Wall Street shills report record earnings ($26 billion from loan loss reserve accounting entries), consumer spending rises and GDP goes higher. The mainstream media accomplices dutifully report an improving economy. The government accomplices massage the employment and inflation data and declare a jobs recovery with no inflation. The marks are supposed to feel better about the future and spend even more borrowed money. This is what is considered a self-sustaining recovery by the psychopaths running this country.

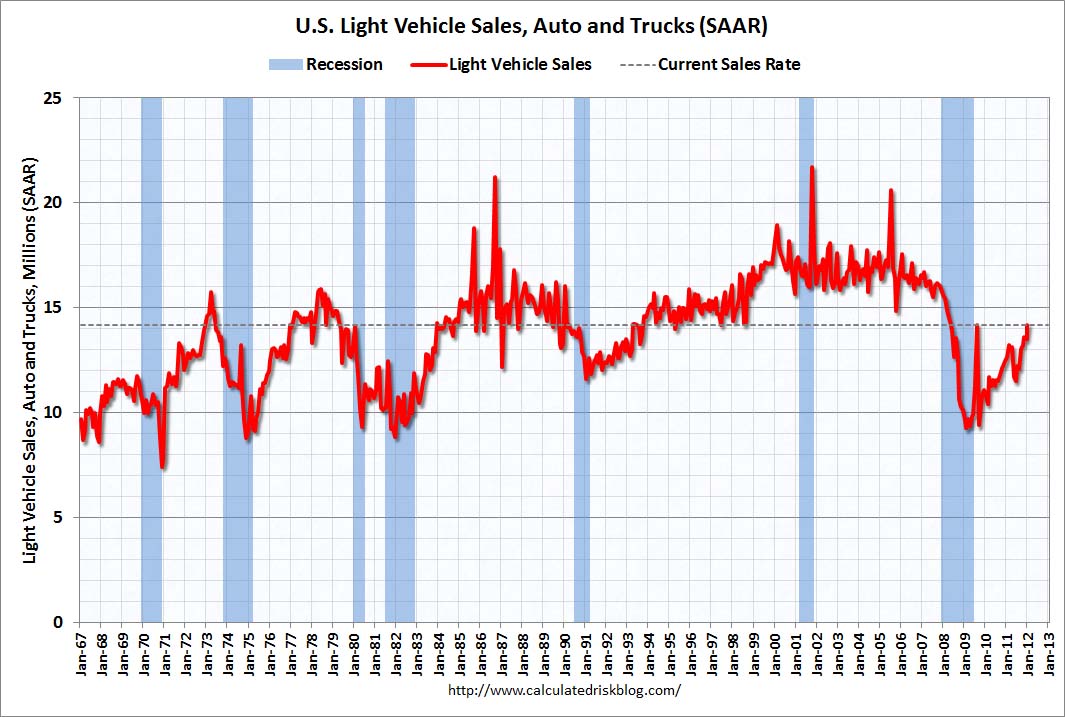
All you have to do is open your daily paper to see the confidence game in full display. Last week the MSM reported another surge in automobile sales. Our beloved American automobile manufacturers are back baby!!! Automobile sales are now pacing above 14 million on an annual basis. This is up from the depths of the recession in 2009 when the annual rate was below 10 million. We’ve breached the Cash For Clunkers level and there is nowhere to go but up. The storyline is that Obama was right to save GM and Chrysler with your tax dollars. They are now making splendid vehicles (except for the exploding Chevy Volts) and employing millions of Americans. This is a true American comeback success story. Clint Eastwood should do a commercial about it.

There is one little problem with this storyline. It’s bullshit. Remember GMAC? You bailed them out when all their subprime auto and mortgage loans went bad in 2009. They have a brand new business plan. Change your name to Ally Bank and start making as many subprime auto loans as possible. You will be happy to know that according to Experian, 45% of all auto loans being made today are to subprime borrowers. What could possibly go wrong? In addition, the average loan term has grown to almost 6 years. Executives at Ally Financial said that subprime car lending had become “very attractive” because profit margins on the loans more than cover the cost of expected losses from borrowers who fail to repay what they owe. I’m sure they have everything completely under control. Gina Proia, a company spokeswoman, said the company places “greater emphasis on the higher end of the nonprime spectrum” and only lends to people who show they can pay. I can’t believe they are restricting their loans to only people who they think can pay. I’m surprised Obama isn’t condemning them for such restrictive loan terms. If you open your paper to the auto section you will see financing offers of $0 down-payment, and 0% interest for 7 years across the board on most models. But why buy, when you can lease a luxury automobile for $300 per month? It is simply amazing how many vehicles you can “sell” when “credit challenged” Americans can rent them for seven years. I wonder if this explains why I see dozens of $40,000 luxury autos parked in front of $25,000 dilapidated hovels during my daily commute through West Philadelphia. It also seems the Big Three are “selling” a few extra vehicles to their dealers in January as pointed out by Zero Hedge. No need to let a few facts get in the way of a feel good story.

  • Ford month-end inventory 86-day supply at end of Jan. (492k vehicles) vs 60-day supply (466k) as of Dec. 31
  • Chrysler had 83-day supply (349k units) end of Jan. vs 64-day (326k units) as of Dec. 31
  • GM month-end inventory 89-day supply (619k units) vs 67-day supply (583k) Dec. 31

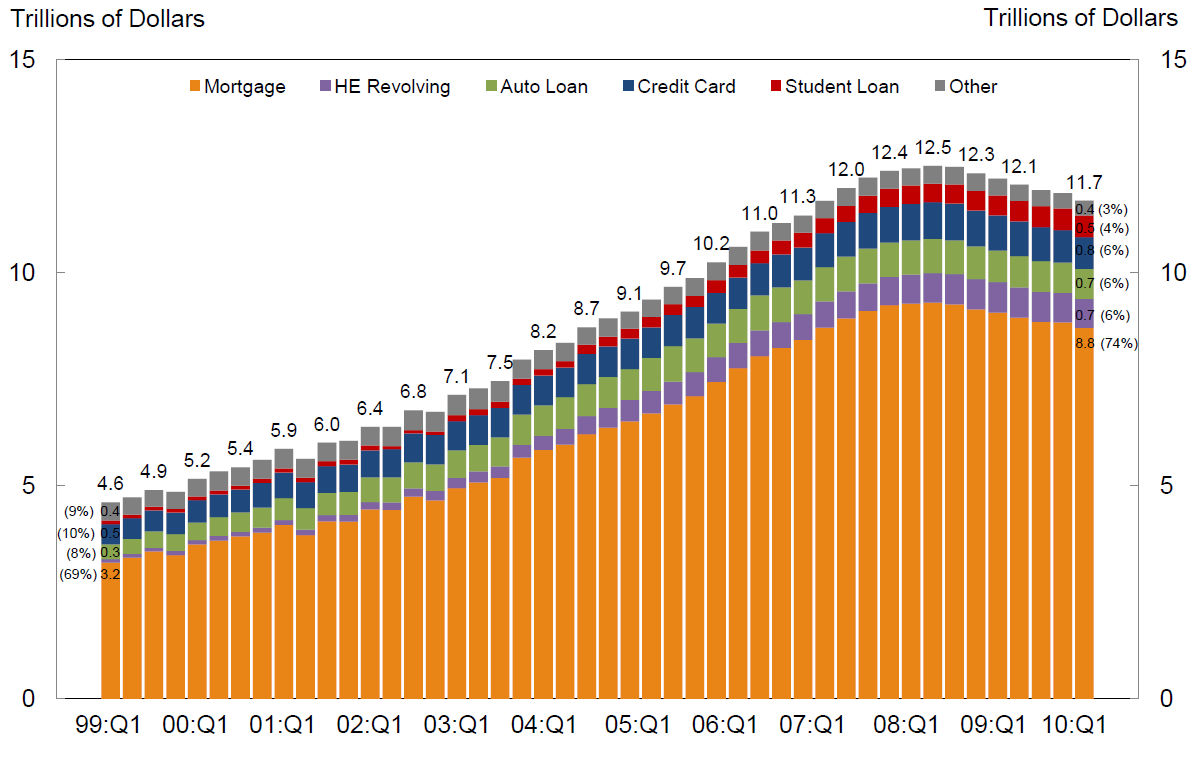
The facts prove the issuance of billions in easy credit is creating the illusion of recovery. Non- revolving (auto & student loans) consumer credit outstanding is now at an all-time high of $1.7 trillion. Even with billions in bad debt write-offs since 2009 the amount outstanding has risen by $100 billion. Does this sound like austerity is gripping the nation? The Federal government is dishing out student loans like candy, as hundreds of thousands of students get worthless degrees from for-profit diploma mills like the University of Phoenix and its ilk. By keeping them occupied in school, the government is able to keep them in the Not in the Labor Force category. Not to be outdone, our friends at GE Capital, Wells Fargo and the other too big to fail entities have been doing their part on the revolving credit side of the scam. I’ve recently been seeing an ad by the largest U.S. furniture retailer, Ashley Furniture, offering 0% interest with no payments for 7 years. I don’t know about you, but my kids destroy a couch in less than 7 years. Wells Fargo Credit doesn’t seem too worried. A critical thinker might ask, how can Wells Fargo possibly make money offering these terms? But there is the rub. Ben Bernanke is loaning Wells Fargo money at 0% so they can perpetuate the confidence game. These insane bankers truly believe they can kick start this moribund debt saturated economy by issuing billions more in debt to people incapable of repaying them. Einstein would be amused.

The McKinsey Group put out a report a couple weeks ago analyzing the amount of American household debt and optimistically concluding that it could be back on a sustainable path by 2013. Mike Shedlock pointed out that sustainable is in the eye of the beholder. It seems the bright fellows at McKinsey haven’t grasped the concept of regression to the mean. First of all their analysis is flawed because real disposable personal income is actually declining and Ben Bernanke’s master scam is working and Americans are now adding to their household debt. The little blue line has turned upwards since they gathered their data. Secondly, as Mish so accurately points out, the sustainable level of household debt is really at the levels prior to the debt bubble that began in the early 1980s. That is a debt level of approximately 70% of disposable personal income, as opposed to the current level of 110%.

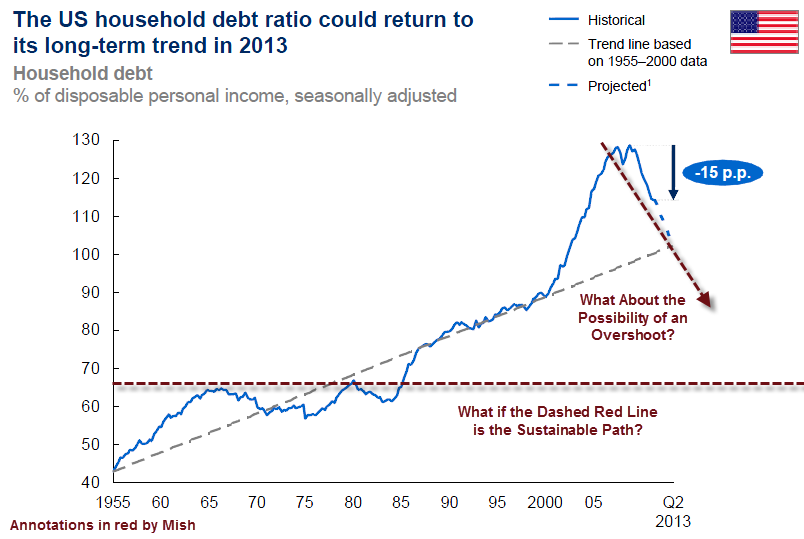
The implications of household debt levels regressing to their long-term mean would be catastrophic to the 1%. Their kingdom of debt would come crashing down. Their power and wealth would be swept away. This is why it is so vital for them to create the illusion of recovery. Their confidence game is built upon an ever increasing flow of credit expansion. It will not work. There is no avoiding the final collapse of a boom created solely by credit expansion. Those in power will never voluntarily relinquish their grand game of pillaging the wealth of the nation, so economic collapse will be the ultimate result. They will continue to use propaganda, printing presses, and half-truths to further their agenda. But those who examine the facts will come to a logical conclusion that we are being sold a great lie.

“Half the truth is often a great lie.” – Benjamin Franklin


THE GREAT DELEVERAGING LIE

You can’t open a newspaper or watch a business news network without seeing or hearing that consumers and businesses have been de-leveraging. The storyline as portrayed by the mainstream media is that consumers and corporations have seen the light and are paying off debts and living within their means. Austerity has broken out across the land. Bloomberg peddled this line of bull last week:

US Household Debt Shrank 1.5% in the Second Quarter

American households pared their debts last quarter, closing credit card accounts and taking out fewer mortgages as unemployment persisted near a 26-year high, a survey by the Federal Reserve Bank of New York showed.Consumer indebtedness totaled $11.7 trillion at the end of June, a decline of 1.5 percent from the previous three months and down 6.5 percent from its peak in the third quarter of 2008, according to the New York Fed’s first quarterly report on household debt and credit.The report reinforces forecasts for a slowing economy in the second half of 2010 as consumers hold back on spending and rebuild savings.

One has to wonder whether the mainstream media and the clueless pundits on CNBC actually believe the crap they are peddling or whether this is a concerted effort to convince the masses that they have done enough and should start spending. Consumer spending as a percentage of GDP is still above 70%. This is well above the 64% level that was consistent between 1950 and 1980. Consumer spending was entirely propped up by an ever increasing level of debt. The American economy will never recover until consumer spending drops back to the 64% range that indicates a balanced economic system. For the mathematically challenged on CNBC and in the White House, this means that consumers need to reduce their spending by an additional $850 billion PER YEAR. Great news for the 1.5 million retailers in America.

Below is a chart that shows total credit market debt as a % of GDP. This chart captures all of the debt in the United States carried by households, corporations, and the government. The data can be found here:

http://www.federalreserve.gov/releases/z1/current/accessible/l1.htm

Total credit market debt peaked at $52.9 trillion in the 1st quarter of 2009. It is currently at $52.1 trillion. The GREAT DE-LEVERAGING of the United States has chopped our total debt by 1.5%. Move along. No more to see here. Time to go to the mall. Can anyone in their right mind look at this chart and think this financial crisis is over?

During the Great Depression of the 1930’s Total Credit Market Debt as a % of GDP peaked at 260% of GDP. As of today, it stands at 360% of GDP. The Federal Government is adding $4 billion per day to the National Debt. GDP is stagnant and will likely not grow for the next year. The storyline about corporate America being flush with cash is another lie. Corporations have ADDED $482 billion of debt since 2007. Corporate America has the largest amount of debt on their books in history at $7.2 trillion.

Now we get to the Big Lie about frugal consumers paying off debts, cutting up those credit cards, and eating Raman noodles 5 nights per week. Household and non-profit debt, which includes mortgages, credit card debt, auto loans, home equity loans, and student loans peaked at $13.8 trillion in 2008. After two years of supposed deleveraging, frugality and mass austerity, the balance is $13.5 trillion. Consumers have buckled down and have paid off 2.2% of their debts, it seems. Not exactly going cold turkey, but it is a start.

But wait. Consumer debt outstanding is $300 billion lower. If you hadn’t noticed, the banks in the United States have been taking a few losses on their loans over the last couple years. A simple search of the Federal Reserve website reveals that banks have charged off 5.66% of all their loans in the last two years. The charge off rate in the 2nd quarter of 2010 was 6.66%. To verify for yourself go to the Federal Reserve website:

http://www.federalreserve.gov/releases/chargeoff/chgallsa.htm

So, let’s get down to the nitty gritty. If consumer debt was $13.8 trillion at the end of 2008 and the banks have since written off 5.66% of that debt, total write-offs were $800 billion. If total consumer debt now sits at $13.5 trillion, then consumers have actually taken on $500 billion of additional debt since the end of 2008. The consumer hasn’t cut back at all. They are still spending and borrowing. It is beyond my comprehension that no one on CNBC or in the other mainstream media can do simple math to figure out that the deleveraging story is just a Big Lie.

The truth is that the debt has simply been shifted from criminal Wall Street Banks to the American taxpayer. These consumer debts were created in a private transaction between individuals and these banks. When the loans went bad, the consumer should have lost their home, car, etc., and their credit rating should have been ruined, keeping them out of the credit market for a number of years. If the banks that made these bad loans made too many, they should have failed and had their assets liquidated in bankruptcy. Instead, the Federal Government has inserted the American taxpayer into the equation by using our tax dollars to prop up insolvent Wall Street banks and allowing screw-ups who took on too much debt to live in houses for over two years without making a mortgage payment.

The Big Lie will eventually lose out to the grim truth. America’s economy is built on a debt based foundation of sand and the tide of reality is relentlessly eating away at that foundation of debt. Collapse is just a matter of time. The charts below from the Federal Reserve paint a grim picture of reality.

Total Debt Balance and its Composition

Total Balance by Delinquency Status

New Seriously Delinquent Balances by Loan Type