REMEMBER WHEN OBAMA TAUGHT PUTIN A LESSON BY RELEASING OIL FROM THE STRATEGIC PETROLEUM RESERVE?

On March 12 our far thinking brilliant droner in chief  announced to the world that he was releasing 5 million barrels of oil from SPR in an attempt to drive the price of oil down and hurt the Russians, the 2nd largest oil exporter in the world. Considering that is one and a half hours of worldwide usage didn’t really matter to our PR president. The American sheeple needed to know the savior was taking action.

Since the MSM will never go back and assess the success of Oblama’s calculated master plan, I will. The price of oil was $99 the day before his surprise announcement. It dropped to $98 for one day and it has been on an upward path ever since. It hit $103 today. That is a 5% increase in less than a month. Meanwhile, gasoline prices have risen from $3.48 per gallon to $3.58 per gallon in one month.

I sure hope our community organizing teleprompter reader in chief doesn’t try to teach Putin any more lessons. We can’t afford it.

THE RETAIL DEATH RATTLE

“I was part of that strange race of people aptly described as spending their lives doing things they detest, to make money they don’t want, to buy things they don’t need, to impress people they don’t like.”Emile Gauvreau

If ever a chart provided unequivocal proof the economic recovery storyline is a fraud, the one below is the smoking gun. November and December retail sales account for 20% to 40% of annual retail sales for most retailers. The number of visits to retail stores has plummeted by 50% since 2010. Please note this was during a supposed economic recovery. Also note consumer spending accounts for 70% of GDP. Also note credit card debt outstanding is 7% lower than its level in 2010 and 16% below its peak in 2008. Retailers like J.C. Penney, Best Buy, Sears, Radio Shack and Barnes & Noble continue to report appalling sales and profit results, along with listings of store closings. Even the heavyweights like Wal-Mart and Target continue to report negative comp store sales. How can the government and mainstream media be reporting an economic recovery when the industry that accounts for 70% of GDP is in free fall? The answer is that 99% of America has not had an economic recovery. Only Bernanke’s 1% owner class have benefited from his QE/ZIRP induced stock market levitation.

Source: WSJ

The entire economic recovery storyline is a sham built upon easy money funneled by the Fed to the Too Big To Trust Wall Street banks so they can use their HFT supercomputers to drive the stock market higher, buy up the millions of homes they foreclosed upon to artificially drive up home prices, and generate profits through rigging commodity, currency, and bond markets, while reducing loan loss reserves because they are free to value their toxic assets at anything they please – compliments of the spineless nerds at the FASB. GDP has been artificially propped up by the Federal government through the magic of EBT cards, SSDI for the depressed and downtrodden, never ending extensions of unemployment benefits, billions in student loans to University of Phoenix prodigies, and subprime auto loans to deadbeats from the Government Motors financing arm – Ally Financial (85% owned by you the taxpayer). The country is being kept afloat on an ocean of debt and delusional belief in the power of central bankers to steer this ship through a sea of icebergs just below the surface.

The absolute collapse in retail visitor counts is the warning siren that this country is about to collide with the reality Americans have run out of time, money, jobs, and illusions. The most amazingly delusional aspect to the chart above is retailers continued to add 44 million square feet in 2013 to the almost 15 billion existing square feet of retail space in the U.S. That is approximately 47 square feet of retail space for every person in America. Retail CEOs are not the brightest bulbs in the sale bin, as exhibited by the CEO of Target and his gross malfeasance in protecting his customers’ personal financial information. Of course, the 44 million square feet added in 2013 is down 85% from the annual increases from 2000 through 2008. The exponential growth model, built upon a never ending flow of consumer credit and an endless supply of cheap fuel, has reached its limit of growth. The titans of Wall Street and their puppets in Washington D.C. have wrung every drop of faux wealth from the dying middle class. There are nothing left but withering carcasses and bleached bones.

The impact of this retail death spiral will be vast and far reaching. A few factoids will help you understand the coming calamity:

  • There are approximately 109,500 shopping centers in the United States ranging in size from the small convenience centers to the large super-regional malls.
  • There are in excess of 1 million retail establishments in the United States occupying 15 billion square feet of space and generating over $4.4 trillion of annual sales. This includes 8,700 department stores, 160,000 clothing & accessory stores, and 8,600 game stores.
  • U.S. shopping-center retail sales total more than $2.26 trillion, accounting for over half of all retail sales.
  • The U.S. shopping-center industry directly employed over 12 million people in 2010 and indirectly generated another 5.6 million jobs in support industries. Collectively, the industry accounted for 12.7% of total U.S. employment.
  • Total retail employment in 2012 totaled 14.9 million, lower than the 15.1 million employed in 2002.
  • For every 100 individuals directly employed at a U.S. regional shopping center, an additional 20 to 30 jobs are supported in the community due to multiplier effects.

The collapse in foot traffic to the 109,500 shopping centers that crisscross our suburban sprawl paradise of plenty is irreversible. No amount of marketing propaganda, 50% off sales, or hot new iGadgets is going to spur a dramatic turnaround. Quarter after quarter there will be more announcements of store closings. Macys just announced the closing of 5 stores and firing of 2,500 retail workers. JC Penney just announced the closing of 33 stores and firing of 2,000 retail workers. Announcements are imminent from Sears, Radio Shack and a slew of other retailers who are beginning to see the writing on the wall. The vacancy rate will be rising in strip malls, power malls and regional malls, with the largest growing sector being ghost malls. Before long it will appear that SPACE AVAILABLE is the fastest growing retailer in America.

The reason this death spiral cannot be reversed is simply a matter of arithmetic and demographics. While arrogant hubristic retail CEOs of public big box mega-retailers added 2.7 billion retail square feet to our already over saturated market, real median household income flat lined. The advancement in retail spending was attributable solely to the $1.1 trillion increase (68%) in consumer debt and the trillion dollars of home equity extracted from castles in the sky, that later crashed down to earth. Once the Wall Street created fraud collapsed and the waves of delusion subsided, retailers have been revealed to be swimming naked. Their relentless expansion, based on exponential growth, cannibalized itself, new store construction ground to a halt, sales and profits have declined, and the inevitable closing of thousands of stores has begun. With real median household income 8% lower than it was in 2008, the collapse in retail traffic is a rational reaction by the impoverished 99%. Americans are using their credit cards to pay their real estate taxes, income taxes, and monthly utilities, since their income is lower, and their living expenses rise relentlessly, thanks to Bernanke and his Fed created inflation.

The media mouthpieces for the establishment gloss over the fact average gasoline prices in 2013 were the second highest in history. The highest average price was in 2012 and the 3rd highest average price was in 2011. These prices are 150% higher than prices in the early 2000’s. This might not matter to the likes of Jamie Dimon and Jon Corzine, but for a middle class family with two parents working and making 7.5% less than they made in 2000, it has a dramatic impact on discretionary income. The fact oil prices have risen from $25 per barrel in 2003 to $100 per barrel today has not only impacted gas prices, but utility costs, food costs, and the price of any product that needs to be transported to your local Wally World. The outrageous rise in tuition prices has been aided and abetted by the Federal government and their doling out of loans so diploma mills like the University of Phoenix can bilk clueless dupes into thinking they are on their way to an exciting new career, while leaving them jobless in their parents’ basement with a loan payment for life.


The laughable jobs recovery touted by Obama, his sycophantic minions, paid off economist shills, and the discredited corporate legacy media can be viewed appropriately in the following two charts, that reveal the false storyline being peddled to the techno-narcissistic iGadget distracted masses. There are 247 million working age Americans between the ages of 18 and 64. Only 145 million of these people are employed. Of these employed, 19 million are working part-time and 9 million are self- employed. Another 20 million are employed by the government, producing nothing and being sustained by the few remaining producers with their tax dollars. The labor participation rate is the lowest it has been since women entered the workforce in large numbers during the 1980’s. We are back to levels seen during the booming Carter years. Those peddling the drivel about retiring Baby Boomers causing the decline in the labor participation rate are either math challenged or willfully ignorant because they are being paid to be so. Once you turn 65 you are no longer counted in the work force. The percentage of those over 55 in the workforce has risen dramatically to an all-time high, as the Me Generation never saved for retirement or saw their retirement savings obliterated in the Wall Street created 2008 financial implosion.

To understand the absolute idiocy of retail CEOs across the land one must parse the employment data back to 2000. In the year 2000 the working age population of the U.S. was 213 million and 136.9 million of them were working, a record level of 64.4% of the population. There were 70 million working age Americans not in the labor force. Fourteen years later the number of working age Americans is 247 million and only 144.6 million are working. The working age population has risen by 16% and the number of employed has risen by only 5.6%. That’s quite a success story. Of course, even though median household income is 7.5% lower than it was in 2000, the government expects you to believe that 22 million Americans voluntarily left the labor force because they no longer needed a job. While the number of employed grew by 5.6% over fourteen years, the number of people who left the workforce grew by 31.1%. Over this same time frame the mega-retailers that dominate the landscape added almost 3 billion square feet of selling space, a 25% increase. A critical thinking individual might wonder how this could possibly end well for the retail genius CEOs in glistening corporate office towers from coast to coast.

This entire materialistic orgy of consumerism has been sustained solely with debt peddled by the Wall Street banking syndicate. The average American consumer met their Waterloo in 2008. Bernanke’s mission was to save bankers, billionaires and politicians. It was not to save the working middle class. You’ve been sacrificed at the altar of the .1%. The 0% interest rates were for Jamie Dimon and Lloyd Blankfein. Your credit card interest rate remained between 13% and 21%. So, while you struggle to pay bills with your declining real income, the Wall Street bankers are again generating record profits and paying themselves record bonuses. Profits are so good, they can afford to pay tens of billions in fines for their criminal acts, and still be left with billions to divvy up among their non-prosecuted criminal executives.

Bernanke and his financial elite owners have been able to rig the markets to give the appearance of normalcy, but they cannot rig the demographic time bomb that will cause the death and destruction of our illusory retail paradigm. Demographics cannot be manipulated or altered by the government or mass media. The best they can do is ignore or lie about the facts. The life cycle of a human being is utterly predictable, along with their habits across time. Those under 25 years old have very little income, therefore they have very little spending. Once a job is attained and income levels rise, spending rises along with the increased income. As the person enters old age their income declines and spending on stuff declines rapidly. The media may be ignoring the fact that annual expenditures drop by 40% for those over 65 years old from the peak spending years of 45 to 54, but it doesn’t change the fact. They also cannot change the fact that 10,000 Americans will turn 65 every day for the next sixteen years. They also can’t change the fact the average Baby Boomer has less than $50,000 saved for retirement and is up to their grey eye brows in debt.

With over 15% of all 25 to 34 year olds living in their parents’ basement and those under 25 saddled with billions in student loan debt, the traditional increase in income and spending is DOA for the millennial generation. The hardest hit demographic on the job front during the 2008 through 2014 ongoing recession has been the 45 to 54 year olds in their peak earning and spending years. Combine these demographic developments and you’ve got a perfect storm for over-built retailers and their egotistical CEOs.

The media continues to peddle the storyline of on-line sales saving the ancient bricks and mortar retailers. Again, the talking head pundits are willfully ignoring basic math. On-line sales account for 6% of total retail sales. If a dying behemoth like JC Penney announces a 20% decline in same store sales and a 20% increase in on-line sales, their total change is still negative 17.6%. And they are still left with 1,100 decaying stores, 100,000 employees, lease payments, debt payments, maintenance costs, utility costs, inventory costs, and pension costs. Their future is so bright they gotta wear a toe tag.

The decades of mal-investment in retail stores was enabled by Greenspan, Bernanke, and their Federal Reserve brethren. Their easy money policies enabled Americans to live far beyond their true means through credit card debt, auto debt, mortgage debt, and home equity debt. This false illusion of wealth and foolish spending led mega-retailers to ignore facts and spread like locusts across the suburban countryside. The debt fueled orgy has run out of steam. All that is left is the largest mountain of debt in human history, a gutted and debt laden former middle class, and thousands of empty stores in future decaying ghost malls haunting the highways and byways of suburbia.

The implications of this long and winding road to ruin are far reaching. Store closings so far have only been a ripple compared to the tsunami coming to right size the industry for a future of declining spending. Over the next five to ten years, tens of thousands of stores will be shuttered. Companies like JC Penney, Sears and Radio Shack will go bankrupt and become historical footnotes. Considering retail employment is lower today than it was in 2002 before the massive retail expansion, the future will see in excess of 1 million retail workers lose their jobs. Bernanke and the Feds have allowed real estate mall owners to roll over non-performing loans and pretend they are generating enough rental income to cover their loan obligations. As more stores go dark, this little game of extend and pretend will come to an end. Real estate developers will be going belly-up and the banking sector will be taking huge losses again. I’m sure the remaining taxpayers will gladly bailout Wall Street again. The facts are not debatable. They can be ignored by the politicians, Ivy League economists, media talking heads, and the willfully ignorant masses, but they do not cease to exist.

“Facts do not cease to exist because they are ignored.”Aldous Huxley

SUSTAINABLE?

Our beloved leaders and their insistence on democratizing the world at the point of a few hundred tomahawk missiles has had predictable consequences. West Texas crude oil hit $109 a barrel today, the highest level since February 2012 when we were saber rattling over the imminent threat of Iran. Gas prices breached $3.90 per gallon then and again in September of 2012 when West Texas crude hit only $99 per barrel. The price at the station near my house has jumped by 8 cents in the last few days to $3.71 per gallon. The national price of $3.62 is headed higher. If and when the missiles start flying, the sky is the limit depending on what Syria, Russia and Iran do. There already appears to be a disconnect, as WTI has surged by 23% since April, but national gas prices are only up 4%. Some of this is due to demand destruction as the high prices and declining economy have led to a collapse in vehicle miles driven and fuel usage.


Some of the disconnect may be explained by the price of Brent crude. It is pretty much flat versus last year, while WTI has gone up 12%. The West and Midwest are most influenced by the price of WTI, while the East is impacted by Brent. The price of Brent hit $116 today, up 16% since April. That is close to the one year high reached in February, when U.S. gas prices hit their high for the year of $3.70 per gallon. Last year ended up with the highest average price for a gallon of gas in U.S. history and that was with falling prices from September through December. The average price in 2013 is only slightly lower than 2012 and we are about to experience much higher prices from September through December. Throw in a hurricane or two and we’ll really be partying. Prices in Chicago and Los Angeles are already above $3.90 per gallon.

There is nothing like high energy prices to kick the ass of this economy. We are already in recession, as the consumer is up to their eyeballs in debt and getting gouged by higher taxes, healthcare costs, tuition costs, and food costs. These soaring oil prices will make everything more expensive, as our economy is dependent upon shipping shit by truck. One of the storylines peddled by the MSM has been the fantastic auto recovery. Thank God Obama saved GM!!!

Again we have a disconnect. The number of vehicle miles driven continues to decline. Why would auto sales be soaring if people are driving less and young people can’t afford cars? The chart below makes the point. We’ve got record high energy prices and a decade long decline in miles driven, but somehow we have a booming auto industry. It couldn’t possibly be driven by cheap credit doled out to subprime auto buyers? Obama and his minions at Ally Financial, along with Bennie and his Wall Street cohorts wouldn’t be using those free Bennie bucks to create the illusion of an auto recovery? Would they?

Do you think the auto recovery is sustainable with rising interest rates, rising gas prices, falling stock prices, increasing bad debt on auto loans, and a recession? If you do, I have some prime real estate in Damascus I’d like to sell you.     

WHY ARE GAS PRICES SOARING ON EAST COAST?

The price of gas at the station near my house has gone from $3.45 to $3.64 a gallon in the last 10 days. This is a 5.5% increase in less than two weeks. Gasoline usage in the U.S. has been plunging all year. The war rhetoric with Iran has been subdued. The economy is clearly in recession. WTF???

Oil prices and gas prices should be declining. But oil topped $89 per barrel this morning, back to the levels of late May, and $11 higher than 3 weeks ago. The three charts below paint an odd picture. East coast cities like Boston and Philly are experiencing a much larger surge than Chicago and LA. Of course, prices in Chicago and LA are still 6% to 8% higher than East Coast prices, likely due to taxes. I’m baffled by the relatively flat prices in Chicago and LA. Maybe someone out there has some insight.

The last chart shows the lag in prices rising for oil versus gasoline. Within the next month people on the East Coast will be paying $3.70 per gallon and the Midwest and West Coast will again push above $4.00 per gallon. This will be a further boost to food prices, as all those drought stricken crops need to be transported by truck to your local Piggly Wiggly.

With a full blown recession and surging food and energy costs, how Obama gets re-elected in November is beyond me. As he grows desperate, will he purposely generate either a war or social unrest in our cities? His only chance to retain power will be to distract the masses from their economic plight.


IT ONLY TOOK A GLOBAL DEPRESSION TO REDUCE GAS PRICES BY 40 CENTS

You can’t watch the mainstream media propaganda channels for more than ten minutes without a talking head breathlessly announcing that gas prices have dropped for the 24th day in a row and are now back to $3.55 a gallon. Wall Street oil analysts, who are paid hundreds of thousands of dollars per year to tell us why prices rose or fell after the fact, are paraded on CNBC to proclaim the huge consumer windfall from the drop in price. This is just another episode of a never ending reality show, designed to keep the average American sedated so they’ll continue to spend money they don’t have buying crap they don’t need. The brainless twits that pass for journalists in the corporate mainstream media never give the viewer or reader any historical context to judge the true impact of the price increase or decrease. The government agencies promoting the storyline of those in power extrapolate the current trend and ignore the basic facts of supply, demand, price and peak oil. The EIA is now predicting further drops in prices. Two months ago they predicted steadily rising prices through the summer. What would we do without these government drones guiding us?

Inflation Adjusted Gasoline Prices (Monthly)

As you can see from the chart, gas prices tend to be volatile and unpredictable in the short term. You can also see that since 1998 the trend has been relentlessly higher. The average inflation adjusted price of gasoline in 1998 was $1.41 per gallon, versus $3.55 today, a 152% increase in fourteen years. Over this same time frame the BLS manipulated CPI was up only 44%. If we are swimming in oil, as the MSM pundits claim, why the tremendous surge in price? It must be those evil oil companies. It couldn’t possibly be the impact of peak oil. To acknowledge the fact that worldwide oil production has reached its peak would be to concede that our suburban sprawl, just in time world is drawing to an excruciating end. So the politicians spout their assigned storylines, supported by their paid off “experts” (aka Daniel Yergin), and unquestioningly reported as fact by their designated corporate media outlet. Those of a liberal bent assail oil companies and speculators; refuse to acknowledge the law of supply and demand, while touting green energy as the solution to all our energy needs. Those of a conservative bent believe in attacking foreign countries to secure “our” oil, refuse to acknowledge the law of supply and demand, and spout “drill, drill, drill” slogans because dealing with facts is inconvenient. The willfully ignorant public believes whichever storyline matches their preconceived beliefs. All is well – no one is required to think critically. Thinking is hard.

There are numerous factors that affect the price of oil on a daily basis, but at the end of the day supply and demand determine price. The chart below documents the key external events that have had a major impact on oil prices since 1970. The vital fact that you won’t hear on CNBC is that every recession since 1970 has been immediately preceded by an oil price spike. Anyone living in the real world (this excludes Cramer, Liesman, Bartiromo, & Kudlow) knows we have entered part two of the Greater Depression. The surge in oil prices in the last two years has precipitated this renewed downturn.

The MSM blathering baboons of bullshit dutifully report the price of gas on a given day. People who live in the real world fill up their gas tanks every week, so the average price over a period of time is what matters. The average price of a gallon of gasoline in 2008 was $3.39. The average price in 2011 was $3.48. The average price in 2012 has been $3.62 thus far. This data paints an entirely different picture than the one painted by the politicians, experts and the clueless captured media. Gas prices are higher than they were prior to the last economic implosion. Cause and effect is a concept beyond the intellectual capabilities of MSM journalists and the millions of government educated zombies they mesmerize with misinformation. The lack of intellectual curiosity and critical thinking skills plays directly into the hands of those with a storyline to sell or truth to obscure.

Swimming in Oil

The recent storyline proliferated by the MSM at the behest of Washington DC politicians and the corporate interests that control them, is that the U.S. is on the verge of energy independence, with hundreds of years of plentiful oil right under our feet. The chart below made the rounds last week on Bloomberg, defender and mouthpiece of billionaires everywhere. This chart surely proves that peak oil is bullshit. Right?

Besides the false representation of oil production and the misleading conclusion that we have more oil than we need, the chart and Bloomberg screed does not provide the true context of why worldwide demand is tumbling. The chart is NOT showing global crude oil production. It is showing global oil and other liquids supply, which includes crude and condensate, natural gas plant liquids, other liquids (mostly ethanol), and processing gains (increase in volume from refining heavy oil). The MSM would rather mislead the public than provide the true picture of the supposed oil production boom. The question is whether the MSM is misleading the public due to their own journalistic incompetence or are they carrying out their assigned mission on behalf of the corporate oligarchs running the kingdom.

The chart below reveals a truer picture of the worldwide energy situation. Conventional oil production hit its peak/plateau around 74 million barrels per day at the end of 2004, and has barely budged from that level over the last eight years. Despite all the rhetoric about the North American oil boom, conventional oil production is at virtually the same level today as it was in 2004. The U.S.(shale oil) and Canadian (tar sands) gains in production have been matched by the collapse in Mexican production. The Middle East countries produced 23.3 million barrels in September 2004. The average price of a barrel of oil in 2004 was $38. They are now only producing 23.9 million barrels when prices are 120% higher.

World Oil and Other Liquids Supply

Global oil demand in 2004 was around 84 million barrels per day. To increase liquid fuel supply to meet the 90 million barrels per day demand we had to turn to unconventional fuels like tar sands, tight oil, and biofuels, all of which have far higher production costs and far less energy content than sweet crude. As the easy to access, cheap to produce ($20 per barrel in Saudi Arabia), close to the surface sweet crude has been depleted, it has been replaced by heavy crude, tar sands, deep-water oil, and shale oil, with production costs in excess of $80 per barrel. Anyone anticipating a long-term decline in fuel prices must be smoking tar sands in their bong. The liquids that have “replaced” conventional crude have a few slight drawbacks. Natural gas liquids provide about 70% as much energy per barrel as crude oil, so a barrel of NGL is not equivalent to a barrel of crude. Have you filled up your SUV lately with some NGL? Ethanol provides only 60% as much energy per barrel as crude oil and its EROEI is pitifully low. The energy returned on energy invested for these non-conventional sources of energy approaches the minimum limits unless prices rise dramatically. The Obama green army does not want this chart making its way into the public discourse. Their fantasyland of renewable energy solutions is proven to be a fool’s errand.

Catch-22 Energy Edition

The price of a barrel of West Texas crude is currently $86 per barrel, down from $109 per barrel in February. Obama supporters will proclaim that his threat to crack down on speculators had the desired effect. He must have scared those nasty speculators with his gravitas. The price rise surely didn’t have anything to do with the U.S. led attack on Libya, the act of war economic sanctions on Iran, the beating of Israel/U.S. war drums, Japan demand due to the shutdown of their nuclear power industry, or the relentlessly higher demand from China and India. And now the MSM is trying to spin a yarn that prices have dropped by 21% because worldwide supply is surging. That is so much more palatable than telling the truth and admitting that we’ve entered the 2nd phase of the Greater Depression.

It took $140 a barrel in oil in 2008 to tip the world into recession. Worldwide economies were much stronger then. The U.S. National Debt has risen by $6.5 trillion, or 70% since 2008. Real GDP has risen by $200 billion since 2008, or a 1.5% increase. Debt to GDP has risen from 64% to 102%. Consumer debt at $2.55 trillion is exactly the same as the 2008 level even after Wall Street banks have written off over $1 trillion, subsidized by the American taxpayer. The consumer deleveraging storyline is completely false. In 2008 there were 234 million working age Americans and 145 million of them were employed. Today there are 243 million working age Americans and 142 million of them are employed. In 2008 there were 28 million Americans in the food stamp program. Today there are 46 million Americans collecting food stamps. The economic situation in Europe has deteriorated at a far greater rate. Therefore, it is not surprising that it only took $109 a barrel oil to push the world back into recession.

The main reason prices are dropping is the collapse in demand from Europe and the United States. The bumpy plateau of peak oil is in full force. Prices rise to the point where they push economies into recession, demand crashes due to the recession, and prices decline. The double whammy of oil prices reaching $111 a barrel in 2011 and $109 a barrel in 2012 have sapped the life out of the American consumer. This is reflected in the plunge in gasoline and petroleum usage since 2008, with a temporary leveling off in 2010, followed by a further nosedive since 2011. As this recession deepens over the next six months, prices will likely fall further. But this is where the Catch-22 kicks in.

Once prices drop below $80 a barrel it sets in motion a reduction in capital investment, as new production projects are not economically feasible below $80 per barrel. Oil analyst Chris Nedler explains the Catch-22 aspect of oil prices in a recent article:

Research by veteran petroleum economist Chris Skrebowski, along with analysts Steven Kopits and Robert Hirsch, details the new costs: $40 – $80 a barrel for a new barrel of production capacity in some OPEC countries; $70 – $90 a barrel for the Canadian tar sands and heavy oil from Venezuela’s Orinoco belt; and $70 – $80 a barrel for deep-water oil. Various sources suggest that a price of at least $80 is needed to sustain U.S. tight oil production.

Those are just the production costs, however. In order to pacify its population during the Arab Spring and pay for significant new infrastructure projects, Saudi Arabia has made enormous financial commitments in the past several years. The kingdom really needs $90 – $100 a barrel now to balance its budget. Other major exporters like Venezuela and Russia have similar budget-driven incentives to keep prices high.

Globally, Skrebowski estimates that it costs $80 – $110 to bring a new barrel of production capacity online. Research from IEA and others shows that the more marginal liquids like Arctic oil, gas-to-liquids, coal-to-liquids, and biofuels are toward the top end of that range.

My own research suggests that $85 is really the comfortable global minimum. That’s the price now needed to break even in the Canadian tar sands, and it also seems to be roughly the level at which banks and major exploration companies are willing to commit the billions of dollars it takes to develop new projects.

Oil prices may temporarily drop below $80, but prices below that level for a prolonged period will lead to supply being constricted, which will ultimately lead to higher prices. The storyline of hundreds of years of Bakken shale oil that will make the U.S. energy independent is the latest fiction to be peddled by the oligarchs as a way to sedate and confuse the masses.

What the Frack

U.S. oil production in 2007 averaged 8.5 million barrels per day. Today, the U.S. is producing 10.7 million barrels per day. We must have hit the jackpot. Not quite. Actual crude oil production has increased by 1 million barrels per day, a 20% increase. The other 1.2 million barrels have been from liquefied natural gas (up 34%) and government subsidized ethanol (up 100%).

The U.S. crude oil production is at the same level it was in 1998, but somehow we are on the verge of becoming energy independent. The recent increase is solely due to the horizontal drilling and hydraulic fracturing of shale deposits in Texas and North Dakota. You don’t hear much about Alaskan production declining for the ninth year in a row and California production declining to the lowest level in three decades. The paid shills predicting Bakken production of 3 million barrels per day are purposely lying or just plain delusional.

North Dakota oil production has reached 550,000 barrels per day versus 187,000 barrels per day in 2009. Simpletons in the MSM will just extrapolate this growth to 3 million barrels by 2020. No need to examine the facts. Oil market expert Tom Whipple reveals the dirty secrets behind the Bakken shale oil miracle:

It took the production from 6,617 wells to produce North Dakota’s 546,000 b/d in January. Divide the daily production by the number of wells and you get an astoundingly low 82 b/d from each well. I say “astounding” because a good new offshore well can do 50,000 b/d. BP’s Macondo well which exploded in the Gulf a couple of years ago was pumping out an estimated 53,000 b/d before it was capped.

Now a North Dakota shale oil well is not in the cost class of a deep-water offshore platform which can run into the billions, but they do cost about three times as much as a classic onshore oil well as they first must be drilled down 11,000 feet and then 10,000 horizontally through the oil bearing layer before the fracturing of the rock can take place. The “fracking” involves at least 15 massive pumps that inject water and other chemicals into the well. Take a Google Earth flight over northwestern North Dakota. The fracked wells are hard to miss as there are now about 9,000 of them and they are each the size of a football field.

There is still more — fracked wells don’t keep producing very long. Although a few newly fracked wells may start out producing in the vicinity of 1,000 barrels a day, this rate usually falls by 65 percent the first year; 35 percent the second; and another 15 percent the third. Within a few years most wells are producing in the vicinity of 100 b/d or less which is why the state average for January is only 82 b/d despite the addition of 1300 new wells in 2011.

The rapid depletion of these wells, enormous expense to drill new wells, oil prices barely above cost of production, low EROEI, swiftly falling Alaskan and shallow water production, and the snail’s pace of deep water production are not a recipe for energy independence. Shale oil production will never exceed 1 million barrels per day. And if you believe Saudi Arabia’s promises to fulfill any shortfalls, I’ve got some delightful beachfront property in Afghanistan to sell you. Saudi conventional crude oil production is at the same level it was in 2005.

Saudi Arabia Oil Production

The seven year Saudi plateau is just a precursor to what is going to happen over the next decade. Saudi Arabia began pumping oil in 1945. It will all be gone by 2045. You can’t extract an infinite amount of oil from a finite world. Pretending this isn’t true won’t make it so. Oil has been the lifeblood of our nation since the late 1800s. The depletion of this essential ingredient of the modern world will not lead to a sudden death for our way of life but a slow downward spiral of waning supply, escalating prices, and economic decay.

The sustained high and rising oil prices will be economically destructive as our debt saturated, suburban sprawl, mall centric, SUV crazed, cheap oil dependent society methodically and agonizingly implodes. Chris Skrebowski describes our future succinctly:

“Unless and until adaptive responses are large and fast enough to constrain the upward trend of oil prices, the primary adaptive response will be periodic economic crashes of a magnitude that depresses oil consumption and oil prices.”

We’ve entered one of these periodic economic crashes. They are coming faster and faster. So enjoy that 40 cent drop in gas prices as you drive down to sign up for food stamps. The Saudis have a saying that acknowledges their luck in being born on top of billions of barrels of oil and the inevitability of its depletion:

“My father rode a camel, I drive a car, my son flies a jet plane, his son will ride a camel.”   

Delusional Americans believe they have a right to cheap plentiful oil forever. They refuse to acknowledge that luck has played the major part in their rise to economic power. The American saying will be:

My great grandfather rode a horse, my grandfather drove a Model T, my father drove a Buick, I leased a Cadillac Escalade, my son died in the Middle East fighting for my oil, his son will never be born.  

order non hybrid seeds

HOW ABOUT $6 A GALLON GAS?

There is no effort by any party to reduce the tensions that have been building between the U.S., Israel, the EU and Iran. Both China and Russia are supporting Iran. This crisis has the potential to spark the next act in this Fourth Turning. The next act will be a tragedy, not a comedy.

Expect $200 Oil Prices & $6 At The Pump as Iran Is Now A Full-Blown Crisis

Kent Moors: Just when it looked like we could take a breather from the Strait of Hormuz, all attention is back on Iran.

There are three reasons for this –  all happening within the last week:

  1. First was Tehran’s successful launch of a satellite, viewed by all in the region as being for military intelligence.
  2. Second, in his toughest talk to date, Iranian Supreme Leader Ayatollah Ali Khamenei voiced defiance to Western sanctions and pledged open retaliationif they are instituted.
  3. Finally, last Thursday, U.S. Secretary of Defense Leon Panetta expressed concern that, if matters continue, Israel could attempt an air-strike takeout of Iranian nuclear facilities within a month. Iran has been frantically moving essential components of its nuclear program underground to withstand such an attack.

All of this is, once again, leading to a rise in crude oil prices (NYSEArca:USO).


What’s more, the EU decision to stop importing Iranian crude starting July 1 will cripple any chance Tehran has to combat escalating economic and political turmoil at home.

Yet Khamenei’s defiant tone during his Friday prayer meeting speech indicates that Iran’s religious leadership will not wait for the system to unravel.

And that is what makes this both a full-blown and an intensifying crisis.

Brinksmanship in the Straits of Hormuz

So what’s being done?

Washington has little – leverage,  save its ability to temper an immediate escalation by Israel (leverage the U.S. can still apply, at least for the moment). It also has some indirect influence  on what the E.U. does.

Meanwhile, Saudi Arabia also is a  wild card. It will not tolerate a nuclear Iran.

And yes, there are ample indications that American and Israeli intelligence have concluded Iran will achieve the ability to develop nuclear weapons in the next 18 to 24 months.

Some elements of that process will be available earlier, but remember: A weapon is of little value unless it can be controlled and delivered. The logistical and infrastructure considerations need  to be in place first.

Yet with such an inevitable conclusion staring them in the face, the West has decided to embark on a risky  path…

The target here is not the nuclear project at all (over which there is less and less outside control). Instead, it has become about creating massive domestic instability to bring down a  regime.

Now, this is not about ending the theocracy. With or without Mahmoud Ahmadinejad as president or Ali Khamenei as supreme leader, Iran will remain a Shiite-dominated country. Religion decisively controls politics, and the clergy oversees the society.

The West is seeking a more moderate application of what will remain the Iranian cultural reality.

However, as the brinksmanship intensifies, so will the price of crude oil (NYSEArca:USO). Tehran, in this dangerous game of  international chicken, really only has one card to play – the Strait of Hormuz. [Related: ConocoPhillips (NYSE:COP), Exxon Mobil Corporation (NYSE:XOM), Chevron Corporation (NYSE:CVX), Devon Energy Corporation (NYSE:DVN)]

There has been much misinformation circulated about the strait. Here are the facts.

On any given day, 18% to 20% of the world’s crude oil passes through it.

According to the Energy Information Administration, the Strait’s narrowest point is 21 miles wide; however, the  width of the shipping lane in either direction is just two miles, cushioned by  another two-mile buffer zone.

Of greater significance, though, is  the fact that most of the world’s current excess capacity is Saudi. (This is the oil that can be brought to market quickly to offset unusual demand spikes  or cuts in supply elsewhere.) And, unfortunately, Saudi volume must find its  way through the same little strait.

If we’re unable to access the Saudi  excess, that loss guarantees the global market will be out of balance.  That will intensify the price upsurge – an upsurge that is already happening.

Now for the question I’m being asked several times a day in media interviews…

Just how bad can it get?

$200 Oil and $6 at the Pump

If Iran closes the Strait of Hormuz, crude oil prices will pop by between $30 and $40 a barrel… within hours.

Despite the excess storage capacity in both the U.S. and European markets and the contracts already at sea, oil traders set prices on a futures curve.

In a normal market the price is set at the expected cost of the next available barrel. During times of crisis, on the other hand, that price is determined by the cost of the most expensive next available barrel. [Related: United States Oil Fund (NYSEArca:USO), SPDR Select Sector Fund (NYSEArca:XLE)]

Should the strait remain closed for 72 hours, oil trading will push up the barrel price to $180 in New York, and closer to $200 in Europe.

Now let me put this in perspective  for you…

A $1 rise in the price of crude  translates into a 3.6-cent rise in the cost at the pump. Within the first week of the strait closure, therefore, pressures in the retail gasoline market will push the price to an average of $6 a gallon.

After one week!

There’s no doubt that this will paralyze economic recovery on both sides of the Atlantic. (Delivery costs on everything will go up, and diesel prices will rise quicker than gasoline.) This is apparently what Khamenei has threatened.

All energy options will be on the table, from alternative energy to tapping Canadian oil sands (and approving pipelines to transport it south), moving from gasoline to compressed natural gas for vehicle fuel, and a range of other possibilities.

Of course, none of these options can move quickly enough to stave off collapse.

Now, there is no guarantee any of this is going to happen. But the uncertainty is moving oil up today. And the uncertainty will remain in the market as we come closer to July 1.

That gives us some space to develop the investor’s reaction to events.

What the Iranian Crisis Means for Investors

Nothing happens until the beginning  of July on the European oil embargo, but the markets are hardly going to wait  that long.

I am off to London for meetings on  the crisis at the end of this month, followed by the annual session of the royal chartered Windsor Energy Group at the castle of the same name, and then  on to Scotland for a presentation at the U.K. Energy Policy Center. This crisis  will be the center of attention at all these get-togethers, and I will be  taking readers of Oil and Energy Investor along with me.

So how, as investors, do we respond  to this?

I think it requires a rebalancing your portfolio, as well as revising your exposure to both corporate dividends and the commodity value of oil and gas.

Written By Kent Moors, Ph.D. From Money Morning

Dr. Kent F. Moors is an internationally recognized expert in global risk management, oil/natural gas policy and finance, cross-border capital flows, emerging market economic and fiscal development, political, financial and market risk assessment. He is the executive managing partner of Risk Management Associates International LLP (RMAI), a full-service, global-management-consulting and executive training firm. Moors has been an advisor to the highest levels of the U.S., Russian, Kazakh, Bahamian, Iraqi and Kurdish governments, to the governors of several U.S. states, and to the premiers of two Canadian provinces. He’s served as a consultant to private companies, financial institutions and law firms in 25 countries and has appeared more than 1,400 times as a featured radio-and-television commentator in North America, Europe and Russia, appearing on ABC, BBC, Bloomberg TV, CBS, CNN, NBC, Russian RTV and regularly on Fox Business Network.

Moors is a contributing editor to the two current leading post-Soviet oil and natural gas publications (Russian Petroleum Investorand Caspian Investor), monthly digests in Middle Eastern and Eurasian market developments, as well as six previous analytical series targeting post-Soviet and emerging markets. He also directs WorldTrade Executive’s Russian and Caspian Basin Special Projects Division. The effort brings together specialists from North America, Europe, the former Soviet Union and Central Asia in an integrated electronic network allowing rapid response to global energy and financial developments.

Related posts:

  1. 20 Signs That Europe Is Plunging Into A Full-Blown Economic Depression (VGK, IEV, EPV, EWP, EWI, EUO, EWG)
  2. Investors: All You Need To Know About Iran, $200 Oil, and $6.00 Gas Prices (USO, SU, XLE, UCO, DIG, DUG)
  3. Oil Prices: Should Investors Be Worried About The Iran Situation? (USO, OIH, ERY, ERX, XLE)
  4. Outlook For Oil In 2012: Why Investors Should Expect $150 Oil Prices and How To Profit (USO, PBR, XOP, CHK, SU)
  5. Expect Much Higher Silver and Gold Prices By Year’s End (SLV, SLW, GLD, NEM)

HOW ABOUT $175 A BARREL OIL?

I think the chances of military conflict with Iran in the next two years are better than 50%. Students stormed the UK embassy in Iran. London is kicking the Iranians out of their embassy in London. Israel blew up an Iranian missile base a couple weeks ago. Israel will not let Iran get a nuke. Obama needs to distract the public from our terrible economy with a foreign crisis. The implications of Iranian oil coming off the worldwide markets would be devastating. China would not be happy since they get 10% of their oil from Iran. The world is already on the verge of collapse and a surge in oil prices would create a worldwide depression. This Fourth Turning sure is interesting.

Funds, refiners ponder oil Armageddon: war on Iran

REUTERS – Oil consuming nations, hedge funds and big oil refineries are quietly preparing for a Doomsday scenario: An attack on Iran that would halt oil supplies from OPEC’s second-largest producer.

Most political analysts and oil traders say the probability of military action is low, but they caution the risks of such an event have risen as the West and Israel grow increasingly alarmed by signs that Tehran is building nuclear weapons.

That has Chinese refiners drawing up new contingency plans, hedge funds taking out options on $170 crude, and energy experts scrambling to determine how a disruption in Iran’s oil supply — however remote the possibility — would impact world markets.

With production of about 3.5 million barrels per day, Iran supplies 2.5 percent of the world’s oil.

“I think the market has paid too little attention to the possibility of an attack on Iran. It’s still an unlikely event, but more likely than oil traders have been expecting,” says Bob McNally, once a White House energy advisor and now head of consultancy Rapidan Group.

Rising tensions were clear this week as Iranian protesters stormed two British diplomatic missions in Tehran in response to sanctions, smashing windows and burning the British flag.

The attacks prompted condemnation from London, Washington and the United Nations. Iran warned of “instability in global security.”

While traders in Europe prepare for a possible EU boycott of imports from Iran, mounting evidence elsewhere points to long-odds preparation for an even more severe outcome.

In Beijing, the foreign ministry has asked at least one major Iranian crude oil importer to review its contingency planning in case Iranian shipments stop.

In India, refiners are leafing through an unpublished report produced in March to look at fall-back options in the event of a major disruption.

And the International Energy Agency, the club of industrialised nations founded after the Arab oil embargo that coordinated the release of emergency oil stocks during Libya’s civil war, last week circulated to member countries an updated four-page factsheet detailing Iran’s oil industry and trade.

The document, not made public but obtained by Reuters, lists the vital statistics of Iran’s oil sector, including destinations by country. Two-thirds of its exports are shipped to China, India, Japan and South Korea; a fifth goes to the European Union.

Hedge funds, particularly those with a global macro-economic bias, have taken note, and are buying deep out-of-the-money call options that could pay off big if prices surge, senior market sources at two major banks said.

Open interest in $130 and $150 December 2012 options for U.S. crude oil on the New York Mercantile Exchange (NYMEX) rose by over 20 percent last week. Interest in the $170 call more than doubled to over 11,000 lots, or 11 million barrels. Still more traded over-the-counter, sources say.

McNally says that oil prices could surge as high as $175 a barrel if the Strait of Hormuz — conduit for a fifth of the world’s oil supply, including all of Iran’s exports — is shut in.

IAEA CITES “CREDIBLE” INFORMATION

This month’s speculation of an attack on Iran is the most intense since 2007, when reports showing that Iran had not halted uranium enrichment work fuelled speculation that President George W. Bush could launch some kind of action during his last year in office. Those fears helped fuel a 36 percent rise in oil prices in the second half of the year.

The latest anxiety was set off by the International Atomic Energy Agency’s November 8 report citing “credible” information that Iran had worked on designing an atomic bomb. A new round of sanctions followed, including the possibility that Europe could follow the United States in banning imports.

That alone would roil markets, but ultimately would likely just drive discounted crude sales to other consumers like China.

A more alarming — if more remote — possibility would be an attack by Israel, which has grown increasingly alarmed by the possibility of a nuclear-armed Iran. Israeli Defense Minister Ehud Barak said on November 19 that it was a matter of months, not years, before it would be too late to stop Tehran.

In that context, every tremor has been unnerving for markets. Some experts say an explosion at an Iranian military base earlier in the month was the work of Mossad, Israel’s intelligence agency. An unusually large tender by Israel’s main electricity supplier to buy distillate fuel raised eyebrows, although it was blamed on a shortage of natural gas imports.

REFINERS BRACE

No country has more reason to be concerned than China, which now gets one-tenth of its crude imports from Iran. Shipments have risen a third this year to 547,000 barrels per day as other countries including Japan reduce their dependence. Sinopec, Asia’s top refiner, is the world’s largest Iranian crude buyer.

The Foreign Ministry and the National Development and Reform Commission, which effectively oversees the oil sector, have asked companies that import the crude to prepare contingency plans for a major disruption in supply, a source with a state-owned company told Reuters.

The precautionary measure preceded the latest geopolitical angst and is broadly in line with Beijing’s growing concern over its dependence on imported energy. Earlier this year it issued a notice for firms to prepare for disruptions from Yemen.

But the focus has sharpened recently, the source said.

“The plan is not particularly for the tension this time, but it seems the government is paying exceptionally great attention to it this time,” said the source on condition of anonymity.

In India, which gets 12 percent of its imports from Iran, refiners had a potential preview of coming events when the country’s central bank scrapped a clearing house system last December, forcing refiners to scramble to arrange other means of payment in order to keep crude shipments flowing.

That incident — in addition to the Arab Spring uprising and the Japanese earthquake — prompted the government to document a brief but broad strategy for handling major disruptions.

The document, which has not been reported in detail, says that India could sustain fuel supplies to the market in the event of an import stoppage for about 30 days thanks to domestic storage, and would turn to unconventional and heavier imported crude as a fall-back.

It also urged the country’s state-owned refiners to work on developing domestic storage facilities for major OPEC suppliers, consider hiring supertankers to use as floating storage and to sign term deals to price crude on a delivered basis, a copy of the document seen by Reuters shows.

The government has not tasked refiners with additional preparations this month, industry sources say. And in any event, there’s not much they could do.

“If they cut supplies we will be left with no option than to buy from the spot market or from other Middle East suppliers,” said a senior official with state-run MRPL, Iran’s top India client.

To be sure, there’s only so much any refiner can do. The gap left by Iran will trigger a frenzy of buying on the spot market for substitute barrels, likely leading the IEA to release emergency reserves, as it did following the civil war in Libya, or other countries like Saudi Arabia to step into the breach.

“We probably need to do this ASAP but are putting our heads in the sand so far,” said one oil trader in Europe.

For refiners like Italy’s Eni (ENI.MI) and Hellenic Petroleum (HEPr.AT), the most pressing issue is not necessarily an unexpected outage but an import boycott imposed by their government. France has won limited support for such an embargo, but faces resistance from some nations that fear it could inflict more economic damage.

CHEAP PUNTS

Unlike in 2007, there’s not yet much evidence that a significant geopolitical risk premium is being factored into prices.

European benchmark Brent crude oil has rallied 4 percent in the past two days, partly due to accelerating discussion of a Europen boycott as well as Tuesday’s unrest in Tehran, during which protesters stormed two British diplomatic compounds.

But it is also down 4 percent since the IAEA’s November 8 report. Analysts say that it’s impossible to extract any Iran-specific pricing from a host of other recently supportive factors, including new hope to end Europe’s debt crisis, strong global distillate demand and upbeat U.S. consumer data.

“I don’t think there’s very much evidence (of an Iran premium),” says Ed Morse, global head of commodities research at Citigroup and a former State Department energy policy adviser.

And he does not see an attack as likely: “I think it’s a low probability event. Maybe higher than a year ago, but still low.”

But that is not stopping some from looking ahead. Oil prices would likely spike to at least $140 a barrel if Israel attacked Iran, according to the most benign of four scenarios put forward this week by Greg Sharenow, a portfolio manager at bond house PIMCO and a former Goldman Sachs oil trader.

He refused to predict a limit for prices under the most extreme “Doomsday” scenario in which disruptions spread beyond Iran and the Straits of Hormuz is blocked.

With that in mind, hedge funds are buying cheap options in a punt on an extreme outage. For about $1,500 per contract, a buyer can get the right to deliver a December 2012 futures contract at $150 a barrel; even if prices do not rise that high, the value of the options contract could increase tenfold.

The spark of demand for upside price protection this month is an abrupt reversal from most of this year, when the bias was toward puts that would hedge the risk of economic calamity.

“The kind of put skew we were seeing in the last three to six months was remarkable with people preparing for disaster – the Planet of the Apes trade, another massive market crash,” says Chris Thorpe, executive director of global energy derivatives at INTL FC Stone.

“Only in the last three or four weeks has there been increased call buying.”

Options remain relatively costly compared to earlier in the year, with implied volatility — a measure of option cost — of 43 percent above this year’s average of just below 35 percent, the CBOE Oil Volatility index shows.

But nonetheless it’s clear that for some funds the potential upside of violence in Iran means that interest is increasing.

Says Thorpe: “It’s at the back of people’s minds.”

WHERE’S OUR OIL PRICE COLLAPSE?

Make no mistake about it, without plentiful, cheap, and easy to access oil, the United States of America would descend into chaos and collapse. The fantasies painted by “green” energy dreamers only serve to divert the attention of the non critical thinking masses from the fact our sprawling suburban hyper technological society would come to a grinding halt in a matter of days without the 18 to 19 million barrels per day needed to run this ridiculous reality show. Delusional Americans think the steaks, hot dogs and pomegranates in their grocery stores magically appear on the shelves, the thirty electronic gadgets that rule their lives are created out of thin air by elves and the gasoline they pump into their mammoth SUVs is their God given right. The situation was already critical in 2005 when the Hirsch Report concluded:

“The peaking of world oil production presents the U.S. and the world with an unprecedented risk management problem. As peaking is approached, liquid fuel prices and price volatility will increase dramatically, and, without timely mitigation, the economic, social, and political costs will be unprecedented. Viable mitigation options exist on both the supply and demand sides, but to have substantial impact, they must be initiated more than a decade in advance of peaking.”

In the six years since this report there has been unprecedented oil price volatility as the world has reached the undulating plateau of peak cheap oil. The viable mitigation options on the demand and supply side were not pursued. The head in the sand hope for the best option was chosen. The government mandated options, ethanol and solar, have been absolute and utter disasters as billions of taxpayer dollars have been squandered and company after company goes bankrupt. The added benefit has been sky high corn prices, dwindling supplies and revolutions around the world due to soaring food prices. The last time the country went into recession in 2008, the price of oil plunged from $140 a barrel to $30 a barrel in the space of six months. I’d classify that as volatility. We’ve clearly entered a second recession in the last six months. So we should be getting the benefit of collapsing oil prices.

But, a funny thing happened on the way to another oil price collapse. It didn’t happen. WTI Crude is trading for $87 a barrel, up 23% since January 1. Unleaded gas prices are up 54% in the last year and 43% since January 1. Worldwide oil pricing is not based on WTI crude but Brent crude, selling for $113 per barrel, only down 10% from its April high of $125. The U.S. and Europe consume 40% of all the oil in the world on a daily basis. Multiple European countries have been in recession for the last nine months. The U.S. economy has been in free fall for six months.

Some short term factors will continue to support higher oil prices.  The Chinese continue to fill their strategic petroleum reserve, Japan is still relying on diesel generators for electricity post-tsunami, and the Middle East is developing a love affair with the air conditioner. But, it’s the long term factors that will lead to much higher oil prices for myopic oblivious Americans.

U.S. GDP 2011 Q2 update 2009-2011 US GDP second Q2011 (percent) July 2011

John Hussman describes the situation on the ground today based upon six economic conditions presently in effect:

There are certainly a great number of opinions about the prospect of recession, but the evidence we observe at present has 100% sensitivity (these conditions have always been observed during or just prior to each U.S. recession) and 100% specificity (the only time we observe the full set of these conditions is during or just prior to U.S. recessions).

With 40% of the world in or near recession, how come oil prices are still so high and much higher than last year, when the economies in Europe and the U.S. were expanding? The number of vehicle miles driven in the U.S. is still below the level reached 43 months ago and at the same level as early 2005. The price of a barrel of oil in early 2005 was $42. The U.S. is using the same amount of oil, but the price is up 112%. It seems the U.S. isn’t calling the shots when it comes to the worldwide supply/demand equation.

It would probably be a surprise to most people that U.S. oil consumption today is at the same level it was in 1997 and is 10% lower than the peak reached in 2005. This is not a reflection of increased efficiency or Americans gravitating towards smaller vehicles with better mileage. Americans are still addicted to their SUVs and gas guzzling luxury automobiles. It’s a reflection of a U.S. economy that has been in a downward spiral since 2005.

1996 18,476.15 3.89 %
1997 18,774.07 1.61 %
1998 18,946.01 0.92 %
1999 19,603.83 3.47 %
2000 19,717.92 0.58 %
2001 19,772.60 0.28 %
2002 19,834.31 0.31 %
2003 20,144.82 1.57 %
2004 20,833.01 3.42 %
2005 20,924.36 0.44 %
2006 20,803.93 -0.58 %
2007 20,818.37 0.07 %
2008 19,563.33 -6.03 %
2009 18,810.01 -3.85 %

If the U.S. isn’t driving oil demand in the world, then why are prices going up? There are three main factors:

  1. Dramatic increase in demand from China and other developing countries.
  2. A plunging U.S. Dollar
  3. Peak oil has arrived

Surging Developing World Demand

The Energy Information Administration issued their latest forecast and it does not bode well for lower prices:

Despite continued concerns over the pace of the global economic recovery, particularly in developed countries, the US Energy Information Administration expects worldwide oil consumption to increase this year and next spurred by demand in developing countries. US oil consumption, however, is forecast to contract from a year ago. Worldwide oil demand, led by China, will increase by 1.4 million b/d in 2011 to average 88.19 million b/d and by 1.6 million b/d in 2012, outpacing average global demand growth of 1.3 million b/d from 1998-2007, before the onset of the global economic downturn.

China is now consuming over 9 million barrels per day. This is up from an average of 7 million barrels per day in 2006. Platts, a global energy analyst, put China’s 2010 figures at 8.5 million barrels per day, up 11.43% from the previous year. The forecast for China’s crude throughput in 2011 is an average of 9.24 million barrels per day up 8.5% from 2010. In the first seven months of this year, total crude throughput stood at average of 8.95 million barrels per day.

Standard Chartered Bank predicts that, by the year 2020, China will overtake all of Europe as the second largest consumer of oil in the world, and should catch up to the U.S. by the year 2030 as China’s demand continues to rise while U.S. demand is expected to be flat. Chinese crude imports grew 17.5% in 2010 to 4.79 million barrels per day. China is importing 55% of its oil today versus 40% in 2004.

China’s oil consumption per capita has increased over 350% since the early 1980s to an estimated 2.7 barrels per year in 2011. Consumption per capita has risen nearly 100% in just the past decade. Oil consumption per capita in the U.S. currently ranks among the top industrialized nations in the world at 25 barrels per year. However, today’s consumption levels are approximately 20% lower than they were in 1979. The chart below paints a picture of woe for the United States and the world. China overtook the United States in auto sales in 2009. They now sell approximately 15 million new vehicles per year. India sells approximately 2 million new vehicles per year. The U.S. sells just over 12 million new vehicles per year. In China and India there are approximately 6 car owners per 100 people. In the U.S. there are 85 car owners per 100 people.

They call China, India and the rest of the developing world – Developing – because they will be rapidly expanding their consumption of goods, services and food. There will certainly be bumps along the way, as China is experiencing now, but the consumption of oil by the developing world will plow relentlessly higher. China isn’t the only emerging country to show big increases in per capita consumption. The growth in consumption for several other countries far outpaces China. Consumption per capita in Malaysia has nearly quadrupled since the mid-1960s. Consumption in Thailand and Brazil has more than doubled to roughly 5.7 barrels and 4.8 barrels per year, respectively.

Developed countries, especially those in Western Europe, have experienced substantial declines in oil consumption. Today’s per capita consumption in Sweden is roughly 12 barrels per year, down from 25 barrels per year in the mid-1970s.  France, Japan, Norway and U.K. all use less oil on a per capita basis than they did in the 1970s. These countries have been able to drive down the consumption of oil by taxing gasoline at an excessive level.

Americans pay 43 cents in taxes out of the $3.70 they pay at the pump for a gallon of gasoline. A driver in the UK is paying $4 per gallon in taxes out of the $9 per gallon cost. Gasoline costs between $8 and $9 per gallon across Europe today. The extreme level of gas taxes certainly reduces car sizes, consumption and traffic. Too bad the mad socialists across Europe spent the taxes on expanding their welfare states and promising even more to their populations. Maybe a $6 per gallon tax will do the trick. Forcing Americans to drive less by doubling the gas tax is a quaint idea, but it is too late in the game. Europe is still made up of small towns and cities with the populations still fairly consolidated. Biking, walking and small rail travel is easy and feasible. The sprawling suburban enclaves that proliferate across the American countryside, dotted by thousands of malls and McMansion communities, accessible only by automobiles, make it impossible to implement a rational energy efficient model for moving forward. We cannot reverse 60 years of irrationality. Even without higher gas taxes, the price of gasoline will move relentlessly higher due to the stealth tax of currency debasement.

A Plunging US Dollar

The US dollar has fallen 15% versus a basket of worldwide currencies (DXY) since February 2009. This is amazing considering that 57% of the index weighting is the Euro. If you haven’t noticed, Europe is a basket case on the verge of economic disintegration. The US imports a net 9.4 million barrels of oil per day, or 49% of our daily consumption. Our largest suppliers are:

  1. Canada – 2.6 million barrels per day
  2. Mexico – 1.3 million barrels per day
  3. Saudi Arabia – 1.1 million barrels per day
  4. Nigeria – 1.0 million barrels per day
  5. Venezuela – 1.0 million barrels per day
  6. Russia – 600,000 barrels per day
  7. Algeria – 500,000 barrels per day
  8. Iraq – 400,000 barrels per day

These eight countries account for over 70% of our daily oil imports. You hear the “experts” on CNBC declare that our oil supply situation is secure because close to 60% of our daily usage is sourced from North America. The presumption is that Canada and Mexico are somehow under our control. There is one problem with this storyline. US oil production peaked in 1971 and relentlessly declines as M. King Hubbert predicted it would. Mexico will cease to be a supplier to the U.S. by 2015 as their Cantarell oil field is in collapse. Most of the oil supplied from Canada is from their tar sands. Expansion of these fields is difficult as it takes tremendous amounts of natural gas and water to extract the oil.

The rest of the countries on the list dislike us, hate us, or are in constant danger of implosion. When the Neo-Cons on Fox News try to convince you that Iraq has been a huge success and certainly worth the $3 trillion of national wealth expended, along with 4,500 dead and 32,000 wounded soldiers, you might want to keep in mind that Iraq was exporting 795,000 barrels of oil per day to the U.S. in 2001 when the evil dictator was in charge. Today, we are getting 415,000 barrels per day. Dick Cheney was never good at long term strategic planning.

We better plant more corn, as our supply situation is far from stable. Maybe we can install solar panels from Obama’s Solyndra factory on the roofs of the 65 Chevy Volts that were sold in the U.S. this year, to alleviate our oil supply problem. The reliability and stability of our oil supply takes second place to the price increases caused by Ben Bernanke and his printing press. The average American housewife driving her 1.5 children in her enormous two and a half ton Chevy Tahoe or gigantic Toyota Sequoia two miles to baseball practice doesn’t comprehend why it is costing her $100 to fill the 26 gallon tank. If she listens to the brain dead mainstream media pundits, she’ll conclude that Big Oil is to blame. The real reason is Big Finance in conspiracy with Big Government.

Ben Bernanke is responsible for Americans paying $4 a gallon for gasoline. Zero interest rates, printing money out of thin air to buy $2 trillion of mortgage and Treasury bonds, and propping up insolvent criminal banks across the globe have one purpose – to deflate the value of the U.S. dollar. The rulers of the American Empire realize they can never repay the debts they have accumulated. They have chosen to default through debasement. It’s an insidious and immoral method of defaulting on your obligations. Let’s look at from the perspective of our two biggest oil suppliers.

A barrel of oil cost $40 a barrel in early 2009. The U.S. dollar has declined 30% versus the Canadian dollar since early 2009. The U.S. dollar has shockingly declined 20% versus the Mexican Peso since early 2009. How could the mighty USD decline 20% against the currency of a 3rd world country on the verge of being a failed state? Ask Ben Bernanke. Our lenders can’t do much about the continuing debasement of our currency, but our oil suppliers can. They will raise the price of oil in proportion to our currency devaluation. Since Bernanke’s only solution is continuous debasement, the price of oil will relentlessly rise.

Peak Oil Has Arrived

“By 2012, surplus oil production capacity could entirely disappear, and as early as 2015, the shortfall in output could reach nearly 10 MBD. At present, investment in oil production is only beginning to pick up, with the result that production could reach a prolonged plateau. By 2030, the world will require production of 118 MBD, but energy producers may only be producing 100 MBD unless there are major changes in current investment and drilling capacity.” – 2010 Joint Operating Environment Report

We’ve arrived at the point where demand has begun to outpace supply and even the onset of another worldwide recession will not assuage this fact. World oil supply has peaked just below 89 million barrels per day. Supply has since fallen to 87.5 million barrels per day, as Libyan supply was completely removed from world markets. The International Energy Agency is already forecasting worldwide demand to reach 90 million barrels per day in the second half of 2011 and reach 92 million barrels per day in 2012. The IEA warns that “just at the time when demand is expected to recover, physical limits on production capacity could lead to another wave of price increases, in a cyclical pattern that is not new to the world oil market.”

project global oil production through 2100

The world is trapped in an inescapable conundrum. As supply dwindles, prices increase, causing global economies to contract, and temporarily causing a drop in prices, except the lows are higher each time. The drill, drill, drill ideologues do nothing but confuse and mislead the easily led masses. We have 2% of the world’s oil reserves and consume more than 20% of the daily output. We consume 7 billion barrels of oil per year.

Drilling for oil in the Arctic National Wildlife Refuge in Alaska and areas formerly off limits in the Outer Continental Shelf will not close the supply gap. The amount of recoverable oil in the Arctic coastal plain is estimated to be between 5.7 billion and 16 billion barrels. This could supply as little as a year’s worth of oil. And it will take 10 years to produce any oil from this supply. The OCS has only slightly more recoverable oil at an estimated 18 billion barrels and the BP Gulf Oil disaster showed how easy this oil is to access safely. The new over hyped energy savior is shale gas. The cheerleaders in the natural gas industry claim that we have four Saudi Arabias worth of natural gas in the U.S. This is nothing but PR talking points to convince the masses that we can easily adapt. The amount of shale gas that can be economically produced is far less than the amounts being touted by the industry. The wells deplete rapidly and the environmental damage has been well documented. And last but certainly not least, we have the abiotic oil believers that convince themselves the wells will refill despite the fact that there is not one instance of an oil well refilling once it is depleted.

I wrote an article called Peak Denial About Peak Oil exactly one year ago when gas was selling for $2.60 a gallon. I railed at the short sightedness of politicians and citizens alike for ignoring a calamitous crisis that was directly before their eyes. Just like our accumulation of $4 billion per day in debt, peak oil is simply a matter of math. We cannot take on ever increasing amounts of debt in order to live above our means without collapsing our economic system. We cannot expect to run our energy intensive world with a depleting energy source. There is no amount of spin and PR that can change the math. Un-payable levels of debt and dwindling supplies of oil will merge into a perfect storm over the next ten years to permanently change our world. The change will be traumatic, horrible, bloody and a complete surprise to the non-critical thinking public.

“In the longer run, unless we take serious steps to prepare for the day that we can no longer increase production of conventional oil, we are faced with the possibility of a major economic shock—and the political unrest that would ensue.”Dr. James Schlesinger – former US Energy Secretary, 16th November 2005

We were warned. We failed to heed the warnings. If we had begun making the dramatic changes to our society 5 to 10 years ago, we may have been able to partially alleviate the pain and suffering ahead. Instead we spent our national treasure fighting Wars on Terror and bailing out criminal bankers. Converting truck and bus fleets to natural gas; expanding the use of safe nuclear power; utilizing wind, geothermal, and solar where economically feasible; buying more fuel efficient vehicles; and creating more localized communities supported by light rail with easy access to bike and walking options, would have allowed a more gradual shift to a less energy intensive society.

We’ve done nothing to prepare for the onset of peak oil. Until this foreseeable crisis hits with its full force like a Category 5 hurricane, Americans will continue to fill up their M1 tank sized, leased SUVs, tweet about Lady Gaga’s latest stunt, and tune in to this week’s episode of Jersey Shore. Meanwhile, economic stagnation, catastrophe and wars for oil are darkening the skies on our horizon.


“Dependence on imported oil, particularly from the Middle East, has become the elephant in the foreign policy living room, an overriding strategic consideration composed of a multitude of issues. …. Taken in whole, the National Energy Policy does not offer a compelling solution to the growing danger of foreign oil dependence.  …  Future military efforts to secure the oil supply pose tremendous challenges due to the number of potential crisis areas.  …..  Economic stagnation or catastrophe lurk close at hand, to be triggered by another embargo, collapse of the Saudi monarchy, or civil disorder in any of a dozen nations.”–  America’s Strategic Imperative A “Manhattan Project” for Energy

ISRAEL TO ATTACK IRAN?

Zero Hedge with a very disturbing article. This would fit nicely into the Fourth Turning storyline.

I really want to know SSS’ opinion about Robert Baer. Did he know him? Are his warnings credible? Is he just looking for publicity or is he trying to stop a terrible event from happening?

If Israel is foolish enough to start a war, oil prices will set records and destroy our economic house of cards.

CVN 77 G.H.W. Bush Enters Persian Gulf As CIA Veteran Robert Baer Predicts September Israel-Iran War

Tyler Durden's picture

Submitted by Tyler Durden on 07/17/2011 16:02 -0400

One look at the most recent naval update maps shows that in addition to global insolvency (courtesy of the broke European dominoes and a potentially technically broke US), a UK on the verge of a parliamentary scandal courtesy of a media baron whose empire is crumbling, and not to mention yet another downward inflection point in the global economic slowdown courtesy of the end of QE2 and no replacement yet, market watchers may have to start factoring in geopolitical risk yet again. While the fact that Syria, Yemen, Egypt, Tunisia, and now Turkey, are ever more increasingly on edge is apparently something Mr. Market has managed to internalize, when it comes to geopolitics everyone stops to listen when renewed Iran-Israel rumblings reappear. Which may just be the case. As the most recently updated naval map from Stratfor demonstrates, the CVN 77 G.H.W. Bush has just entered the Persian Gulf, the first time a US aircraft carrier has passed through the Straits of Hormuz in months. What is also notable is that the LHD 5 Bataan amphibious warfare ship has just weighed anchor right next to Libya: this is odd since the coast of Tripoli had been left unattended for many weeks by US attack ships. And topping it all off is that a third aircraft carrier, the CVN 73, is sailing west from the South China seas, potentially with a target next to CVN 76 Ronald Reagan which is the second carrier in the Straits of Hormuz area. Three carriers in proximity to Iran would be extremely troubling, yet fit perfectly with the story of CIA veteran Robert Baer, the man played by George Clooney in Syriana, who as Al Jazeera reports, appeared on KPFK Los Angeles, warning that Israeli PM Netanyahu is “likely to ignite a war with Iran in the very near future.” It gets worse: “Masters asked Baer why the US military is not mobilising to stop this war from happening. Baer responded that the military is opposed, as is former Secretary of Defense Robert Gates, who used his influence to thwart an Israeli attack during the Bush and Obama administrations. But he’s gone now and “there is a warning order inside the Pentagon” to prepare for war.” The punchline: “There is almost “near certainty” that Netanyahu is “planning an attack [on Iran] … and it will probably be in September before the vote on a Palestinian state. And he’s also hoping to draw the United States into the conflict“, Baer explained.” For the betting public out there, an September CL call may not be the dumbest trade possible…

First, the naval update per Stratfor:

And, courtesy of Al Jazeera and Haaretz, the full take from Robert Baer:

Earlier this week, Robert Baer appeared on the provocative KPFK Los Angeles show Background Briefing, hosted by Ian Masters. It was there that he predicted that Israeli Prime Minister Binyamin Netanyahu is likely to ignite a war with Iran in the very near future.

Robert Baer has had a storied career, including a stint in Iraq in the 1990s where he organised opposition to Saddam Hussein. (He was recalled after being accused of trying to organise Saddam’s assassination.) Upon his retirement, he received a top decoration for meritorious service.

Baer is no ordinary CIA operative. George Clooney won an Oscar for playing a character based on Baer in the film Syriana (Baer also wrote the book).

He obviously won’t name many of his sources in Israel, the United States, and elsewhere, but the few he has named are all Israeli security figures who have publically warned that Netanyahu and Defense Minister Ehud Barak are hell-bent on war.

Most former Mossad chiefs wary of Netanyahu

Baer was especially impressed by the unprecedented warning about Netanyahu’s plans by former Mossad chief Meir Dagan. Dagan left the Israeli intelligence agency in September 2010. Two months ago, he predicted that Israel would attack and said that doing so would be “the stupidest thing” he could imagine. According to Haaretz:

When asked about what would happen in the aftermath of an Israeli attack Dagan said that: “It will be followed by a war with Iran. It is the kind of thing where we know how it starts, but not how it will end.”

The Iranians have the capability to fire rockets at Israel for a period of months, and Hizbollah could fire tens of thousands of grad rockets and hundreds of long-range missiles, he said.

According to Ben Caspit of the Israeli daily Maariv, Dagan’s blasts at Israel’s political leadership are significant not only because Mossad chiefs, in office or retired, traditionally have kept their lips sealed, but also because Dagan is very conservative on security matters.

Caspit writes that Dagan is “one of the most rightwing militant people ever born here. … When this man says that the leadership has no vision and is irresponsible, we should stop sleeping soundly at night”.

Dagan describes the current Israeli government as “dangerous and irresponsible” and views speaking out against Netanyahu as his patriotic duty.

And his abhorrence of Netanyahu is not uncommon in the Israeli security establishment. According to Think Progress, citing the Forward newspaper, 12 of the 18 living ex-chiefs of Israel’s two security agencies (Mossad and Shin Bet), are “either actively opposing Netanyahu’s stances or have spoken out against them”. Of the remaining six, two are current ministers in Netanyahu government, leaving a grand total of four out of 18 who independently support the prime minister.

In short, while Congress dutifully gives Netanyahu 29 standing ovations, the Israelis who know the most about both Netanyahu and Israel’s strategic situation think he is a dangerous disaster.

But according to Baer, we ain’t seen nothing yet.

There is almost “near certainty” that Netanyahu is “planning an attack [on Iran] … and it will probably be in September before the vote on a Palestinian state. And he’s also hoping to draw the United States into the conflict”, Baer explained.

The Israeli air force would attack “Natanz and other nuclear facilities to degrade their capabilities. The Iranians will strike back where they can: Basra, Baghdad”, he said, and even Afghanistan. Then the United States would jump into the fight with attacks on Iranian targets. “Our special forces are already looking at Iranian targets in Iraq and across the border [in Iran] which we would strike. What we’re facing here is an escalation, rather than a planned out-and-out war. It’s a nightmare scenario. We don’t have enough troops in the Middle East to fight a war like that.” Baer added, “I think we are looking into the abyss”.

Another US war?

Masters asked Baer why the US military is not mobilising to stop this war from happening. Baer responded that the military is opposed, as is former Secretary of Defense Robert Gates, who used his influence to thwart an Israeli attack during the Bush and Obama administrations. But he’s gone now and “there is a warning order inside the Pentagon” to prepare for war.

It should be noted that the Iranian regime is quite capable of triggering a war with the United States through some combination of colossal stupidity and sheer hatred. In fact, as Baer explained, the Iranian Revolutionary Guard would welcome a war. They are “paranoid”. They are “worried about … what’s happening to their country economically, in terms of the oil embargo and other sanctions”. And they are worried about a population that increasingly despises the regime.

They need an external enemy. Because we are leaving Iraq, it’s Israel. But in order to make this threat believable, they would love an attack on their nuclear facilities, love to go to war in Bahrain and Saudi Arabia and Iraq and hit us where they could. Their defense is asymmetrical. We can take out all of their armored units. It’s of little difference to them, same with their surface-to-air missile sites. It would make little difference because they would use terrorism. They would do serious damage to our fleet in the Gulf.

Given all that, is it possible that the United States would allow Israel to attack when the president knows we would be forced to join the war on Israel’s side?

“The president is up for re-election next year,” Blair pointed out, and Israel is “truly out of control”.

What happens when you see 100 F-16’s approaching Iraq and there is a call to the White House [from Netanyahu] that says “We’re going in, we’re at war with Iran”? What does the President of the United States do? He has little influence over Bibi Netanyahu. … We can’t stop him. And he knows it.

It’s a pretty frightening scenario, made infinitely more so by the fact that top Israelis (who have heard Netanyahu’s thinking from Netanyahu himself) also see the future the same way. Those Israelis deserve a world of credit for sounding the warning bell loudly enough that we would hear it and do something about it – although it’s impossible to know if the people who matter are paying attention.

Actually, only one person matters: the US president. If Israel bombed Iran tomorrow, Congress would forget all about their partisan differences and run, not walk, to the House and Senate floors to endorse the attack and call for unstinting support for Israel. That is what Congress always does, and will always do so long as the lobby (and the donors it directs) are the key players in making our Middle East policies.

And who knows what Obama would do? So far, he has not exactly distinguished himself when it comes to standing up to Netanyahu.

But an Israeli attack on Iran would be different. It would endanger countless Americans (in the region and here at home, too). It would kill off any economic recovery by causing oil prices to skyrocket. It would engulf us in another Middle East war. And it would threaten the existence of the state of Israel.

This is something the president needs to focus on instead of being forced to nickel and dime with the likes of Representative Eric Cantor and Senator Mitch McConnell. How incredible that these two, and their right-wing allies, have our government tied in knots in their incessant effort to elevate themselves by destroying the President of the United States. It is sickening.

h/t devaang

OBAMA’S PISSING IN THE WIND

Zero Hedge http://www.zerohedge.com/ with an outstanding piece on the ridiculousness of Obama’s blatant attempt to manipulate the oil markets so his diminishing re-election chances are bolstered. As usual, this moron has no idea how markets work, or the law of unintended consequences. He is doing wonders for making the Fourth Turning as chaotic and desperate as possible. OPEC is now being led by Iran, not Saudi Arabia. The release of 60 million barrels of oil from strategic reserves will be as effective on keeping oil prices low as QE2 was in reviving our economy and spurring the housing market.

The second article is from www.oilslick.com and details the reasons for the Strategic Oil Reserve. Two thirds of the reserve is sour crude, which many of the refineries in the US can not process. We are depleting our reserve of sweet crude and sending it to Europe. Brilliant “strategic” move by Obama. I really think Obama approaches life like it is a game and he is smarter than everyone else. He is a dangerous man. Four more years of this guy will insure the destruction of our country.

As The IEA-OPEC Nash Equilibrium Collapses, Is A 1973-Style OPEC Embargo Next?

Tyler Durden's picture

Submitted by Tyler Durden on 06/26/2011 11:13 -0400

Last week’s dramatic decision by the US administration to strongarm the IEA into releasing strategic petroleum reserves (of which the US would account for 30 million barrels, or half of the total), is nothing but yet another example of the hobbled and incredibly short-sighted thinking that permeates every corner of the Obama administration. Because as the WSJ reports, “the move by the U.S. and its allies to release strategic reserves of oil could provide a much-needed shot in the arm for the U.S. economy, but risks inflicting lasting damage on the already tense relationship between oil producers and consumers.” The move comes on the heels of the dramatic collapse in OPEC talks in Vienna two weeks ago when Saudi Arabia was effectively kicked out of the cartel, further confirmed by reports that the IEA consulted with Saudi (and China and India) in advance of its decision (more later). Additionally, “OPEC and the European Union are due to hold an energy summit in Vienna Monday that will be the first official meeting of producers and consumers since the IEA’s move, and will provide a platform for OPEC members to express their disquiet over the stocks’ release. However, OPEC’s biggest player, Saudi Arabia, won’t be present.” Make that former player, in an organization now headed by the previously #2 producer, Iran (which just happens is not all that pro-US). The biggest threat, however, is that in direct retaliation against the IEA’s cartel-like decision, which comes at the expense of the remaining OPEC countries, is that as Zero Hedge suspected, the next step will be a more than proportionate cut in crude production by OPEC: “Some analysts speculated that OPEC could respond to the IEA release by cutting output to offset the increased supply.” What happens next is complete Nash equilibrium collapse, with a high possibility of a 1973-type OPEC oil embargo announcement in the immediate future.

“Going ahead with an increase would cut into revenue, said Christof Ruehl, chief economist of BP PLC. But cutting production to offset the release, he said, “would be seen as hostile by IEA members” and “could lead to a war of attrition, at least as expensive,” in which OPEC cuts production and the IEA keeps releasing stocks to make up for the shortage.” The winner of all this, is of course, China, which will gladly benefit from ongoing blue light specials courtesy of the US Strtategic Petroleum Reserve to build up its own reserve holdings, as the rest of the world squabbles over a US-dominated status quo whose time has now officially passed. And just as the rare earth metal price spike in recent weeks demonstrates what happens when China is the marginal anything in any supply chain, one can be certain that the price of Crude will be far, far higher several years from now.

And speaking of Iran, its oil ministry SHANA wasted no time in firing the retaliating round against the IEA’s decision, accusing the US of acting unilaterally and purely for the benefit of Obama’s reelection campaign, warning that the drop in oil prices won’t persist:

Iranian governor for OPEC Mohammad Ali Khtatibi says International Energy Agency (IEA) decision to draw oil from its emergency reserves implies intervention in the ordinary function of the oil market.

Speaking to Shana, Mr. Khatibi said that the trend of falling oil prices would not be sustainable.

‘Following the failure to bring down the prices at 159th ministerial meeting of OPEC in June 8, the United States of America and Europe are using all the means to push oil prices lower, Iranian governor for OPEC said.

Khatibi noted that IEA’s initiative to release oil from strategic petroleum reserves would followed by artificial falling of oil prices but those countries believing in open markets showed they are not genuine in their believes.

According to Khatibi recent days’ developments in oil market is not the result of issues relating to supply and demand or market needs but political pressures by the United States drives the initiative. 

The United States government plans to influence the results of the upcoming presidential elections of the country by putting pressure on oil prices’ top Iranian oil official said.

Khatibi pointed out that developed countries initiative to draw oil from strategic petroleum reserves is risky because they cannot continue the move in the long term.

He added: these reserves are being held for emergency situations so the consuming countries of the International Energy Agency will have no other choice except to replenish the reserves for further use. 

Indeed, if Obama’s reelection campaign is such an emergency that it requires tapping the SPR, what will happen when there is a real emergency: such as a repeat of the 1973 OPEC embargo, which set the stage for Volcker’s last minute and very painful intervention to prevent the US economy from tailspinning into an inflationary supernova?

And just to make sure things get even more polarized, Dow Jones reports that the “International Energy Agency consulted Saudi Arabia, China and India before it authorized the release of some of its emergency reserves, the agency’s executive director said Sunday.”

“They understand, and they appreciate the action,” Nobuo Tanaka said on the sidelines of the second Global Think Tank Summit in Beijing.

The release of some of IEA’s strategic stockpiles is meant only to fill the gap in supply until higher crude volumes from Saudi Arabia reach the global market, he added.

Oddly enough, the leadership at the IEA is just as clueless as that of the US:

Separately, Tanaka said he asked China once again to join the IEA on Saturday. Although there hasn’t been any official response, Tanaka said he was encouraged by China’s recent statement publicly welcoming the IEA’s strategic stockpiles release.

Of course they welcome it you idiot, because they will be buying everything your member countries have to sell, and thanks to your stupidity, at a welcome discount. And why the hell would China want to join the IEA when it gets all the benefits of participation, without any of the obligations of being a member (i.e., adhering to your retarded politically-motivated agenda).

Good luck buying it back at the same price when OPEC fires its own warning shot and announces it is reducing crude output for all remaining OPEC countries (ex. Saudi) by 10-15%. And yes, Goldman will promptly move it Brent sell recommendation to a buy, within hours of said announcement.

Strategic Petroleum Reserve

Jim Brown
Back before the OPEC meeting the Obama administration held talks with Saudi Arabia on swapping oil in the SPR for new oil Saudi would produce. This revelation shocked many traders and suggests the administration is unaware of the strategic reasons behind the SPR.The Strategic Petroleum Reserve (SPR) holds 727 million barrels of oil that is “reserved” for times when oil is not available on the open market due to war, hurricane, embargo, etc. The oil in the SPR is not there to be used to manipulate prices. It is a “strategic” reserve. Most presidents have forgotten what strategic means and have instead treated it like a “Political Petroleum Reserve.”

The SPR was created by President Ford in 1975 as an answer to the 1973-1974 oil embargo when Arab nations cut off supplies of oil to the USA. Although commissioned in 1975 with construction beginning in 1976 and the first shipment into the reserve in July 1977 it was not until Christmas Day 2009 that the SPR was finally filled to capacity. It took 32 YEARS to fill the reserve. Oil was purchased outright and also procured as a Royalty-in-Kind (RIK) from U.S. producers in lieu of royalty payments to the Federal government.

In 2005 Congress decided the events in the Middle East were suggesting future problems for imported oil and they authorized an expansion of the SPR to one billion barrels. However, despite a comprehensive plan to locate and prepare additional storage facilities there has been no actual construction to fulfill the authorization. The current administration is “reviewing” the plans and the reason behind the SPR.

It has been tapped in the past when national disasters like Katrina knocked out the Louisiana Offshore Oil Platform (LOOP) where oil imported from overseas is offloaded into pipelines for transport to refineries. I view that as a valid use since the amount of oil released is trivial and will be replaced as soon as practical after the disaster. Actually the refineries receiving the oil from the SPR have to replace it with oil within so many weeks after the disaster is over. There have been two major drawdowns from the SPR. Desert Storm saw a distribution of 17.3 million barrels when prices when world supplies dropped after Kuwait was invaded and Iraq production was degraded. The second major drawdown was after Katrina when 25% of our domestic production was halted. The DOE authorized a sale of 30 million barrels but only 11 million were actually purchased by refiners.

The current SPR inventory is 292.5 million barrels of light sweet crude and 434 million of heavy sour crude.

We found out last week that the current administration held talks with Saudi Arabia on taking light sweet crude, the kind in short supply, and shipping it to Europe and replacing it with heavy sour crude from Saudi Arabia.

Europe is facing a very tight situation today with the loss of 1.5 mbpd of light crude production from Libya. Since light crude supplies in general are what controls oil prices the shortage of sufficient light oil has pushed Brent prices well over $100. There is no shortage of heavy sour crude but there are fewer refineries that can process that crude and that makes heavy sour crude a lot cheaper on the world markets.

In the U.S. we have a mix of refineries with some capable of processing the cheaper oil and some only the light oil.

If we were to take out 1.5 mbpd of light sweet crude from the SPR and send it to Europe to replace the Libyan crude when would that program end? The IEA does not expect Libyan crude to be back at full production until 2015. Obviously at the rate of 1.5 mbpd (45 mb per month) we could not supply the missing oil for more than a few months.

By replacing that highly desirable light oil with less than desirable heavy oil we would be reducing the value of our strategic reserves. If this program continued for several months our flexibility in handling future real emergencies would be degraded. It took 32 years to fill the reserve and that period covered times of plenty and times of scarcity, economic boom and economic bust.

With the budget under extreme pressure and spending cut comments in every newscast should we really be depleting our strategic reserves so Europe can have cheaper gasoline and Saudi Arabia can sell more low quality oil without going through the OPEC quota program? I think not.

The SPR is a STRATEGIC reserve that lawmakers saw fit to construct and fill at the cost of billions of dollars. Politically several presidents have talked about releasing oil to reduce fuel prices in the USA but so far they have all been dissuaded from weakening the strategic value of the reserve.

Lawmakers should prevent presidents from making these kinds of political moves. When we actually need this oil we need it to be there. If Iran obtains a nuclear weapon there are two targets at the top of their hit list. The first is Israel although they may not follow through with that attack because of the tremendous retaliation Israel could inflict on Iran. The second target is their archenemy Saudi Arabia. If they could knock out Saudi’s major oil terminal they could inflict severe financial damage on Saudi and eliminate Saudi’s financial influence in the region. The loss of Saudi’s 10.0 mbpd of production would immediately send oil prices well over $200 a barrel and Iran’s oil would be worth triple what it is today. Of course they would still have the problem of selling it because global sanctions would be severe.

Al Qaeda has targeted the Saudi oil fields and production facilities for years but have so far been unable to mount an effective attack. If al Qaeda eventually manages to act on their aspirations the same significant drop in the worlds oil supply would appear.

Today’s Arab Spring uprising all over the Middle East and Northern Africa is another warning that oil supplies from that region could dry up in a matter of days given the right sequence of events. This is all the more reason we should not dwindle away our strategic resources.

Lastly, China is eventually going to be a serious thorn in our oil supply. Chinese generals have said China will be at war with the U.S. by the end of the decade over natural resources. China could cause the U.S. great harm by interdicting oil supplies from the Middle East. If they believe we don’t have the backbone to stand up to them in an armed conflict then they could take action to acquire more supplies and it would be our loss.

As we continue approaching the peak in oil production we are going to see news events increasing in frequency that will make our strategic reserves more strategic. The U.S. military already believes there will be shortages in 2012 and that shortage could grow to 10 million barrels per day by 2015.

U.S. Joint Operating Environment, Page 29

If our own military believes there will be shortages by 2012 and severe shortages by 2015 why would we want to send critical supplies of light crude to Europe in exchange for sour crude from Saudi Arabia?

The administration claims they have a plan “teed up” to use the SPR in the case of market shifts. Let’s hope that plan fails to leave the tee and calmer and less political heads prevail.

Jim Brown

This newsletter is only one of the newsletters produced by OilSlick each day. The investment newsletter is also produced daily and contains the current play recommendations in the energy sector. Stocks, options and futures are featured. If you are not receiving the “Play Newsletter” please visit the subscribe link below to register.

Subscribe to Energy Picks Newsletter

QE2 – THE BERNANKE CHRONICLES

Our self proclaimed “expert” on the Great Depression, Ben Bernanke, seems to be feeling the pressure. His theories worked so well when he modeled them in his posh corner office at Princeton. He could saunter down the hallway and get his buddy Krugman to confirm his belief that the Federal Reserve was just too darn restrictive between 1929 and 1932, resulting in the first Great Depression. I wonder if there will be a future Federal Reserve Chairman, 80 years from now, studying how the worst Federal Reserve Chairman in history (not an easy feat) created the Greatest Depression that finally put an end to the Great American Military Empire. Bernanke spent half of his speech earlier this week trying to convince himself and the rest of the world that his extremist monetary policy of keeping interest rates at 0% for the last two years, printing money at an astounding rate, and purposely trying to devalue the US currency, had absolutely nothing to do with the surge in oil and food prices in the last year. Based on his scribbling since November of last year, it seems that Ben is trying to win his own Nobel Prize – for fiction.

His argument was that simple supply and demand has accounted for all of the price increases that have spread revolution across the world. His argument centered around growth in emerging markets that have driven demand for oil and commodities higher, resulting in higher prices. As usual, a dollop of truth is overwhelmed by the Big Lie. Here is Bernanke’s outlook for inflation:

“Let me turn to the outlook for inflation. As you all know, over the past year, prices for many commodities have risen sharply, resulting in significantly higher consumer prices for gasoline and other energy products and, to a somewhat lesser extent, for food. Overall inflation measures reflect these price increases: For example, over the six months through April, the price index for personal consumption expenditures has risen at an annual rate of about 3.5%, compared with an average of less than 1% over the preceding two years. Although the recent increase in inflation is a concern, the appropriate diagnosis and policy response depend on whether the rise in inflation is likely to persist. So far at least, there is not much evidence that inflation is becoming broad-based or ingrained in our economy; indeed, increases in the price of a single product–gasoline–account for the bulk of the recent increase in consumer price inflation. An important implication is that if the prices of energy and other commodities stabilize in ranges near current levels, as futures markets and many forecasters predict, the upward impetus to overall price inflation will wane and the recent increase in inflation will prove transitory.”

So our Federal Reserve Chairman, with a supposedly Mensa level IQ, declares that prices have risen due to demand from emerging markets. He also declares that US economic growth will pick up in the 2nd half of this year. He then declares that inflation will only prove transitory as energy and food prices will stop rising. I know I’m not a Princeton economics professor, but if US demand increases due to a recovering economy, along with continued high demand in emerging markets, wouldn’t the demand curve for oil and commodities move to the right, resulting in even higher prices?


Ben Bernanke wants it both ways. He is trapped in a web of his own making and he will lie, obfuscate, hold press conferences, write editorials, seek interviews on 60 Minutes, and sacrifice the US dollar in order to prove that his economic theories are sound. They are not sound. They are reckless, crazy, and will eventually destroy the US economic system. You cannot solve a crisis caused by excessive debt by creating twice as much debt. The man must be judged by his words, actions and results.

November 4, 2010

With the U.S. economy faltering last summer, Ben Bernanke decided to launch a desperate attempt to re-inflate the stock market bubble. The S&P 500 had peaked at 1,217 in April 2010 and had fallen 16% by July. This was unacceptable to Bernanke’s chief clientele – Wall Street and the richest 1% in the country. At Jackson Hole in August he gave a wink and nod to his peeps, letting them know he had their backs. It was safe to gamble again. He’d ante up the $600 billion needed to revive Wall Street. It worked wonders. By April 2011, the S&P 500 had risen to 1,361, a 33% increase. Mission accomplished on a Bush-like scale.

Past Federal Reserve Chairmen have kept silent about their thoughts and plans. Not Bernanke. He writes editorials, appears regularly on 60 Minutes, and now holds press conferences. Does it seem like he is trying too hard trying to convince the public that he has not lost control of the situation? QE2 was officially launched on November 4, 2010 with his Op-Ed in the Washington Post. He described the situation, what he was going to do, and what he was going to accomplish. Let’s assess his success.

“The Federal Reserve’s objectives – its dual mandate, set by Congress – are to promote a high level of employment and low, stable inflation. Unfortunately, the job market remains quite weak; the national unemployment rate is nearly 10 percent, a large number of people can find only part-time work, and a substantial fraction of the unemployed have been out of work six months or longer. The heavy costs of unemployment include intense strains on family finances, more foreclosures and the loss of job skills.” – Ben Bernanke – Washington Post Editorial – November 4, 2010

Ben understands his dual mandate of high employment and low inflation, but he seems to have a little trouble accomplishing it. Things were so much easier at Princeton. Since August 2010 when Ben let Wall Street know he was coming to the rescue, the working age population has gone up by 991,000, while the number of employed Americans has risen by 401,000, and another 1,422,000 people decided to kick back and leave the workforce. That is only $1.5 million per job created. This should get him a spot in the Keynesian Hall of Shame.

The official unemployment rate is rising after Ben has spent $600 billion and stands at 9.1% today. A true measurement of unemployment as provided by John Williams reveals a true rate of 22%.

Any reasonable assessment of Ben’s success regarding part one of his dual mandate, would conclude that he has failed miserably. He must have focused his attention on mandate number two – low inflation. Bernanke likes to call inflation transitory. Inflationistas like Bernanke will always call inflation transitory. His latest proclamations reference year over year inflation of 3.5%. This is disingenuous as the true measurement should be since he implemented QE2. The official annualized inflation since December 2010 is 5.3%. The real inflation rate as calculated exactly as it was in 1980 now exceeds 10%.


Mr. Dual Mandate seems to have slipped up. As he stated in his editorial, he wanted to fend off that dreaded deflation:  

“Today, most measures of underlying inflation are running somewhat below 2 percent, or a bit lower than the rate most Fed policymakers see as being most consistent with healthy economic growth in the long run. Although low inflation is generally good, inflation that is too low can pose risks to the economy – especially when the economy is struggling. In the most extreme case, very low inflation can morph into deflation (falling prices and wages), which can contribute to long periods of economic stagnation.”

He certainly has succeeded in fighting off deflation. Let’s list his anti-deflation accomplishments:

  • Oil prices have risen 35% since September 2010.
  • Unleaded gas has risen 50% since September 2010.
  • Gold has risen 24% since September 2010.
  • Silver has risen 85% since September 2010.
  • Copper has risen 20% since September 2010.
  • Corn has risen 67% since September 2010.
  • Soybeans have risen 40% since September 2010.
  • Coffee has risen by 44% since September 2010.
  • Cotton has risen 88% since September 2010.

Amazing how supply and demand got out of balance at the exact moment that Bernanke unleashed a tsunami of speculation by giving the all clear to Wall Street, handing them $20 billion per week for the last seven months. Another coincidence seemed to strike across the Middle East where the poor, who spend more than 50% of their meager income on food, began to revolt as Bernanke’s master plan to enrich Wall Street destroyed the lives of millions around the globe. Revolutions in Tunisia, Egypt, Libya, Yemen, Bahrain, and Syria were spurred by economic distress among the masses. Here in the U.S., Bernanke has only thrown savers and senior citizens under the bus with his zero interest rate policy and dollar destruction.

Bernanke’s Virtuous Circle

“This approach eased financial conditions in the past and, so far, looks to be effective again. Stock prices rose and long-term interest rates fell when investors began to anticipate the most recent action. Easier financial conditions will promote economic growth. For example, lower mortgage rates will make housing more affordable and allow more homeowners to refinance. Lower corporate bond rates will encourage investment. And higher stock prices will boost consumer wealth and help increase confidence, which can also spur spending. Increased spending will lead to higher incomes and profits that, in a virtuous circle, will further support economic expansion.”  Ben Bernanke – Washington Post Editorial – November 4, 2010

Ben Bernanke could not have been any clearer in his true purpose for QE2. He wanted to create a stock market rally which would convince the public the economy had recovered. As suckers poured back into the market, the wealth effect would convince people to spend money they didn’t have, again. This is considered a virtuous cycle to bankers. He declared that buying $600 billion of Treasuries would drive down long-term interest rates and revive the housing market. His unspoken goal was to drive the value of the dollar lower, thereby enriching the multinational conglomerates like GE, who had shipped good US jobs overseas for the last two decades. Bernanke succeeded in driving the dollar 15% lower since last July. Corporate profits soared and Wall Street cheered. Here is a picture of Bernanke’s virtuous cycle:

Chart forTiffany & Co. (TIF)

Whenever a talking head in Washington DC spouts off about a new policy or program, I always try to figure out who benefits in order to judge their true motives. Since August 2010, the stock price of the high end retailer Tiffany & Company has gone up 88% as its profits in the last six months exceeded its annual income from the prior two years. Over this same time frame, 2.2 million more Americans were forced into the Food Stamp program, bringing the total to a record 44.6 million people, or 14.4% of the population. But don’t fret, Wall Street paid out $21 billion in bonuses to themselves for a job well done. This has done wonders for real estate values in NYC and the Hamptons. See – a virtuous cycle.

Do you think Bernanke mingles with Joe Sixpack on the weekends at the cocktail parties in DC? Considering that 90% of the US population owns virtually no stocks, Bernanke’s virtuous cycle only applied to his friends and benefactors on Wall Street.

stock-markets

But surely his promise of lower interest rates and higher home prices benefitted the masses. The largest asset for the vast majority of Americans is their home. Let’s examine the success of this part of his master plan. Ten year Treasury rates bottomed at 2.4% in October 2010, just prior to the launching of QE2. Rates then rose steadily to 3.7% by February 2011. I’m not a Princeton professor, but I think rising rates are not normally good for the housing market. Today, rates sit at 2.9%, higher than they were prior to the launch of QE2.

One-Year Chart for US Generic Govt 10 Year Yield (USGG10YR:IND)

I’m sure Ben would argue that interest rates rose because the economy is recovering and the virtuous cycle is lifting all boats (or at least the yachts on Long Island Sound). Surely, housing must be booming again. Well, it appears that since Ben fired up his helicopters in November, national home prices have fallen 5% and are accelerating downward at an annual rate of 10%. There are 10.9 million home occupiers underwater on their mortgage, or 22.7% of all homes with a mortgage. There are over 6 million homeowners either delinquent on their mortgage or already in the foreclosure process. It certainly looks like another Bernanke success story.

Bernanke’s conclusion at the end of his Op-Ed in November 2010 was that his critics were wrong and his expertise regarding the Great Depression trumped rational economic theory. By enriching Wall Street and creating inflation, his virtuous cycle theory would lead to job creation and a chicken in every pot.

“Although asset purchases are relatively unfamiliar as a tool of monetary policy, some concerns about this approach are overstated. Critics have, for example, worried that it will lead to excessive increases in the money supply and ultimately to significant increases in inflation. But the Federal Reserve has a particular obligation to help promote increased employment and sustain price stability. Steps taken this week should help us fulfill that obligation.” Ben Bernanke – Washington Post Editorial – November 4, 2010

Anyone impartially assessing the success of QE2 would have to conclude that it has been an unmitigated failure and has put the country on the road to perdition. In three weeks, the Federal Reserve will stop pumping heroin into the veins of Wall Street. The markets are already reacting negatively, as the S&P 500 has fallen 6% and interest rates have begun to fall. As soon as Bernanke takes his foot off the accelerator, the US economy stalls out because we never cleaned the gunk (debt) out of the fuel line. Jesse puts it as simply as possible.

“The Banks must be restrained, and the financial system reformed, with balance restored to the economy, before there can be any sustained recovery.” – http://jessescrossroadscafe.blogspot.com/

Bernanke and his Wall Street masters want to obscure the truth so they don’t have to accept the consequences of their actions. The economy and the markets will decline over the summer. Bernanke is a one trick pony. His solution will be QE3, but it will be marketed as something different. He will appear on 60 Minutes and write another Op-Ed. Ben Bernanke will go down in history as the Federal Reserve Chairman that brought about the Greatest Depression and hammered the final nails into the coffin of the Great American Empire.

WOULD YOU LIKE A LITTLE OIL WITH THAT VINEGAR?

Another great article on Peak Oil from Gail the Actuary on  http://www.theoildrum.com/. If her assessment of oil production between now and 2021 is even close to accurate, we’re in a world of hurt. Impartial articles like this one should convince the most delusional peak oil denier that their drill,drill, drill mantra is nothing but hot air. I hadn’t seen the figure she stated as being the current cost for a barrel of oil to be produced in the Middle East as $95. That would appear to put a floor on the price of oil at a level above $95.

The good news is that our oil consumption will decline as soon as the price gets high enough to push our country back into recession. We are just about there. So, oil prices will decline again, but the low price this time will be much higher than the last low. This is the bumpy plateau. Supply and demand sure is a bitch. Expect some more humanitarian invasions of Middle East countries sitting on top of our oil.

My little peak oil widget just passed the 10 billion barrels consumed level for the year so far. I wonder if we discovered 10 billion new barrels during this same time frame.

Peak Oil – April 2011 Update

Posted by Gail the Actuary on May 2, 2011 – 1:27pm
The US Energy Information Administration’s January oil production figures are out, and they show record oil production. Where are we headed from here?


Figure 1. World “Liquids” Production through January 2011, based on Energy Information Administration data. 

While production for January is up a bit (219,000 barrels compared to December), the monthly numbers bounce around a fair amount because of planned maintenance. They are also subject to revision. Figure 2 seems to indicate that the production amounts are trending upward a bit, probably in response to the recent higher prices. 


Figure 2. Monthly average Brent Oil price and total “liquids” produced, both from US Energy Information Administration. 

The amounts in Figures 1 and 2 are not entirely up to date, since they are only through January 31, 2011. All of the disruption in the Middle East started at the very end of January, and the disruption in Libya’s supplies did not start until February.  The earthquake in Japan took place March 11. OPEC estimates that OPEC and world oil supply fell in both February and March, with Libya’s production falling by 1.2 million barrels a day between January and March, with only small supply increases elsewhere offsetting this. World oil prices continue to be high. At this writing, West Texas Intermediate is about $111.50 a barrel; Brent is about $122. 

So what do we expect going forward? 

Eventual Decline, but not Following a Hubbert Curve 

It seems to me that the story about what happens in the future with oil supply is much more complex than what depletion and new supply alone would suggest. As I explained in a previous post (Our Finite World version and Oil Drum version), the actual downslope is likely to be steeper than what a Hubbert Curve would suggest, because economies of many importing countries are likely to be adversely affected by rising oil prices, and because demand (and tax collections) are likely to be low in countries that lose jobs to countries that use oil more sparingly. 

Hubbert assumed that nuclear or some other cheap alternative form of energy would allow business to go on pretty much as usual without oil. We know now that we are close to the downslope, but no inexpensive alternative has been developed in quantity. Because of this, actual production is likely to be less than the amount that is theoretically possible. This happens because of indirect impacts of inadequate oil supply, such as recession when prices oil prices rise; riots when food is in short supply; and inadequate demand for oil because of jobs move overseas to countries using less oil, leaving many unemployed. 

In some sense, if oil prices could rise indefinitely, we would never have a peak oil problem. The high prices would either stimulate production of alternative types of energy or would enable oil production in areas where oil is very costly to extract. The indirect impacts mentioned above prevent oil prices from rising indefinitely.  These indirect impacts seem to be related to inadequate net energy for society as a whole. Theoretically, if oil prices could rise indefinitely, we could even end up using more energy to extract a barrel of oil than really is in the barrel of oil in the first place–something that is hardly possible. The fact that rising oil prices lead to impacts that tend to cut back demand seems to be a way of keeping prices in line with the energy the oil actually provides. 

Which countries are able to buy the oil that is produced? 

If we look at oil consumption by area, we find the following: 


Figure 3. Oil consumption by area, based on EIA data. 

It is clear from Figure 3 that consumption of my grouping called “Europe, US, Japan, and Australia) is much flatter (and recently declining) than that of the “Remainder.” The Remainder includes oil exporting nations, plus China and India and other “lesser developed” countries, many of which are growing more rapidly than countries like Europe, US, Japan, and Australia. 

I have plotted the same data shown in Figure 3 as a line graph in Figure 4. The latter figure shows even more clearly how different the oil use growth rates have been. 


Figure 4. Data from Figure 3, graphed as a line graph, instead of a stacked area chart. 

If world oil supply is close to flat (shown in Figures 1, 2, and 3), Figure 4 shows that we have a potential for a real conflict going forward. The “Remainder” countries in Figure 4 will want to continue to increase their oil usage in future years, even if oil supply remains flat. This is likely to lead to considerable competition for available oil and high prices, such as we are seeing now. About the only way the “Remainder” countries can increase their oil usage is if oil usage by the “Europe, US, Japan, and Australia” group declines. 

Many people believe that the only alternative to adequate oil supply is for the amount of oil produced by oil companies to fall and because of this, for shortages to result. While this scenario is possible, especially in the presence of price controls, in this post we show another way that oil consumption can be limited. 

A very common way that oil usage (consumption) can be expected to decline is if high oil prices induce a recession. The countries that seem to be most susceptible to recession are countries that are (1) oil importers and (2) are heavy users of oil, since an increase in oil price has the most adverse impact on the financial health of these countries. When recession is induced, there are layoffs. These layoffs reduce oil usage in two ways: (1) less oil is used for making and transporting products that these workers would have made, and (2) the laid off workers are less able to afford products using oil, so reduce their purchase of oil products. 

Because of this relationship, competition for oil is likely to be very closely related to competition for jobs in the future. The countries that get the jobs can be expected to get a disproportionate share of oil that is available. 


Figure 5. Per Capita Energy Consumption, based on EIA data. 

If we look at per capita oil consumption (Figure 5) on a world basis, it has been close to flat since 1985, because oil production until very recently rose enough that oil growth more or less corresponded to population growth. China and India’s per capita oil consumption rose, meaning that the oil consumption of someone somewhere, such as the Former Soviet Union, needed to decline. 

Future Oil Supply 

If we look at historical oil production (Figure 6), it has been fairly “bumpy”: 


Figure 6. World oil production for crude, condensate and natural gas liquids. 1965-2009 from BP; 2010 from EIA. 

By fitting trend lines, we can see where oil production seems to be headed: 


Figure 7. World oil production from Figure 6, with fitted exponential growth trend lines. 

What we can see from Figure 7 is that the growth rate of world oil supply has gradually been slowing. The growth rate was highest in the 1965 to 1973 period, at 7.9% per year. Then we hit the “oops” period of 1973 to 1975, when we ran into conflict with OPEC regarding oil supplies. The trend rate dropped to 3.9% in the 1975 to 1979 period. Between 1979 and 1983, oil consumption dropped to a -3.9% per year, when we picked some of the low hanging fruit regarding oil usage (mostly by eliminating petroleum from electricity generation and downsizing automobiles). The trend between 1983 and 2004 shifted to +1.5% per year, and since 2004, seems to be about +0.2%. 

There are so many countries involved, that it is not easy to identify one country or area that is rising, but one country of note is Iraq. Its production in January, 2011, seems to be up by 300,000 barrels per day, relative to mid-2010, based on the latest data. Thus Iraq seems, for now, to be helping to keep world oil production flat, or even growing by a bit, despite increasing depletion elsewhere. 

Looking at Figure 7,  it looks like the “trend” in trend rates over time is down. In the absence of other information, we would expect production to remain at its recent trend rate of 0.2%, or alternatively, the trend rate could take another step downward, probably to an absolute decline in oil production. A recent announcement from Saudi Arabia suggests that its ability to offset declines elsewhere in the future is likely to be virtually nil, so a continued decline in production from the North Sea and elsewhere will need to be made up with new production elsewhere, or will lead to a worldwide decline in oil production. 

World population has been growing. If oil production remains flat or declines, and world population grows,  this means that someone has to be a loser, in terms of per capita consumption. I am not certain how this will turn out, but I see at least three forces that may come into play: 

1. Countries may figure out that permitting jobs to move to less developed countries is not in their best interests, and start increasing protectionism. This will tend to keep demand more level (higher for importers, and lower for growing economies). The overall impact on oil demand is less clear–less oil will be needed for long-distance transport, but more oil will be needed to maintain current lifestyles of workers. 

2. Countries that are in financial difficulty may find themselves increasingly shunned, as they seek to “restructure” their debt, and may find themselves increasingly cut off from buying oil products and the goods that that are made using oil products. This will tend to reduce aggregate world demand for oil, by reducing consumption in specific countries that have financial difficulty. 

3. There may be recession affecting a number of countries, reducing their demand for oil. We don’t know how exactly that this will change the shape of the world oil production curve, but Figure 8 shows my very rough guess as to how supply might be affected. (Your view may differ.) 


Figure 8. Historical crude, condensate, and NGL production based on BP and EIA data, plus a Guesstimate of Future Oil Supply. 

It seems to me that as we go forward, we are likely to see a jagged pattern in oil production decline, reflecting a combination of less demand for high-priced oil as oil supplies continue to be very tight, except at high prices. In addition, some countries can be expected to increasingly drop out of competition for oil, as their financial situations deteriorate. Thus, the pattern for decline in oil consumption can be expected to vary significantly from country to country, depending on their policies and their financial conditions. 

Clues as to Which Countries May Drop Out First 

If we look at the per-capita consumption of the PIIGS countries, we see that for the most part, these were countries that increased their consumption of oil, and then were not able to maintain the increase. 


Figure 9. Per capita oil consumption of PIIGS countries, based on EIA data. 

The difference is quite striking when we compare per-capita oil consumption to a few of the non-PIIGS European countries. 


Figure 10. Per capita oil consumption of selected European “non-PIIGS,” based on EIA data. 

Why is there such a different pattern between the PIIGS and the non-PIIGS? I haven’t researched the situation extensively, but it would seem as though the PIIGS countries tended to be agricultural countries that tried to develop more diversified (oil intensive) economies. They expanded and incurred a lot of debt, and now this debt is becoming difficult to pay back. As far as I can see, this economic growth was not based on the growth of stable, fairly cheap supply of electricity, such as hydro-electric or coal. Instead, growth depended fairly heavily on oil use, and the cost of oil rose. It may be that part of this growth in oil use occurred because of an improvement in standard of living–more cars, more vacations, bigger homes. 

My working hypothesis is that when oil prices went up, the economies of the PIIGS countries had too much debt for the new industries to provide enough revenue to service both the higher costs of oil and the debt costs. Countries which didn’t try to grow in this way didn’t have as much difficulty, although high oil prices are still a burden for them. They may eventually run into debt problems, just a little later. 

What are China and India and some of the other countries that are growing rapidly doing differently, that their economies haven’t collapsed? One thing they have going for them is the fact that their oil usage is at a vastly lower level, even after rapid growth. Another thing that they often have going for them is growing electricity production, using an energy source that is relatively cheap. In the case of China and India, this is mostly coal; in the case of some of the other lesser developed countries, it is hydro-electric. 

It seems as though at some price, each country will hit recessionary pressures and drop back in its demand for oil. This price will vary by country, depending on the country’s current debt situation, the extent to which the country can continue to “grow” its economy based on a growing source of cheap electricity, and how well international trade holds up with increased protectionism and higher oil prices. Countries depending on growing hydroelectric and coal-fired electricity are likely to hit limits, too, as these supplies reach natural limits. 

One situation which may affect how long oil prices can stay high for the United States is the existence of QE2, or “Quantitative Easing 2.” This seems to keep the dollar low relative to other currencies, thus allowing commodities prices to remain high. QE2 is scheduled to end June 30, or earlier. If it is allowed to expire, it would seem as though interest rates could rise materially (because QE2 also keeps interest rates low), and could lead to a rapid deterioration in the financial condition of the United States. If this should happen, it would seem as though the United States could be one of the countries that enters recession and significantly decreases its demand for oil. Of course, high oil price by itself may lead to this outcome quite soon, also. 

We cannot know how all of these forces will play out. Generally, I would expect that there will continue to be an upward push on the price for oil because of rising extraction costs, and because unrest in the Middle East is causing countries to provide additional benefits for their citizens, further raising their costs (estimated to be $95 barrel by the Wall Street Journal). As long as the world economy is expanding, rising demand will also tend to pull oil prices upward, because many countries are trying to compete for a supply of oil that is barely growing. 

The various countries around the world can be expected to be in differing positions with respect to their ability to pay high oil prices. Gradually (or not so gradually), the weakest ones will be pushed away from buying oil, either because of debt defaults and shunning by exporters (unless they have goods to trade in return), or because of recession, or both. World oil production seems likely to decline as the number of countries that can afford to continue to purchase high-priced oil declines. Ultimately, oil consumption can be expected to drop to close to 0, because no country will be able to afford to buy very much oil at a high price, and because oil companies will not be able to maintain necessary infrastructure for a very limited supply of oil. 

I don’t think that we can expect an analysis of the theoretical capacity of future world oil production to tell very much of the peak oil story. We really don’t know how much of the oil which seems to be available will actually be produced. A lot of the story will depend on the ability of individual countries to keep their economies in good enough shape that they can afford to buy high-priced oil. Many residents of countries that are shut out from oil supply are likely to find that oil products are not available at any price. 

Originally published on Our Finite World.


ENERGY RETURN ON ENERGY INVESTED (EROEI)

Yesterday the Chief Propagandist of the country, Barrack Hussein Obama, provided Americans with an example of his wisdom and long-term thinking. He declared that he would unleash his rabid dogs at the Department of Justice to root out the oil speculators responsible for the increase in gas prices. Funny how he hasn’t unleashed these rabid dogs on criminal Wall Street banks. His blustering and misinformation campaign will further destroy any chance of steering this ship away from the iceberg that is peak oil. He will convince the ignorant masses that the reason oil continues to rise in price is because of BIG OIL and the dreaded SPECULATORS. Maybe he should unleash his rabid dogs on the Federal Reserve Building. Ben Bernanke is responsible for $20 of the increase.

If you want a real discussion and analysis of why prices are rising and will continue to rise over the long term, you need to go to websites that actually use facts and where people think. There is no better site than  http://www.theoildrum.com/ for solid data and facts about peak oil.

Below is an article that addresses why we are in deep deep shit when it comes to oil. Once it requires you to expend more energy than you acquire from obtaining a new energy resource, the gig is up. To put it bluntly: when it takes 1.1 barrels of oil to obtain 1.0 barrels of oil, then we’re fucked. That is the dilemma of the developed world. As this article points out, it will be far worse for the U.S. than China or India because we have a vast infrastructure to maintain.

I find it fascinating that M. King Hubbert, who predicted peak oil, was actually very optimistic about the world shifting from oil to nuclear in time to keep the world growing. Sadly, he overestimated the intelligence of politicians and the American people. We haven’t built a nuclear power plant since the 1970s and now we are going to pay a high price. The recent disaster in Japan means that the American public will not support any major effort to replace oil with nuclear.

Obama and the fools in Congress can bluster and lie and hold hearings until they are blue in the face. It is just a show. The world supply of oil has peaked. We are now on the downward slope. Take a look at the consumption charts for China and India. Anyone who doesn’t think there will be a war for oil in the near future just isn’t thinking. 

Will the decline in world oil supply be fast or slow?

Posted by Gail the Actuary on April 18, 2011 – 11:15am
Topic: Demand/Consumption
Tags: hubbert’s curve, peak oil [list all tags

An Oil Drum reader wrote, asking the following question: 

Dear Oil Drum Editors, 

I have been reading quite a bit about peak oil recently. I get the impression (not based on data) that at some point there will be a quite steep decline in oil production/supply, and therefore we will see dramatic changes in how the world runs. However, when I look at oil depletion rates and oil production declines based on the Hubbert Curve, it seems to suggest a rather smooth decline. How is that some people expect a serious energy crunch in about two or three years, then? 

Many thanks! –Curious Reader 

Below the fold is my answer to him. 

Dear Curious, 

It seems to me that 

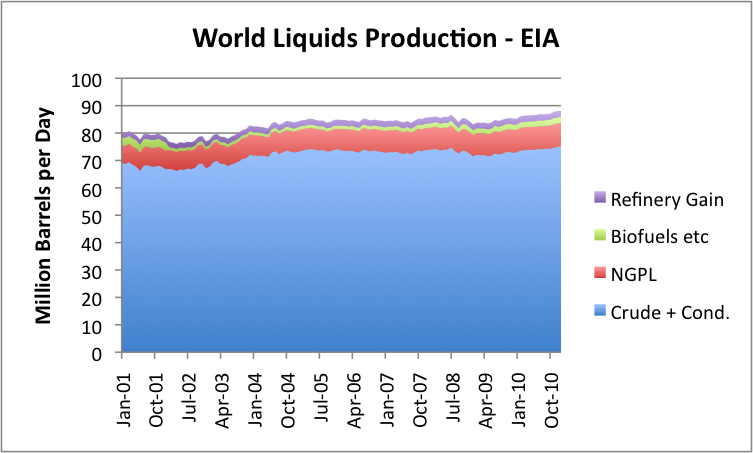
(1) A slow decline assumes that the only issue is geological decline in oil supply, and the economy and everything else can go on as usual. Technological advances and switches to alternatives might also be expected to help keep supply up. 

(2) A fast decline can be expected if one or more adverse factors make oil supply decline faster than geological factors would suggest. These might include: 

(a) Liebig’s Law of the Minimum – some necessary element for production, such as political stability, or adequate food for the population, or adequate financial stability, is missing or 

(b) Declining Energy Return on Energy Invested (EROEI) interferes with the functioning of society, so the society generates too little net energy, and economic problems ensue, or 

(c) Oil becomes so high priced that there is little demand for it. This would quite likely be related to declining EROEI. 

My view is that some version of the faster decline scenario is likely, because we will hit limits that interfere with oil production or oil demand. 

Let me explain my reasoning. 

Declining EROEI 

EROEI means Energy Returned on Energy Invested. It can be defined as the ratio of the amount of usable energy acquired from a particular energy resource to the amount of energy expended to obtain that energy resource. Wikipedia says,

When the EROEI of a resource is equal to or lower than 1, that energy source becomes an “energy sink”, and can no longer be used as a primary source of energy.


The situation is really worse than Wikipedia suggests. An economy needs a certain level of energy just to keep its infrastructure (roads, bridges, schools, medical system, etc.) repaired and working, and citizens educated. So energy resources, to really be useful, need an EROEI significantly higher than 1 to maintain the system at its current level of functioning. 

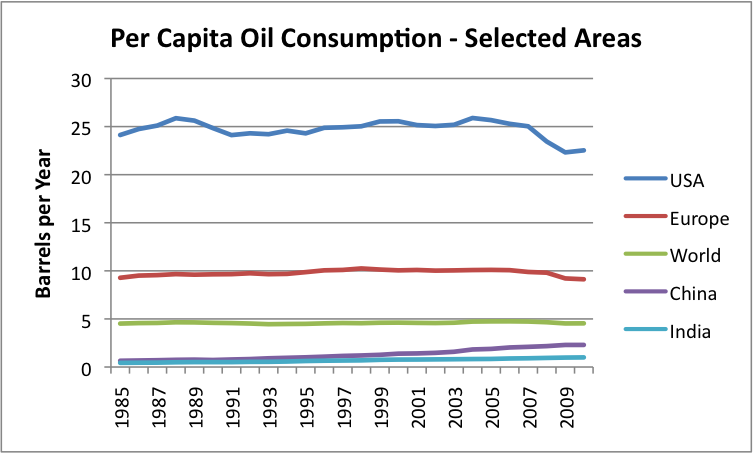
How much higher than 1.0 the EROEI needs to be on average will depend on the economy. An economy such as that of China, with relatively fewer paved roads and less expensive schools and healthcare system can probably get along with a much average lower EROEI (perhaps 4.0?) than an economy like the United States (perhaps 8.0), because of lesser infrastructure demands. 

If the average EROEI available to society is falling because oil is becoming more and more difficult to extract, an economy with a high standard of living such as the US would seem likely to be affected before an economy with a lower standard of living, such as China or India or Bangladesh, because of the higher EROEI needs of the more extensive infrastructure. Ultimately, though, the world is one economy, so problems in one country are likely to affect the economies of other countries as well. 

There a couple of issues related to declining EROEI: 

1. High cost to extract. Sources of oil or natural gas or coal that are difficult (high cost) to extract tend to be lower in EROEI than sources that are low cost to extract. So high cost of extraction tends to be a marker for low EROEI. We are increasingly running into this issue, for both oil and natural gas. 

2. Declining Net Energy. EROEI is closely related to “Net Energy,” which is the amount of usable energy that is left after deducting the energy that it takes to make energy. When net energy decreases, we have less energy to run society, making it difficult to do things like maintain bridges and roads, and fund schools. 

So high cost of oil extraction, low net energy, and low EROEI are all very closely related. 

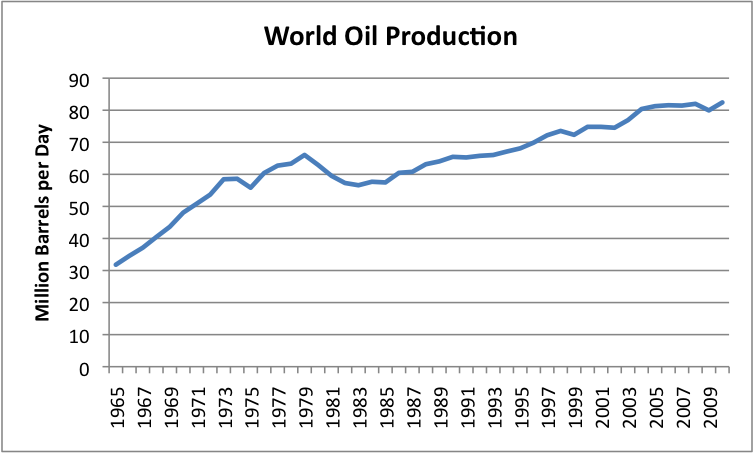
What did M. King Hubbert Say? 

M. King Hubbert in various papers such as these (1956, 1962, 1976) talked about a world in which other fuels took over, long before fossil fuels encountered problems with short supply. 


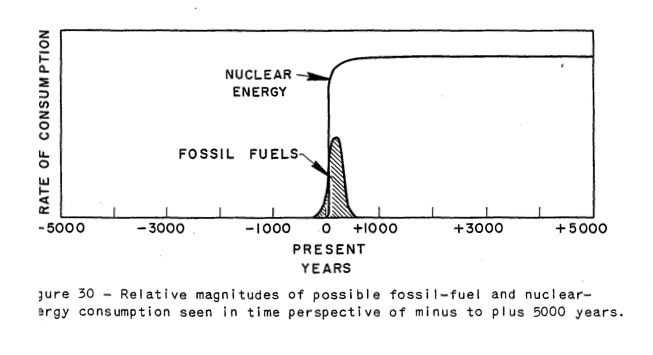
Figure 1. Image from Hubbert’s 1956 paper, Nuclear Energy and the Fossil Fuels 

In such a world, there would be plenty of net energy from alternative fuels to run society. Because of this, even if fossil fuels ran low, it would be easy to maintain the economy’s infrastructure, without disruption. In Hubbert’s 1962 paper, Energy Resources – A Report to the Committee on Natural Resources, Hubbert writes about the possibility of having so much cheap energy that it would be possible to essentially reverse combustion–combine lots of energy, plus carbon dioxide and water, to produce new types of fuel plus water. If we could do this, we could solve many of the world’s problems–fix our high CO2 levels, produce lots of fuel for our current vehicles, and even desalinate water, without fossil fuels. 

He also showed this figure in his 1956 paper: 


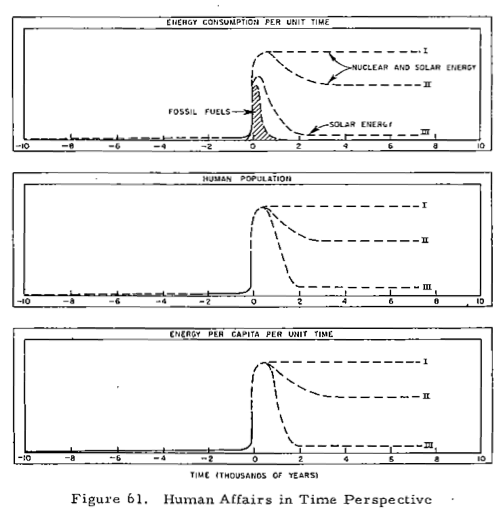
Figure 2. Image from Hubbert’s 1956 paper, Nuclear Energy and the Fossil Fuels 

In this figure, most of the additional energy comes from nuclear energy, while a smaller amount comes from “solar” energy. By solar energy, Hubbert would seem to mean solar, wind, tidal, wood, biofuels, and other energy we get on a day-to-day basis, indirectly from the sun. His figure seems to suggest that solar energy would basically act as a fossil fuel extender, and would not last beyond the time fossil fuels last. The primary long-term source of energy would be nuclear. 


Figure 3. Hubbert’s application of his curve to world oil supply, from his 1956 paper. 

In such a world, applying Hubbert’s Curve to world oil supply would make perfect sense, because there would be plenty of other energy, to provide the energy needed to keep up the infrastructure needed to main extraction of oil, gas, and other fuels as long as they were available. Even liquid fuels and pollution wouldn’t be a problem, if they could be manufactured synthetically. The carrying capacity of the world for food would eventually be a factor, but in one scenario in his 1976 paper, he shows the possibility of world population eventually reaching 15 billion people, thanks to the availability of other fuels. 

Another Approach to Forecasting Future Oil Supply: Limits to Growth Type Modeling 

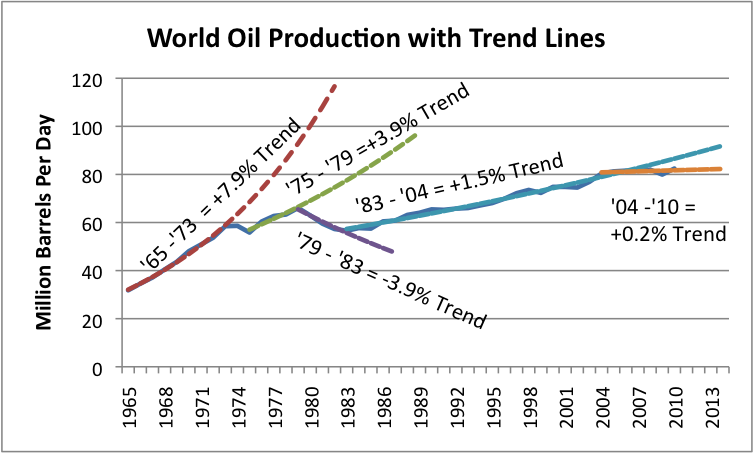
Another approach estimating the shape of the decline curve is by applying modeling techniques, such as used in the 1972 book Limits to Growth by Donella Meadows et al. The factors considered in this model were population, food per capita, industrial output, pollution, and resources. Resources were modeled in total, not oil separately from other types of resources. There were 24 scenarios run. The base scenario suggested that the world would start hitting resource limits about now (plus or minus 10 or 20 years). There have been several analyses regarding how this model is faring, and the conclusion seems to be that it is more or less on track. This is a link to such an analysis by Charles Hall and John Day. 

With this type of model, according to Limits to Growth (p. 142), “The basic mode of the world system is exponential growth of population and capital, followed by collapse.” This type of decline would seem to be substantially faster than the decline predicted by the Hubbert Curve. 

One thing I notice about the Limits to Growth model is that it leaves out our debt-based financial system. Since so much capital is borrowed in today’s world, it seems like including such a variable would tend to make the system even more “brittle”, and perhaps move up the date when collapse occurs. 

Also, the Limits to Growth model is for the world as a whole, rather than for different parts of the world. Different areas of the world can be expected to be affected differently, as oil gets in shorter supply. The effect of this would seem to be to push economies which have a higher need for oil (illustrated above with my estimate that the US requires a EROEI of 8.0 on energy resources) down toward economies that use smaller amounts of oil (illustrated by my rough guess that perhaps China could get by with an EROEI of 4.0), especially if they trade with each other. I explain how I see this happening in a later section of this post. 

Demand for Oil (or other Fossil Fuels) 

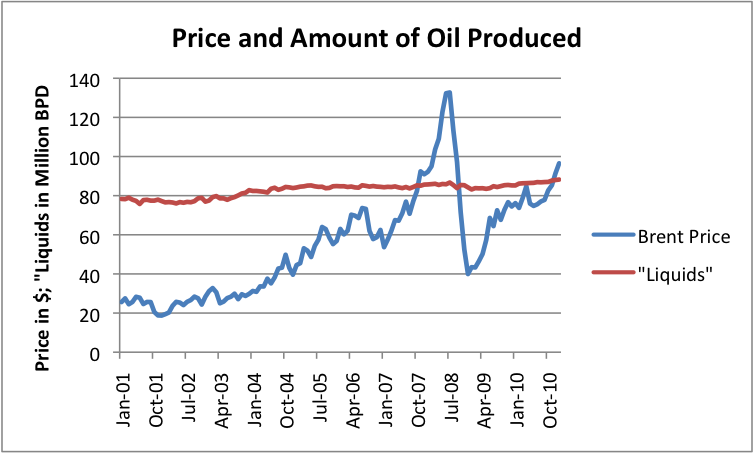
Even if there is plenty of high-priced oil extracted from the ground, if potential buyers cannot afford it, there can be a problem, leading to a decline in oil production. Demand can be thought of as the willingness and ability to purchase oil products. Many people would like to have gasoline for their cars, but if they are unemployed, or have a part-time minimum wage job, they are likely not to have enough money to buy very much. 

Over the long term, declining demand can be expected because of declining EROEI, as illustrated by Prof. Charles Hall’s “Cheese Slicer” model.

Figure 4. Professor Charles Hall’s cheese slicer model of the economy, reflecting the energy needed to make energy, and other aspects of the economy at 1970 


Figure 5. Professor Charles Hall’s cheese slicer model of the economy, reflecting the energy needed to make energy, and other aspects of the economy at 2030 

Declining demand, and ultimately lack of sufficient demand to support supply, is related to the much larger size of the big black “energy needed to create energy” arrow as resources become more and more difficult to extract, and the much smaller size of the red discretionary spending arrows. When the discretionary spending arrows are small, people can’t afford the oil that is produced. 

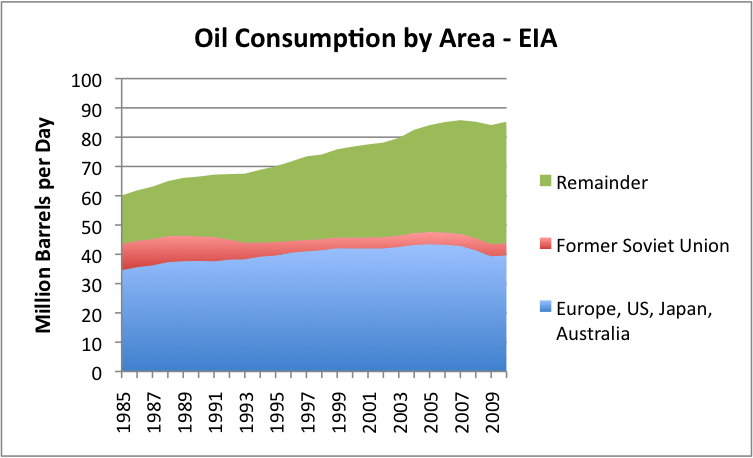
Lack of Demand Can Be Expected to Affect the More-Developed World before the Less-Developed World 

Let me explain one way I see lack of demand for oil arising in the developed world today. This is related to the tendency of economies with high required EROEI to maintain infrastructure to be the first economies to be affected by declining EROEI, and by the tendency of free trade to lead to equalization among economies. 


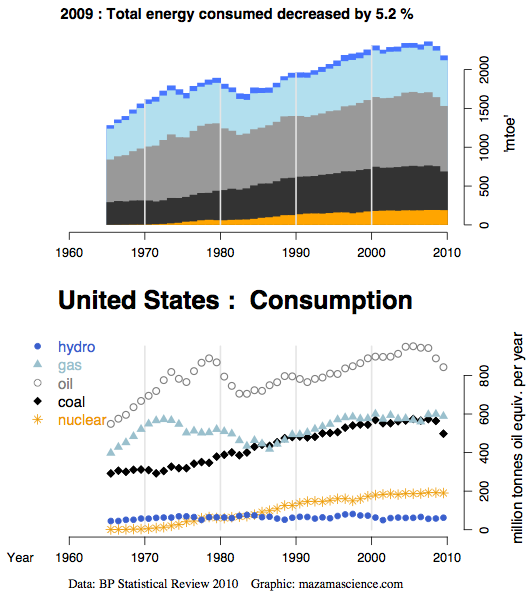
Figure 6. US energy consumption, from Energy Export Data Browser 

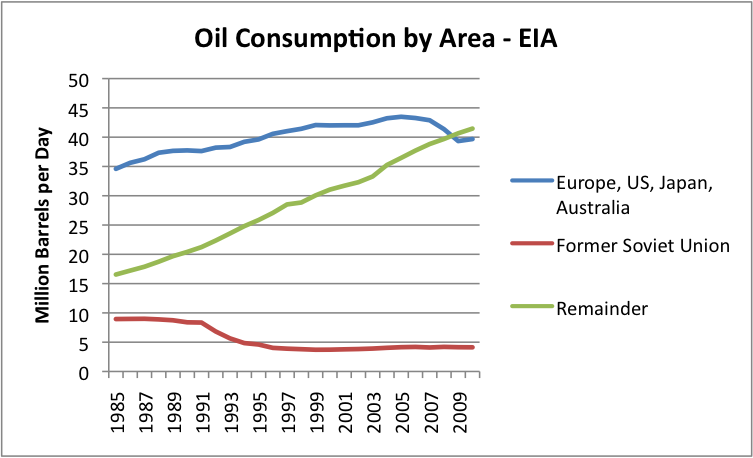
US energy consumption in general, and oil consumption in particular, has been relatively flat in the 2000-2009 period, and declining at the end of that period, indicating low demand. Prior to this period, it was rising. 

More or less the reverse has happened in China and India. Growth in oil use and energy products in general was moderate prior to 2000, but increased rapidly after 2000. 


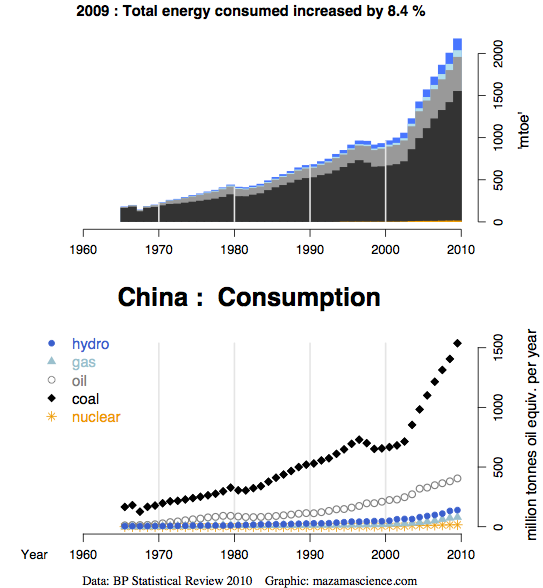
Figure 7. China’s energy consumption, from Energy Export Data Browser 


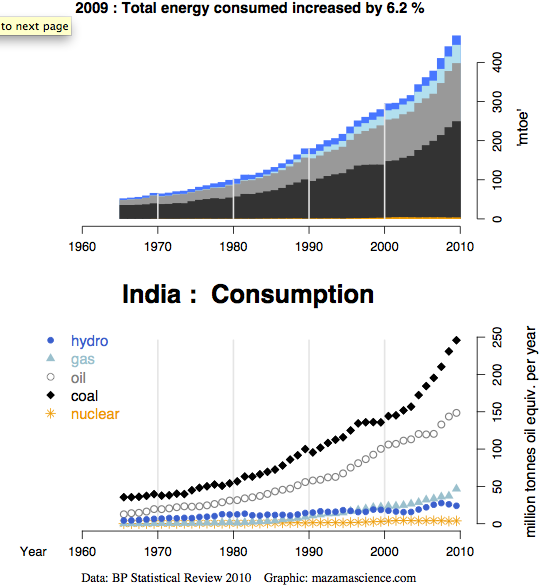
Figure 8. India’s energy consumption, from Energy Export Data Browser 

When we look at the percentage of the US population that is employed (Figure 9), it has been decreasing since 2000, so there are fewer people earning wages, and thus able to buy oil and other products. Prior to 2000, the percentage of the US population working was increasing. 


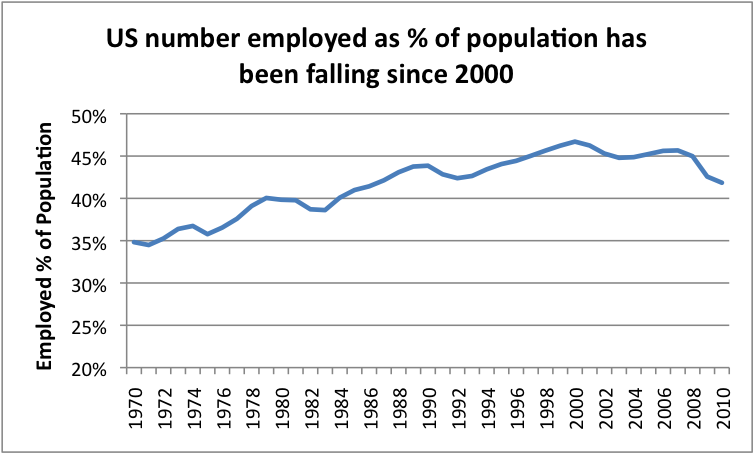
Figure 9. Percentage of US population with jobs has been falling since 2000, based on Bureau of Labor Statistics Data. 

In fact, over time, in the US, there is a high correlation between number of people employed and amount of oil consumed. 


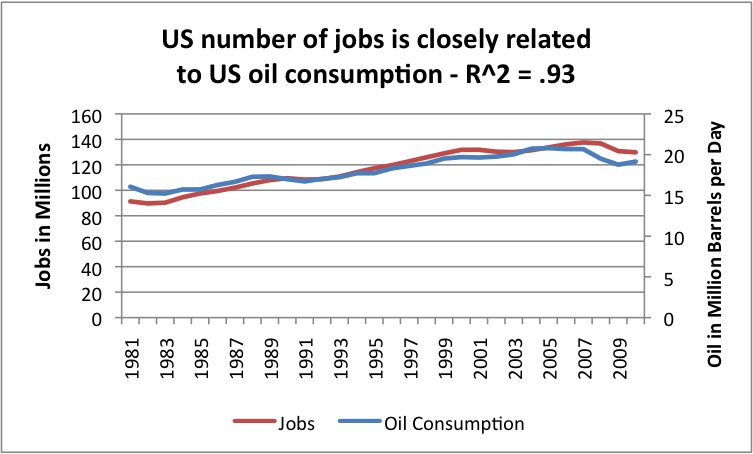
Figure 10. Comparison of number of jobs (BLS) with oil product supplied (EIA) 

This high correlation is not surprising for two reasons: (1) jobs very often involve often use oil in producing or shipping goods, and because (2) people who are earning a salary can afford to buy goods and services that use oil. 

If we think about it, businesses employing people in China and India have three cost advantages over businesses employing people in the US: 

1. People in China and India earn less, in large part because their life styles use less oil. As the price of oil has rises, a person would expect this difference to become greater, if salaries of US earners are raised over time, to reflect the higher cost of oil, as it rises. If the living standards in China increase, the salary differential could decline, but still might be very high in dollar terms. 

2. The cost of electricity used in manufacturing in China and India is cheaper, because it is generally coal-based. The cost of electricity from coal is quite likely even cheaper than electricity from coal from the United States, because these countries are more likely to have poor pollution controls, and because the coal is extracted using cheap labor. The difference in the cost of electricity can be expected to become greater, to the extent the US imposes stricter pollution regulations, or switches to higher priced alternative power (say, offshore wind), or imposes a carbon tax. 

3. Taxes and employee benefits are likely to be lower (in absolute dollars, but perhaps as a percentage as well) in China or India, because infrastructure is less complex, and because there is less in the way benefits comparable to Social Security, Medicare, etc. (This is related to the lower EROEI required to maintain the infrastructure in these countries.) 

With these advantages, as trade restrictions are eased and more “free” trade of services is enabled through the Internet, I would expect an increasing number of jobs to move overseas, and more goods and services to be imported. Salaries will also tend to stay lower in the US, especially for jobs associated to goods and services that can be produced more cheaply in China or India. 

With these lower salaries in the US, demand for oil in the US will tend to be lower, because people who are paid less (or out of work) will not be able to afford high-priced oil for vacations and other optional purchases. As more US jobs move overseas, unemployment and recession can be expected to increasingly become problems. Furthermore, it will become difficult to collect enough taxes from the lower number of employed people to pay enough taxes to keep the system operating. I write about this in What’s Behind the US’ Budget Problems? 

One thing that happens, too, with this arrangement is that world’s coal use has risen. 


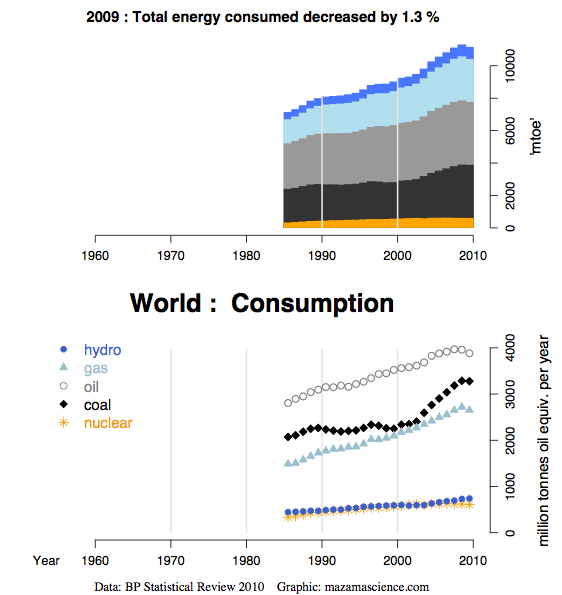
Figure 11. World energy consumption, from Energy Export Data Browser 

I wonder if all of the emphasis on CO2 reduction has not exacerbated the problem. Countries that reduce their own coal use and instead rely more on imports can feel virtuous, but they also set the stage for negative impacts. By using less coal, these countries leave more coal for lesser developed countries to import. These lesser developed countries probably burn it less safely (for example, with less mercury controls) and compete with them for jobs. The developed countries can be expected to have more and more budget problems, as their tax bases erode, and the number of unemployed rises. 

When new electricity generation is planned in the United States, the usual practice is to compare expected costs with other types of new electricity generation that might be possible in the United States. It seems to me that this practice does not show the full picture. Goods and services produced in the United States will have to compete with goods and services produced around the world. Some of the electricity used will be from nuclear plants that have long been paid off; some will be from coal production; and a little will be from high priced new types of electricity production. As long as there are no tariffs or other trade restrictions, higher-priced US electricity will tend to hinder exports and help imports. I would vote for trade restrictions. 

Conclusion 

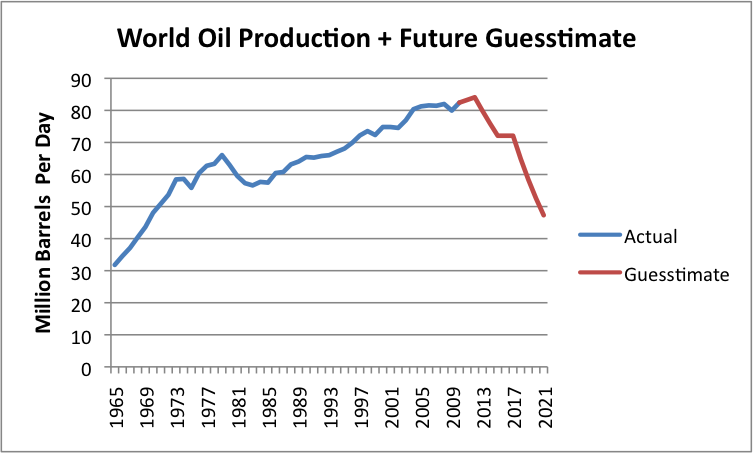
The downslope of oil production can be expected to reflect a combination of different impacts. Unless technology improvements truly have a huge impact, it would seem to me that the overall direction of the downslope is likely to be faster than Hubbert’s Curve would predict. 

Thanks for writing! 

Best Regards, 

Gail Tverberg (also known as Gail the Actuary

2011 – THE YEAR OF CATCH-22

I wrote this on January 3. It was my outlook for 2011. Whenever I think I’m too pessimistic about the world, I go back and read old articles. This article is less than 4 months old and the situation has gotten much worse, much faster than I anticipated. The economy has slowed dramatically, even with the payroll tax cut and Ben’s QE2. I now think the 2nd half of 2011 will be outright recession. Again, my own words prove than I’m actually an optimist compared to what really happens. Think about that the next time you get depressed by one of my articles.

As I began to think about what might happen in 2011, the classic Joseph Heller novel Catch 22 kept entering my mind. Am I sane for thinking such a thing, or am I so insane that asking this question proves that I’m too rational to even think such a thing?  In the novel, the “Catch 22” is that “anyone who wants to get out of combat duty isn’t really crazy”. Hence, pilots who request a fitness evaluation are sane, and therefore must fly in combat. At the same time, if an evaluation is not requested by the pilot, he will never receive one (i.e. they can never be found “insane”), meaning he must also fly in combat. Therefore, Catch-22 ensures that no pilot can ever be grounded for being insane – even if he were. The absurdity is captured in this passage:

There was only one catch and that was Catch-22, which specified that a concern for one’s own safety in the face of dangers that were real and immediate was the process of a rational mind. Orr was crazy and could be grounded. All he had to do was ask; and as soon as he did, he would no longer be crazy and would have to fly more missions. Orr would be crazy to fly more missions and sane if he didn’t, but if he was sane, he had to fly them. If he flew them, he was crazy and didn’t have to; but if he didn’t want to, he was sane and had to. Yossarian was moved very deeply by the absolute simplicity of this clause of Catch-22 and let out a respectful whistle. “That’s some catch, that Catch-22,” he observed. “It’s the best there is,” Doc Daneeka agreed. – Catch 22 – Joseph Heller

The United States and its leaders are stuck in their own Catch 22. They need the economy to improve in order to generate jobs, but the economy can only improve if people have jobs. They need the economy to recover in order to improve our deficit situation, but if the economy really recovers long term interest rates will increase, further depressing the housing market and increasing the interest expense burden for the US, therefore increasing the deficit. A recovering economy would result in more production and consumption, which would result in more oil consumption driving the price above $100 per barrel, therefore depressing the economy. Americans must save for their retirements as 10,000 Baby Boomers turn 65 every day, but if the savings rate goes back to 10%, the economy will collapse due to lack of consumption. Consumer expenditures account for 71% of GDP and need to revert back to 65% for the US to have a balanced sustainable economy, but a reduction in consumer spending will push the US back into recession, reducing tax revenues and increasing deficits. You can see why Catch 22 is the theme for 2011.

It seems the consensus for 2011 is that the economy will grow 3% to 4%, two million new jobs will be created, corporate profits will rise, and the stock market will rise another 10% to 15%. Sounds pretty good. The problem with this storyline is that it is based on a 2010 that gave the appearance of recovery, but was a hoax propped up by trillions in borrowed funds. On January 1, 2010 the National Debt of the United States rested at $12.3 trillion. On December 31, 2010 the National Debt checked in at $13.9 trillion, an increase of $1.6 trillion.

The Federal Reserve Balance Sheet totaled $2.28 trillion on January 1, 2010. Today, it stands at $2.46 trillion, an increase of $180 billion.


Over this same time frame, the Real GDP of the U.S. has increased approximately $350 billion, and is still below the level reached in the 4th Quarter of 2007. U.S. politicians and Ben Bernanke spent almost $1.8 trillion, or 13% of GDP, in one year to create a miniscule 2.7% increase in GDP. This is reported as a recovery by the mainstream corporate media mouthpieces. On September 18, 2008 the American financial system came within hours of a total meltdown, caused by Wall Street mega-banks and their bought off political cronies in Washington DC. The National Debt on that day stood at $9.7 trillion. The US Government has borrowed $4.2 since that date, a 43% increase in the National Debt in 27 months. The Federal Reserve balance sheet totaled $963 billion in September 2008 and Bernanke has expanded it by $1.5 trillion, a 155% increase in 27 months. Most of the increase was due to the purchase of toxic mortgage backed securities from their Wall Street masters.

Real GDP in the 3rd quarter of 2008 was $13.2 trillion. Real GDP in the 3rd quarter of 2010 was $13.3 trillion.

Think about these facts for one minute. Your leaders have borrowed $5.7 trillion from future unborn generations and have increased GDP by $100 billion. The financial crisis, caused by excessive debt creation by Wall Street and ridiculously low interest rates set by the Federal Reserve, 30 years in the making, erupted in 2008. The response to a crisis caused by too much debt and interest rates manipulated too low was to create an immense amount of additional debt and reduce interest rates to zero. The patient has terminal cancer and the doctors have injected the patient with more cancer cells and a massive dose of morphine. The knowledge about how we achieved the 2010 “recovery” is essential to understanding what could happen in 2011.

Confidence Game

Ben Bernanke, Timothy Geithner, Barack Obama, the Wall Street banks, and the corporate mainstream media are playing a giant confidence game. It is a desperate gamble. The plan has been to convince the population of the US that the economy is in full recovery mode. By convincing the masses that things are recovering, they will begin to spend and buy stocks. If they spend, companies will gain confidence and start hiring workers. More jobs will create increasing confidence, reinforcing the recovery story, and leading to the stock market soaring to new heights. As the market rises, the average Joe will be drawn into the market and it will go higher. Tax revenues will rise as corporate profits, wages and capital gains increase. This will reduce the deficit. This is the plan and it appears to be working so far. But, Catch 22 will kick in during 2011.

Retail sales are up 6.5% over 2009 as consumers have been convinced to whip out one of their 15 credit cards and buy some more iPads, Flat screen TVs, Ugg boots and Tiffany diamond pendants. Consumer non-revolving debt for autos, student loans, boats and mobile homes is at an all-time high as the government run financing arms of GMAC and Sallie Mae have issued loans to anyone that can fog a mirror with their breath. Total consumer credit card debt has been flat for 2010 as banks have written it off as fast as consumers can charge it. The savings rate has begun to fall again as Americans are being convinced to live today and not worry about tomorrow. Of course, the current savings rate of 5.9% would be 2% if the government was not dishing out billions in transfer payments. Wages have declined by $127 billion from the 3rd Quarter of 2008, while government transfer payments for unemployment and other social programs have increased by $441 billion, all borrowed.

  Graph of Personal Saving Rate

Both the government and its citizens are living the old adage:

Everybody wants to get to heaven, but no one wants to practice what is required to get there.

The government politicians and bureaucrats promise to cut unsustainable spending as soon as the economy recovers. The economy has been recovering for the last 6 quarters, according to GDP figures, but there are absolutely no government efforts to cut spending. This is proof that politicians always lie. It will never be the right time to cut spending. Another faux crisis will be used as a reason to continue unfunded spending increases. Having consumer spending account for 70% of GDP is unbalanced and unsustainable. Everyone knows that consumer spending needs to revert back to 65% of GDP and the Savings Rate needs to rise to 8% or higher in order to ensure the long-term fiscal health of the country. Savings and investment are what sustain countries over time. Borrowing and spending is a recipe for failure and bankruptcy. The facts are that consumer expenditures as a percentage of GDP have actually risen since 2007 and Congress and Obama just cut payroll taxes in an effort to encourage Americans to spend even more borrowed money. Catch 22 is alive and well.

The first half of 2011 is guaranteed to give the appearance of recovery. The lame-duck Congress “compromise” will pump hundreds of billions of borrowed dollars into the economy. The continuation of unemployment benefits for 99 weeks (supposedly to help employment) and the 2% payroll tax cut will goose consumer spending. Ben Bernanke and his QE2 stimulus for poor Wall Street bankers is pumping $75 billion per month ($3 to $4 billion per day) directly into the stock market. Since Ben gave Wall Street the all clear signal in late August, the NASDAQ has soared 25%. Despite the fact that there are 362,000 less Americans employed than were employed in August 2010, the mainstream media will continue to tout the jobs recovery. The goal of all these efforts is to boost confidence and spending. Everything being done by those in power has the seeds of its own destruction built in. The Catch 22 will assert itself in the 2nd half of 2011.

Housing Catch 22

Ben Bernanke, an Ivy League PhD who should understand the concept of standard deviation, missed a 3 standard deviation bubble in housing as ironically pointed out by a recent Dallas Federal Reserve report.

Chart 1: U.S. Real Home Prices Returning to Long-Term Mean?

Home prices still need to fall 23%, just to revert to its long-term mean. That is a fact that even Bernanke should be able to grasp (maybe not). Anyone who argues that housing has bottomed and will resume growth either has an agenda (NAR) or is a clueless dope (Bernanke). A new perfect storm is brewing for housing in 2011 and will not subside until late 2012. You may have thought those bad mortgages had been all written off. You would be wrong. There will be in excess of $200 billion of adjustable rate mortgages that reset between 2011 and 2012, with in excess of $125 billion being the dreaded Alt-A mortgages. This is a recipe for millions of new foreclosures.

[SNLCreditSuisse.jpg]

According to the Dallas Fed, in addition to the 3.9 million homes on the market, there is a shadow inventory of 6 million homes that will be coming on the market due to foreclosure. About 3.6 million housing units, representing 2.7% of the total housing stock, are vacant and being held off the market. These are not occasional-use homes visited by people whose usual residence is elsewhere but units that are vacant year-round. Presumably, many are among the 6 million distressed properties that are listed as at least 60 days delinquent, in foreclosure or foreclosed in banks’ inventories.

The coup de grace for the housing market will be Ben Bernake’s ode to Catch 22. In his November 4 OP-ED piece he had this to say about his $600 billion QE2:

“Easier financial conditions will promote economic growth. For example, lower mortgage rates will make housing more affordable and allow more homeowners to refinance.”Housing sage Ben Bernanke

On the day Bernanke wrote these immortal words 30 Year Mortgage rates were 4.2%. Today, two months later, they stand at 5.0%. This should be a real boon to refinancing and the avalanche of mortgage resets coming down the pike. It seems that money printing and a debt financed “recovery” leads to higher long-term interest rates. The more convincing the recovery, the higher interest rates will go. The higher interest rates go, the further the housing market will drop. The further housing prices drop, the number of underwater homeowners will grow to 30%. This will lead to more foreclosures. Approximately 50% of all the assets on banks books are backed by real estate. Billions in bank losses are in the pipeline. Do you see the Catch 22 in Bernanke’s master plan? The Dallas Fed sees it:

This unease highlights the housing market’s fragility and suggests there may be no pain-free path to the eventual righting of the market. No perfect solution to the housing crisis exists. The latest price declines will undoubtedly cause more economic dislocation. As the crisis enters its fifth year, uncertainty is as prevalent as ever and continues to hinder a more robust economic recovery. Given that time has not proven beneficial in rendering pricing clarity, allowing the market to clear may be the path of least distress. – Dallas Fed

Quantitative Easing Catch 22

Ben Bernanke’s quantitative easing (dropping dollars from helicopters) is riddled with Catch-22 implications. Bernanke revealed his plan in his 2002 speech about deflation:

“The U.S. government has a technology, called a printing press (or today, its electronic equivalent), that allows it to produce as many U.S. dollars as it wishes at no cost.”

The expectations of most when reading Ben’s words were that his helicopters would drop the dollars across America. What he has done is load up his helicopters with trillions of dollars and circled above Wall Street for two years continuously dropping his load. Bernanke’s quantitative easing, which will triple the Fed’s balance sheet by June of 2011, began in earnest in early 2009. The price for a gallon on gasoline was $1.62. Today, it is $3.05, an 88% increase in two years. Gold was $814 an ounce. Today, it is $1,421 an ounce, a 61% increase in two years. In the last year, the prices for copper, silver, cotton, wheat, corn, coffee and other commodities have risen in price by 30% to 90%.  

2 year gold price per ounce

Quantitative easing has been sold to the public as a way to avoid the terrible ravages of deflation. The fact is there are less jobs, lower wages, lower home prices, zero returns on bank deposits, higher fuel costs, higher food costs, higher real estate taxes, higher medical insurance premiums and huge jaw dropping bonuses for the bankers on Wall Street. Somehow the government has spun this toxic mix into a CPI which has resulted in fixed income senior citizens getting no increases in their pitiful Social Security payments for two years. You can judge where Ben’s Helicopters have dropped the $2 trillion. Quantitative easing has benefited only Wall Street bankers and the 1% wealthiest Americans. The $1.4 trillion of toxic mortgage backed securities on The Fed’s balance sheet are worth less than $700 billion. How will they unload this toxic waste? The Treasuries they have bought drop in value as interest rates rise. Quantitative easing’s Catch 22 is that it can never be unwound without destroying the Fed and the US economy.

The USD dollar index was at 89 in early 2009. Today, it stands at 79, an 11% decline, which is phenomenal considering that Europe has imploded over this same time frame. Bernanke’s master plan is for the USD to fall and ease the burden of our $14 trillion in debt. He just wants it to fall slowly. Foreigners know what he is doing and are stealthily getting out of their USD positions. This explains much of the rise in gold, silver and commodities. The rise in oil to $91 a barrel will not be a top. The Catch-22 of a declining dollar is that prices of all imported goods go up. If the dollar falls another 10%, the price of oil will rise above $120 a barrel and push the economy back into recession. Then there is the little issue of at what level of printing and debasing the currency does the rest of the world lose its remaining confidence in Ben and the USD.

U.S $ INDEX (NYBOT:DX)

A few other “minor” issues for 2011 include:

  • The imminent collapse of the European Union as Greece, Ireland, Portugal and Spain are effectively bankrupt. Spain is the size of the other three countries combined and has a 20% unemployment rate. The Germans are losing patience with these spendthrift countries. Debt does matter.
  • State and local governments were able to put off hard choices for another year, as Washington DC handed out hundreds of billions in pork. California will have a $19 billion budget deficit; Illinois will have a $17 billion budget deficit; New Jersey will have a $10.5 billion budget deficit; New York will have a $9 billion budget deficit. A US Congress filled with Tea Party newcomers will refuse to bailout these spendthrift states. Substantial government employee layoffs are a lock.

  • There is a growing probability that China will experience a hard landing as their own quantitative easing has resulted in inflation surging to a 28 month high of 5.1%, with food inflation skyrocketing to 11.7%. Poor families spend up to half of their income on food. Rapidly rising prices severely burden poor people and can spark civil unrest if too many of them can’t afford food.
  • The Tea Party members of Congress are likely to cause as much trouble for Republicans as Democrats. If they decide to make a stand on raising the debt ceiling early in 2011, all hell could break loose in the debt and stock markets. 

The government’s confidence game is destined to fail due to Catch-22. Will the consensus forecast of a growing economy, rising corporate profits, 10% to 15% stock market gains, 2 million new jobs, and a housing recovery come true in 2011? No it will not. By mid-year confidence in Ben’s master plan will wane. He is trapped in the paradox of Catch-22. When you start hearing about QE3 you’ll know that the gig is up. If Bernanke is foolish enough to propose QE3 you can expect gold, silver and oil to go parabolic. Enjoy 2011. I don’t think Ben Bernanke will.

“That’s some catch, that Catch-22.” -Yossarian