Dear Curious,
It seems to me that
(1) A slow decline assumes that the only issue is geological decline in oil supply, and the economy and everything else can go on as usual. Technological advances and switches to alternatives might also be expected to help keep supply up.
(2) A fast decline can be expected if one or more adverse factors make oil supply decline faster than geological factors would suggest. These might include:
(a) Liebig’s Law of the Minimum – some necessary element for production, such as political stability, or adequate food for the population, or adequate financial stability, is missing or
(b) Declining Energy Return on Energy Invested (EROEI) interferes with the functioning of society, so the society generates too little net energy, and economic problems ensue, or
(c) Oil becomes so high priced that there is little demand for it. This would quite likely be related to declining EROEI.
My view is that some version of the faster decline scenario is likely, because we will hit limits that interfere with oil production or oil demand.
Let me explain my reasoning.
Declining EROEI
EROEI means Energy Returned on Energy Invested. It can be defined as the ratio of the amount of usable energy acquired from a particular energy resource to the amount of energy expended to obtain that energy resource. Wikipedia says,
When the EROEI of a resource is equal to or lower than 1, that energy source becomes an “energy sink”, and can no longer be used as a primary source of energy.
The situation is really worse than Wikipedia suggests. An economy needs a certain level of energy just to keep its infrastructure (roads, bridges, schools, medical system, etc.) repaired and working, and citizens educated. So energy resources, to really be useful, need an EROEI significantly higher than 1 to maintain the system at its current level of functioning.
How much higher than 1.0 the EROEI needs to be on average will depend on the economy. An economy such as that of China, with relatively fewer paved roads and less expensive schools and healthcare system can probably get along with a much average lower EROEI (perhaps 4.0?) than an economy like the United States (perhaps 8.0), because of lesser infrastructure demands.
If the average EROEI available to society is falling because oil is becoming more and more difficult to extract, an economy with a high standard of living such as the US would seem likely to be affected before an economy with a lower standard of living, such as China or India or Bangladesh, because of the higher EROEI needs of the more extensive infrastructure. Ultimately, though, the world is one economy, so problems in one country are likely to affect the economies of other countries as well.
There a couple of issues related to declining EROEI:
1. High cost to extract. Sources of oil or natural gas or coal that are difficult (high cost) to extract tend to be lower in EROEI than sources that are low cost to extract. So high cost of extraction tends to be a marker for low EROEI. We are increasingly running into this issue, for both oil and natural gas.
2. Declining Net Energy. EROEI is closely related to “Net Energy,” which is the amount of usable energy that is left after deducting the energy that it takes to make energy. When net energy decreases, we have less energy to run society, making it difficult to do things like maintain bridges and roads, and fund schools.
So high cost of oil extraction, low net energy, and low EROEI are all very closely related.
What did M. King Hubbert Say?
M. King Hubbert in various papers such as these (1956, 1962, 1976) talked about a world in which other fuels took over, long before fossil fuels encountered problems with short supply.
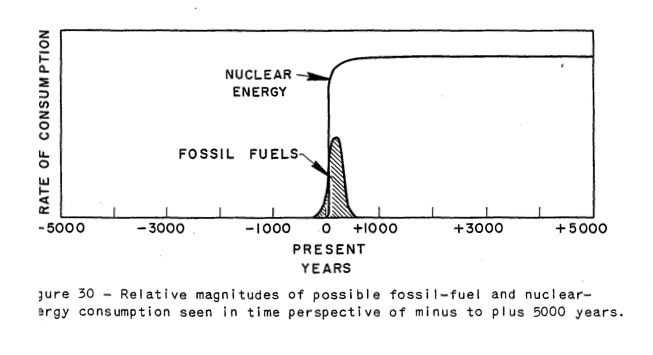
Figure 1. Image from Hubbert’s 1956 paper, Nuclear Energy and the Fossil Fuels
In such a world, there would be plenty of net energy from alternative fuels to run society. Because of this, even if fossil fuels ran low, it would be easy to maintain the economy’s infrastructure, without disruption. In Hubbert’s 1962 paper, Energy Resources – A Report to the Committee on Natural Resources, Hubbert writes about the possibility of having so much cheap energy that it would be possible to essentially reverse combustion–combine lots of energy, plus carbon dioxide and water, to produce new types of fuel plus water. If we could do this, we could solve many of the world’s problems–fix our high CO2 levels, produce lots of fuel for our current vehicles, and even desalinate water, without fossil fuels.
He also showed this figure in his 1956 paper:
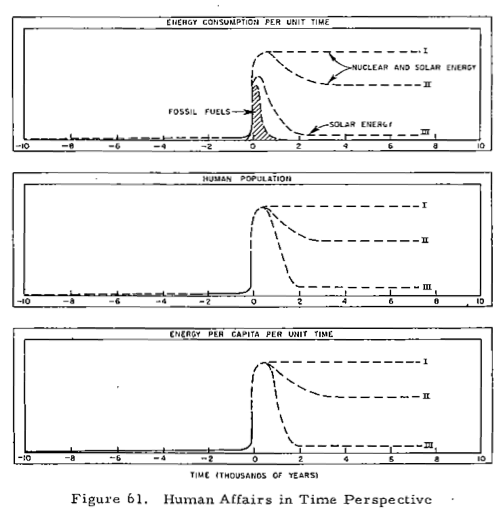
Figure 2. Image from Hubbert’s 1956 paper, Nuclear Energy and the Fossil Fuels
In this figure, most of the additional energy comes from nuclear energy, while a smaller amount comes from “solar” energy. By solar energy, Hubbert would seem to mean solar, wind, tidal, wood, biofuels, and other energy we get on a day-to-day basis, indirectly from the sun. His figure seems to suggest that solar energy would basically act as a fossil fuel extender, and would not last beyond the time fossil fuels last. The primary long-term source of energy would be nuclear.
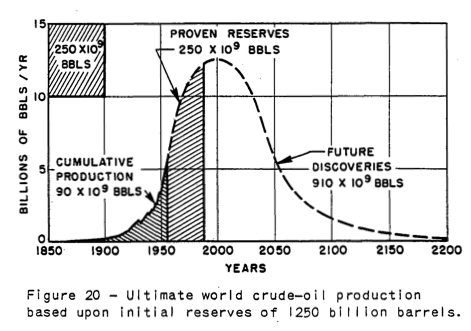
Figure 3. Hubbert’s application of his curve to world oil supply, from his 1956 paper.
In such a world, applying Hubbert’s Curve to world oil supply would make perfect sense, because there would be plenty of other energy, to provide the energy needed to keep up the infrastructure needed to main extraction of oil, gas, and other fuels as long as they were available. Even liquid fuels and pollution wouldn’t be a problem, if they could be manufactured synthetically. The carrying capacity of the world for food would eventually be a factor, but in one scenario in his 1976 paper, he shows the possibility of world population eventually reaching 15 billion people, thanks to the availability of other fuels.
Another Approach to Forecasting Future Oil Supply: Limits to Growth Type Modeling
Another approach estimating the shape of the decline curve is by applying modeling techniques, such as used in the 1972 book Limits to Growth by Donella Meadows et al. The factors considered in this model were population, food per capita, industrial output, pollution, and resources. Resources were modeled in total, not oil separately from other types of resources. There were 24 scenarios run. The base scenario suggested that the world would start hitting resource limits about now (plus or minus 10 or 20 years). There have been several analyses regarding how this model is faring, and the conclusion seems to be that it is more or less on track. This is a link to such an analysis by Charles Hall and John Day.
With this type of model, according to Limits to Growth (p. 142), “The basic mode of the world system is exponential growth of population and capital, followed by collapse.” This type of decline would seem to be substantially faster than the decline predicted by the Hubbert Curve.
One thing I notice about the Limits to Growth model is that it leaves out our debt-based financial system. Since so much capital is borrowed in today’s world, it seems like including such a variable would tend to make the system even more “brittle”, and perhaps move up the date when collapse occurs.
Also, the Limits to Growth model is for the world as a whole, rather than for different parts of the world. Different areas of the world can be expected to be affected differently, as oil gets in shorter supply. The effect of this would seem to be to push economies which have a higher need for oil (illustrated above with my estimate that the US requires a EROEI of 8.0 on energy resources) down toward economies that use smaller amounts of oil (illustrated by my rough guess that perhaps China could get by with an EROEI of 4.0), especially if they trade with each other. I explain how I see this happening in a later section of this post.
Demand for Oil (or other Fossil Fuels)
Even if there is plenty of high-priced oil extracted from the ground, if potential buyers cannot afford it, there can be a problem, leading to a decline in oil production. Demand can be thought of as the willingness and ability to purchase oil products. Many people would like to have gasoline for their cars, but if they are unemployed, or have a part-time minimum wage job, they are likely not to have enough money to buy very much.
Over the long term, declining demand can be expected because of declining EROEI, as illustrated by Prof. Charles Hall’s “Cheese Slicer” model.

Figure 4. Professor Charles Hall’s cheese slicer model of the economy, reflecting the energy needed to make energy, and other aspects of the economy at 1970

Figure 5. Professor Charles Hall’s cheese slicer model of the economy, reflecting the energy needed to make energy, and other aspects of the economy at 2030
Declining demand, and ultimately lack of sufficient demand to support supply, is related to the much larger size of the big black “energy needed to create energy” arrow as resources become more and more difficult to extract, and the much smaller size of the red discretionary spending arrows. When the discretionary spending arrows are small, people can’t afford the oil that is produced.
Lack of Demand Can Be Expected to Affect the More-Developed World before the Less-Developed World
Let me explain one way I see lack of demand for oil arising in the developed world today. This is related to the tendency of economies with high required EROEI to maintain infrastructure to be the first economies to be affected by declining EROEI, and by the tendency of free trade to lead to equalization among economies.
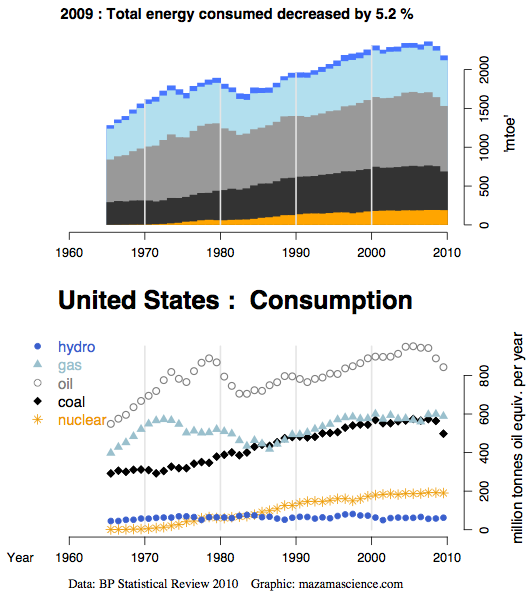
Figure 6. US energy consumption, from Energy Export Data Browser
US energy consumption in general, and oil consumption in particular, has been relatively flat in the 2000-2009 period, and declining at the end of that period, indicating low demand. Prior to this period, it was rising.
More or less the reverse has happened in China and India. Growth in oil use and energy products in general was moderate prior to 2000, but increased rapidly after 2000.
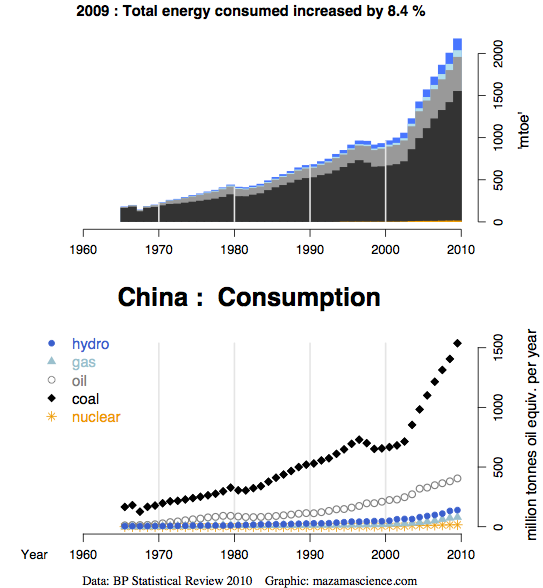
Figure 7. China’s energy consumption, from Energy Export Data Browser
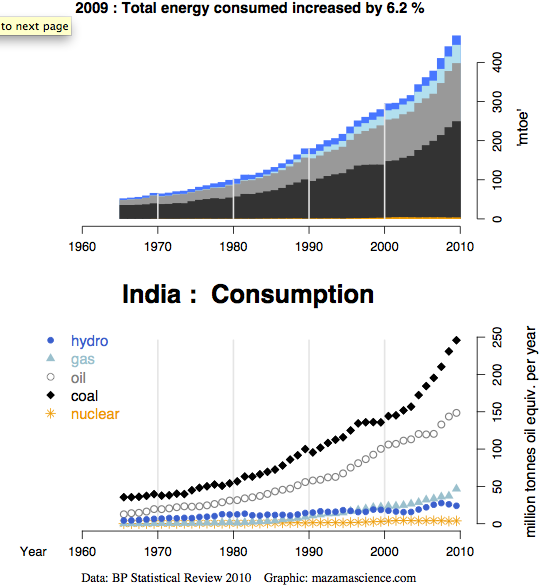
Figure 8. India’s energy consumption, from Energy Export Data Browser
When we look at the percentage of the US population that is employed (Figure 9), it has been decreasing since 2000, so there are fewer people earning wages, and thus able to buy oil and other products. Prior to 2000, the percentage of the US population working was increasing.
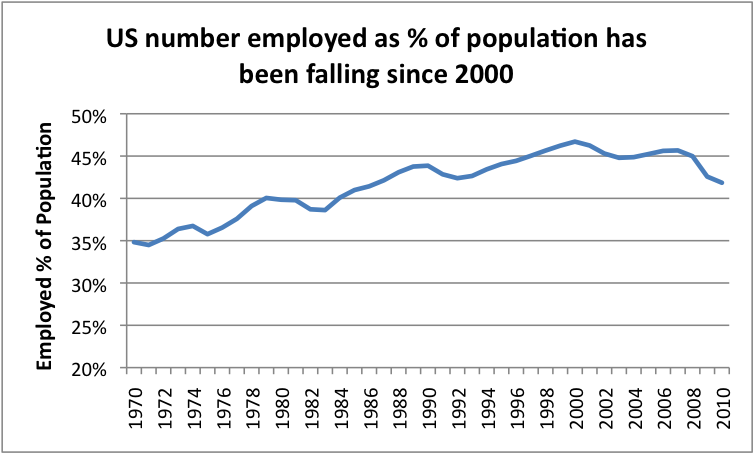
Figure 9. Percentage of US population with jobs has been falling since 2000, based on Bureau of Labor Statistics Data.
In fact, over time, in the US, there is a high correlation between number of people employed and amount of oil consumed.
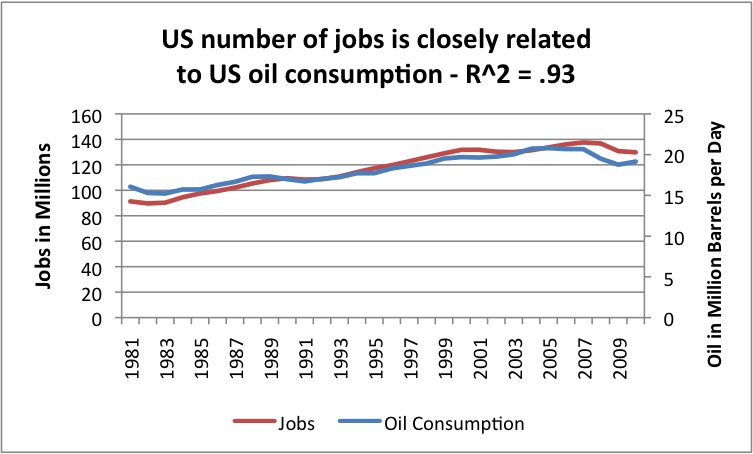
Figure 10. Comparison of number of jobs (BLS) with oil product supplied (EIA)
This high correlation is not surprising for two reasons: (1) jobs very often involve often use oil in producing or shipping goods, and because (2) people who are earning a salary can afford to buy goods and services that use oil.
If we think about it, businesses employing people in China and India have three cost advantages over businesses employing people in the US:
1. People in China and India earn less, in large part because their life styles use less oil. As the price of oil has rises, a person would expect this difference to become greater, if salaries of US earners are raised over time, to reflect the higher cost of oil, as it rises. If the living standards in China increase, the salary differential could decline, but still might be very high in dollar terms.
2. The cost of electricity used in manufacturing in China and India is cheaper, because it is generally coal-based. The cost of electricity from coal is quite likely even cheaper than electricity from coal from the United States, because these countries are more likely to have poor pollution controls, and because the coal is extracted using cheap labor. The difference in the cost of electricity can be expected to become greater, to the extent the US imposes stricter pollution regulations, or switches to higher priced alternative power (say, offshore wind), or imposes a carbon tax.
3. Taxes and employee benefits are likely to be lower (in absolute dollars, but perhaps as a percentage as well) in China or India, because infrastructure is less complex, and because there is less in the way benefits comparable to Social Security, Medicare, etc. (This is related to the lower EROEI required to maintain the infrastructure in these countries.)
With these advantages, as trade restrictions are eased and more “free” trade of services is enabled through the Internet, I would expect an increasing number of jobs to move overseas, and more goods and services to be imported. Salaries will also tend to stay lower in the US, especially for jobs associated to goods and services that can be produced more cheaply in China or India.
With these lower salaries in the US, demand for oil in the US will tend to be lower, because people who are paid less (or out of work) will not be able to afford high-priced oil for vacations and other optional purchases. As more US jobs move overseas, unemployment and recession can be expected to increasingly become problems. Furthermore, it will become difficult to collect enough taxes from the lower number of employed people to pay enough taxes to keep the system operating. I write about this in What’s Behind the US’ Budget Problems?
One thing that happens, too, with this arrangement is that world’s coal use has risen.
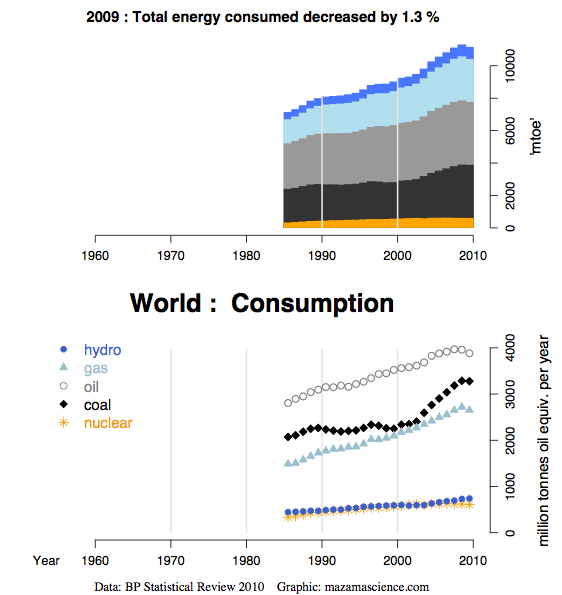
Figure 11. World energy consumption, from Energy Export Data Browser
I wonder if all of the emphasis on CO2 reduction has not exacerbated the problem. Countries that reduce their own coal use and instead rely more on imports can feel virtuous, but they also set the stage for negative impacts. By using less coal, these countries leave more coal for lesser developed countries to import. These lesser developed countries probably burn it less safely (for example, with less mercury controls) and compete with them for jobs. The developed countries can be expected to have more and more budget problems, as their tax bases erode, and the number of unemployed rises.
When new electricity generation is planned in the United States, the usual practice is to compare expected costs with other types of new electricity generation that might be possible in the United States. It seems to me that this practice does not show the full picture. Goods and services produced in the United States will have to compete with goods and services produced around the world. Some of the electricity used will be from nuclear plants that have long been paid off; some will be from coal production; and a little will be from high priced new types of electricity production. As long as there are no tariffs or other trade restrictions, higher-priced US electricity will tend to hinder exports and help imports. I would vote for trade restrictions.
Conclusion
The downslope of oil production can be expected to reflect a combination of different impacts. Unless technology improvements truly have a huge impact, it would seem to me that the overall direction of the downslope is likely to be faster than Hubbert’s Curve would predict.
Thanks for writing!
Best Regards,
Gail Tverberg (also known as Gail the Actuary)


