George Soros and his far-left movement is paying student agitators to co-opt and amplify anti-Israel protests at colleges across the country, the NY Post reports.
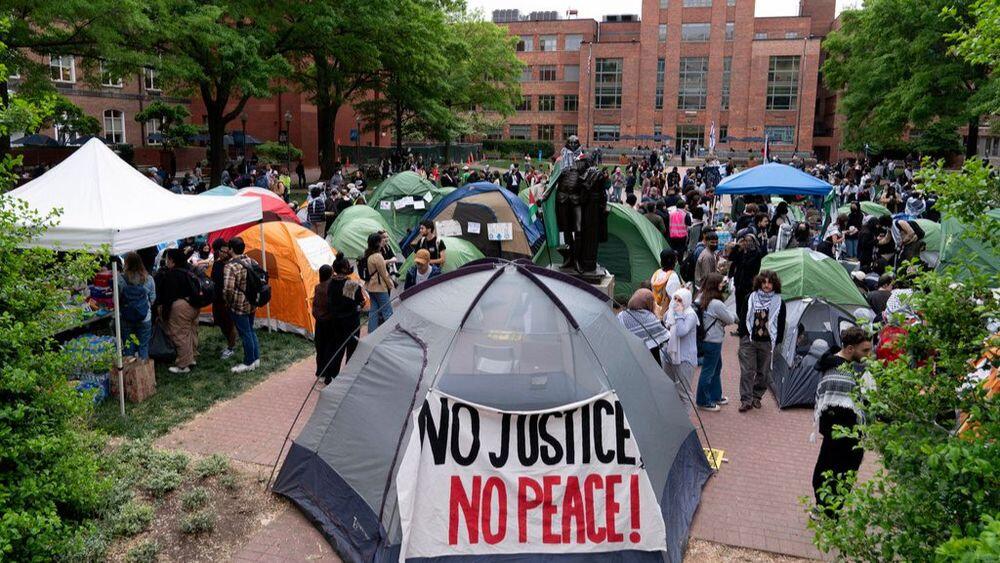
The protests, which began at Columbia University, have expanded nationwide – with copycat tent cities erected at colleges including Harvard, Yale, Berkeley in California, the Ohio State University and Emory in Georgia, with organized branches of the Soros-funded Students for Justice in Palestine (SJP) having organized them.
Biden has sparked a wildfire. pic.twitter.com/YXbHCKONcm
— Edward Snowden (@Snowden) April 25, 2024
Which might explain this:
Something odd about those campus tent encampments. Almost all the tents are identical – same design, same size, same fresh-out-of-the-box appearance. Which suggests that rather than an organic process, whereby students would bring a variety of individual tents, someone or some… pic.twitter.com/86JV5BD9NM
— Afshine Emrani MD FACC (@afshineemrani) April 23, 2024
Continue reading “George Soros Paying Student Agitators To Whip Up Anti-Israel Protests”