Prices Should Rise

Guest Post by John Stossel

Prices Should Rise

Officials in states hit by Hurricane Florence are on the lookout for “price gouging.”

People who engage in “excessive pricing” face up to 30 days jail time, said North Carolina’s attorney general. South Carolina passed a “Price Gouging During Emergency” law that imposes a $1,000 fine per violation.

“Gouging” is an issue during every disaster because when supplies are short, some merchants raise prices.

These are “bad people,” said Florida Attorney General Pam Bondi angrily during a previous storm.

Bad people?

Continue reading “Prices Should Rise”

Buy Steel (Not Gold)

Guest Post by Eric Peters

Gold may not have the high rate of return that the casino called Wall Street offers … to insiders. But it is one way to store value – and that accounts for its popularity among people who may not get rich quick but manage to avoid becoming poor.buy-gold-lead

Used cars are another great way to transmute depreciating paper money into a durable asset that – like gold – is portable and fungible (i.e., easily converted into other things of value).

The government has inadvertently created a bull market for them, too.

First, it decreased supply via the infamous “Cash For Clunkers” program (a “clunker” being defined not by mechanical condition, incidentally, but by the car’s gas mileage numbers). The government paid people inflated sums of other people’s money (an estimated $3 billion) to turn in perfectly roadworthy used cars in for unwarranted, early destruction … in order to “stimulate” demand for new cars.

This was like burning down every third house in a neighborhood to create a “need” for new housing.

Continue reading “Buy Steel (Not Gold)”

CHART OF WHY TRUMP IS WINNING

It really doesn’t get any clearer than the chart below. The average working stiff brings home $100 less per week in real terms than they did in 1972. Meanwhile, the price of everything they need to live their daily lives (rent, home prices, cars, food, energy, medical, tuition, taxes, clothing) has gone up exponentially. The ruling class (bankers, politicians, corporations, oligarchs) have convinced millions to utilize their easy money debt to make up the difference. Replacing earnings with borrowing is good for the establishment and bad for you. It seems millions are starting to awaken from their stupor and are pissed off at the perpetrators of this crime. They are flocking to Trump, not because he’s like them or has a clear plan to help them, because they believe he is the destroyer of their enemy establishment. Whether Trump can reverse the chart below is yet to be seen.


The Decline Of Oil: Head-Fake Or New Normal?

Submitted by Charles Hugh-Smith of OfTwoMinds blog,

When production does finally collapse, that will set up the “nobody saw this coming” ramp in the price of oil.

In May 2008 I proposed the Oil “Head-Fake” Scenario in which global recession pushes oil demand down as oil exporters pump their maximum production in a futile attempt to fund their vast welfare states and thus retain their precarious political power.

Oil: One Last Head-Fake? (May 9, 2008)

The terrible irony of the head-fake, of course, is that the exporters’ efforts to pump more oil exacerbates the oversupply, further depressing prices. As exporters receive fewer dollars for their production, they attempt to compensate by pumping even more oil. Perniciously, this suppresses prices even more, setting up a positive feedback loop which pushes prices to the point that exporters are no longer able to fund their welfare states and Elites.

Something has to give, and that something is the existing power structure in oil exporting nations.

Another factor deepens the eventual crisis triggered by drastically lower oil revenues. The majority of exporting nations under-invest in their oil production and exploration infrastructures, essentially guaranteeing declining production once the easy oil has been extracted.

This cycle of spending the fruits of current production while starving investment for the future is part of what is known as the resource curse: nations with an abundance of resources rely on the income generated by the sale of their resources which effectively stunts the development of a diverse economy and the institutions which such a diverse economy requires as a foundation.

Continue reading “The Decline Of Oil: Head-Fake Or New Normal?”

Why The New Car Bubble’s Days Are Numbered

Tyler Durden's picture

Having recently detailed the automakers’ worst nightmare – surging new car inventories – supply; amid rapidly declining growth around the world (EM and China) – demand;

Automakers just unleashed a massive production surge to keep the dream alive…


With inventories at record highs (having risen for 61 straight months)…

Continue reading “Why The New Car Bubble’s Days Are Numbered”

No Joy in Mudville*: Shale Gas Stalls, LNG Export Dead On Arrival

Something unusual happened while we were focused on the global oil-price collapse–the increase in U.S. shale gas production stalled (Figure 1).

U.S. Shale Gas Prod 30 July 2015
Figure 1. U.S. shale gas production.  Source:  EIA and Labyrinth Consulting Services, Inc.

Total shale gas production for June was basically flat compared with May–down 900 mcf/d or -0.1% (Table 1).

Shale Gas Prod Change Table 30 July 2015
Table 1. Shale gas production change table.  Source:  EIA and Labyrinth Consulting Services, Inc.

Marcellus and Utica production increased very slightly over May, 1.1 and 1.5 mmcf/d, respectively. The Woodford was up 400 mcf/d and “other” shale increased 300 mcf/d. Production in the few plays that increased totaled 3.3 mmcf/d or one fair gas well’s daily production.

The rest of the shale gas plays declined.  The earliest big shale gas plays–the Barnett, Fayetteville and Haynesville–were down 25%, 14% and 48% from their respective peak production levels for a total decline of -4.8 bcf/d since January 2012.

Continue reading “No Joy in Mudville*: Shale Gas Stalls, LNG Export Dead On Arrival”

RENT A CHICKEN

Guest Post by

This is how much it will cost to buy — or even rent — your own egg-producing chicken

Getty Images
Would you like your own? You can now rent or buy.

The sharing economy for chickens is nothing to gobble at.

The price of a dozen eggs has soared more than 30% in just one month to $2.57 in June from $1.96 in May, according to the Bureau of Labor Statistics. The price rise in recent months is due to an outbreak of avian influenza virus H5N1; around 48 million turkeys, chickens and hens have either died from the flu or have been euthanized. No new cases of the virus have been detected for more than a month, but U.S. Agriculture Secretary Tom Vilsack said this week that he was not ready to declare the crisis over.

And while there have been no reported cases of H5N1 transferring to humans during this outbreak across 20 states, many consumers are more concerned about the provenance of their eggs than the price per dozen. “No human infections with these viruses have been detected at this time,” the Centers for Disease Control and Prevention stated. “However, similar viruses have infected people in the past. It’s possible that human infections with these viruses may occur.”

Some Americans prefer to eat eggs from chickens they’ve raised themselves rather than buy eggs from their local store, at least for now. But the overhead investment on a backyard flock can be steep. And it’s a big commitment. What’s a sustainability-minded omelet lover to do? How about renting a chicken?

Continue reading “RENT A CHICKEN”

LIES, DAMNED LIES & STATISTICS

The government released their monthly CPI report this week. Even though it came in at an annualized rate of 3.6%, they and their mouthpieces in the corporate mainstream media dutifully downplayed the uptrend. They can’t let the plebs know the truth. That might upend their economic recovery storyline and put a crimp into their artificial free money, zero interest rate, stock market rally. If they were to admit inflation is rising, the Fed would be forced to raise rates. That is unacceptable in our rigged .01% economy. There are banker bonuses, CEO stock options, corporate stock buyback earnings per share goals and captured politician elections at stake.

The corporate MSM immediately shifted the focus to the annual CPI figure of 0.1%. That’s right. Your government keepers expect you to believe the prices you pay to live your everyday life have been essentially flat in the last year. Anyone who lives in the real world, not the BLS Bizarro world of models, seasonal adjustments, hedonic adjustments, and substitution adjustments, knows this is a lie. The original concept of CPI was to measure the true cost of maintaining a constant standard of living. It should reflect your true inflation of out of pocket costs to live a daily existence in this country.

Instead, it has become a manipulated statistic using academic theories as a cover to systematically under-report the true level of inflation. The purpose has been to cut annual cost of living adjustments to Social Security and other government benefits, while over-estimating the true level of GDP. Artificially low inflation figures allow the mega-corporations who control the country to keep wage increases to workers low. Under-reporting the true level of inflation also allows the Federal Reserve to keep their discount rate far lower than it would be in an honest free market. The Wall Street banks, who own and control the Federal Reserve, are free to charge 18% on credit card balances while paying .25% to savers. The manipulation of the CPI benefits the vested interests, impoverishes the masses, and slowly but surely contributes to the destruction of our economic system.

A deep dive into Table 2 from the BLS reveals some truth and uncovers more lies. Their weighting of everyday living expenditures is warped and purposefully misleading. Let’s look at the annual increases in some food items we might consume in the course of a month, living in this empire of lies:

  • Ground Beef – 10.1%
  • Roast Beef – 11.8%
  • Steak – 11.1%
  • Eggs – 21.8%
  • Chicken – 3.7%
  • Coffee – 3.4%
  • Sugar – 4.2%
  • Candy – 4.6%
  • Snacks – 3.5%
  • Salt & Seasonings – 5.3%
  • Food Away From Home – 3.0%

Continue reading “LIES, DAMNED LIES & STATISTICS”

THE UNAFFORDABLE CARE ACT IS AN UNQUALIFIED DISASTER

Obama declared that Obamacare would not add one dime to the national debt. Obama declared that every family in America would see their annual premiums go down by $2,500. Obama declared that 30 million uninsured Americans would now be covered.

Does anyone ever get held accountable for their promises in this country?

My annual healthcare costs have risen by an average of 10% per year since Obamacare was implemented, and I work for a large institution. Millions have lost coverage or have seen their costs double or triple.

The assumptions put forth by the government were bogus, so premiums for the actual Obamacare plans are going up 20% to 50% per year.

No liberal ever mentions the fact that deductibles for the cheapest Obamacare plans run from $5,000 to $10,000. How many middle class people can pay those deductibles?

And the coup de grace. Only 10 million people are signed up for Obamacare, and most of them had coverage before it came along.

Obamacare is a disaster and will only get worse as time goes on. The Medicaid system is being swamped and the bankrupt states will become more bankrupt.

Government destroying our lives, a day at a time. So it goes.


Guest Post by Michael Tanner

As we await the Supreme Court’s decision on subsidies, an interim report. We haven’t heard much about Obamacare from the media lately (with the exception of Paul Krugman, who slips a paragraph into every other column — regardless of topic — to tell us how well it’s working). It’s as if both supporters and opponents of the health-care law are holding their collective breaths as they wait for the Supreme Court, which is expected to decide any day now whether the law will be able to survive in its current form.

Obamacare’s opponents have mostly been caucusing behind closed doors trying to decide whether and when to offer an alternative — and how much to offer — should the Court require the law to be implemented as written — that is, without subsidies on federally run exchanges.

The law’s advocates, meanwhile, may have been left speechless by the news that Obamacare has tied an all-time low for public support, according to the latest Washington Post/ABC News poll. Just 39 percent of registered voters back the law, tying an all-time low last reached in April 2012. Fifty-four percent oppose it, and while that’s not a record, it represents a six-point increase in opposition over the past year.

Or maybe the law’s supporters simply have little response to the ongoing spate of news suggesting that, Krugman notwithstanding, the law is still not working very well. For example, insurance companies have begun submitting their requests for rate increases for 2016, and those requests suggest that premiums could skyrocket next year.

Already we’ve seen requests for increases for individual plans as high as 64.8 percent in Texas, 61 percent in Pennsylvania, 51.6 percent in New Mexico, 36.3 percent in Tennessee, 30.4 percent in Maryland, 25 percent in Oregon, and 19.9 percent in Washington.

Those increases would come on top of premium increases last year that were 24.4 percent above what they would have been without Obamacare, according to a study from the National Bureau of Economic Research. At the same time, deductibles for the cheapest Obamacare plans now average about $5,180 for individuals and $10,500 for families.

Continue reading “THE UNAFFORDABLE CARE ACT IS AN UNQUALIFIED DISASTER”

THE FED’S SUCCESS STORY

Do you need any more proof who the Federal Reserve works for? It’s good to be the king, or a lackey kissing the king’s ass, or a banker bribing the king. Has the price of your house tripled in the last three years? This is truly an oligarch recovery for the privileged few in NYC and DC.

Hat tip Boston Bob


HOW’S THAT DEFLATION WORKING OUT FOR YOU?

The BLS put out their monthly CPI lie last week. They issued the proclamation that inflation is dead. Did you know your costs are 0.1% lower than they were one year ago. They then used these deflation numbers to proclaim your real wages soared last month. It’s all good. The American consumer is so flush with cash, they decided to spend less money for the second month in a row. The Wall Street shysters are so happy with declining consumer spending, declining corporate profits, and a global recession, they pushed the NASDAQ up to 5,000 for the first time in 15 years. Hey!!! That was the year 2000. Things really got better after that milestone.

So we know gasoline prices have plummeted in the last year (but are up 20% in the last month), but I’m trying to think of other things I use in my everyday life that have declined in price. Maybe going through the BLS detailed list will jog my memory. Here is the link to their data:

http://www.bls.gov/cpi/cpid1501.pdf

Let’s see how much deflation we’ve experienced in the last year for things we need to live our everyday lives.

Beef and veal  +22.5%

Ground beef  +21.0%

Steaks  +14.9%

Pork  +7.4%

Ham  +11.5%

Whole Chicken  +6.1%

Continue reading “HOW’S THAT DEFLATION WORKING OUT FOR YOU?”

PEAK BAKKEN

The number of oil rigs operating in North Dakota was already declining before the epic plunge in oil prices. That was when Bakken crude was fetching $60 to $70 per barrel. It sells at a steep discount to WTI. Guess what it is selling for today? How about $41.75. How many heavily indebted oil drillers can make money at $41.75? A helluva lot less than two months ago.

What I love about the internet is you can find serious research done by people who understand an industry, but are not being paid to sell a story. The report below is filled with data, facts and truth. You will get none of that from the shills and morons paraded on CNBC or quoted in the Wall Street Journal. They are selling bullshit and propaganda.

I am no expert on shale oil extraction, but I understand supply, demand, extreme debt levels, and mal-investment. The great shale oil boom is over. It was created by Wall Street and the Federal Reserve. All booms go bust. This bust might be the trigger for a bigger bust. Get ready for another taxpayer bailout.

A commenter on Zero Hedge named Cooter describes exactly what I believe will happen. Enjoy this momentary relief in energy prices because this bust will insure much higher prices later.

Just to put the current US oil boom into further perspective, over the past five years global oil production has increased by 3.85 million bpd. During that same time span, US production increased by 3.22 million bpd — 83.6 percent of the total global increase. Had the US shale oil boom never happened and US production continued to decline as it had for nearly 40 years prior to 2008, the global price of oil might easily be at $150 to $200 a barrel by now. Without those additional barrels on the market from (primarily) North Dakota and Texas, the price of crude would have risen until supply and demand were in balance.

While the speculation about prices is just that, the role of the frack industry in proping up global production is not. That oil is coming off the market going forward. So, we are setting up for a double whammy … prices go down and take out all the marginal production … and then if there is even a whiff of recovery, prices are going way back up as supply won’t be able to track demand globally.

Via Peak Oil Barrel 

Bakken and North Dakota Production Report

The North Dakota Industrial Commission just published their Bakken Monthly Oil Production Statistics and also their ND Monthly Oil Production Statistics.

Bakken Barrels Per Day 2

Bakken production was down 1,598 barrels per day to 1,118,010 bpd. All North Dakota production was down 4,054 bpd to 1,182,174 bpd.

From the Director’s Cut, bold mine:

The drilling rig count dropped 2 from September to October, an additional 3 from October to November, and has since fallen 5 more from November to today. The number of well completions decreased from 193(final) in September to 134(preliminary) in October. Three significant forces are driving the slow-down: oil price, flaring reduction, and oil conditioning. Several operators have reported postponing completion work to achieve the NDIC gas capture goals. There were no major precipitation events, but there were 9 days with wind speeds in excess of 35 mph (too high for completion work).

The drillers outpaced completion crews in October. At the end of October there were about 650 wells waiting on completion services, an increase of 40.

Crude oil take away capacity is expected to remain adequate as long as rail deliveries to coastal refineries keep growing.

Rig count in the Williston Basin is set to fall rapidly during the first quarter of 2015. Utilization rate for rigs capable of 20,000+ feet is currently about 90%, and for shallow well rigs (7,000 feet or less) about 60%.

Sep rig count 193
Oct rig count 191
Nov rig count 188
Today’s rig count is 183

Sep Sweet Crude Price = $74.85/barrel
Oct Sweet Crude Price = $68.94/barrel
Nov Sweet Crude Price = $60.61/barrel
Today Sweet Crude Price = $41.75/barrel (lowest since March 2009)

I just checked Rig Count. It now stands at 181 but one of them is drilling a salt water disposal well. So they have 180 rigs drilling for oil right now.

Bakken Wells Producing

Bakken wells producing increased by 118 to 8,602 while North Dakota wells producing increased by 92 to 11,507. Since Bakken wells are included in the North Dakota count this means at least 26 wells outside the Bakken had to be shut down.

ND Prod per 1000

I am still tracking first 24 hours production by well numbers. I am now more convinced than ever that the first 24 hours production is a significant indicator of future production of that well. So far there are only 73 wells in the 28000s however.

ND First 24 hr

Using a 300 well average and sorting by well number you can see how the BOPD falls off as the well number gets higher. The 27000s seems to have leveled out but I believe it will keep falling as more higher well numbers come on line.

I have 2 weeks worth of data for December. There are 121 wells brought on line so far in December. But concerning the first 24 hours of water cut.

Bakken Dec. Water Cut

Everyone is telling me the first 24 hours is all fracking water so it means nothing. Welllll… I think the drillers have some way of accounting for that. I sorted the 121 wells I have so far for December by barrels of water per day. Above you see the seven wells with the lowest water cut. If the water that comes up the first 24 hours is all fracking water then there is a problem here. I am willing to hear opinions of what that problem is because I haven’t a clue.

Incidentally at the other end of the sort, the seven wells with the highest water in the first 24 hours, averaged 5,396 barrels of water per well and 1,898 barrels of oil per well.

Bakken Barrels Per Day

I have included the the Bakken data from the EIA’s Drilling Productivity Report here. Their data is for all the Bakken, including the Montana part, but not the non Bakken part of North Dakota. Their data goes through January 2015. The last six months of the DPR data is nothing but a wild guess.

I wanted to show the DPR data because people and the media keep pointing to it as if it were gospel as to what will be produced from all shale fields within the next two months. For instance this article: EIA: Despite lower crude oil prices, U.S. crude oil production expected to grow in 2015.

The recent decline in crude oil prices has created the potential for weaker crude oil production. EIA’s Drilling Productivity Report (DPR) includes indicators that provide details on the effect low prices may have on tight oil production, which accounts for 56% of total U.S. oil production. Analyzing these indicators and the changes in oil production following the drop in crude oil prices during the 2008-09 recession may offer some insight into possible near-term oil production trends.

They are expecting great things, at least through January 2015. From their report:

DPR Expectations

They are expecting light tight oil to be up 116,000 barrels per day in January. They think the Bakken will be up 27,000 bpd in January and Texas’ Eagle Ford and the Permian to be up a whopping 76,000 barrels per day.

DPR Report

I did the math. If these decline rates are right, then in January, these two fields will decline by 208,000 barrels per day. That is they will have to produce 208,000 barrels of new oil in January just to break even. Or if production declines by just 21.5% they will just break even. I expect new well production from these two fields, for most months next year, to be well below 208,000 barrels per day

The IEA has lowered their expectations for 2015 but only slightly.
Oil Market Report

Global production fell by 340 kb/d in November to 94.1 mb/d on lower OPEC supplies. Annual gains of 2.1 mb/d were split evenly between OPEC and non-OPEC. Surging US light tight oil supply looks set to push total non-OPEC production to record growth of 1.9 mb/d this year, but the pace is expected to slow to 1.3 mb/d in 2015.

Note: I send an email notice when I publish a new post. If you would like to receive that notice then email me at DarwinianOne at Gmail.com.

Oil Price Slide – No Good Way Out

Gail wrote this almost four weeks ago when oil was still $80 per barrel. Today it is $66 per barrel. The unintended consequences of this crash have yet to be realized. Enjoy the lower gasoline prices, because the other consequences may not be so pleasant.

Guest Post by Gail Tverberg

The world is in a dangerous place now. A large share of oil sellers need the revenue from oil sales. They have to continue producing, regardless of how low oil prices go unless they are stopped by bankruptcy, revolution, or something else that gives them a very clear signal to stop. Producers of oil from US shale are in this category, as are most oil exporters, including many of the OPEC countries and Russia.

Some large oil companies, such as Shell and ExxonMobil, decided even before the recent drop in prices that they couldn’t make money by developing available producible resources at then-available prices, likely around $100 barrel. See my post, Beginning of the End? Oil Companies Cut Back on Spending. These large companies are in the process of trying to sell off acreage, if they can find someone to buy it. Their actions will eventually lead to a drop in oil production, but not very quickly–maybe in a couple of years.

So there is a definite time lag in slowing production–even with very low prices. In fact, if US shale production keeps rising, and Libya and Iraq keep work at getting oil production on line, we may even see an increase in world oil production, at a time when world oil production needs to decline.

A Decrease in Oil Prices May Not Fix Oil Demand

At the same time, demand doesn’t pick up quickly as prices drop. We are dealing with a world that has a huge amount of debt. China in particular has been on a debt binge that cannot continue at the same pace. A reduction in China’s debt, or even slower growth in its debt, reduces growth in the demand for oil, and thus its price. The same situation holds for other countries that are now saturated with debt, and trying to come closer to balancing their budgets.

Furthermore, the Federal Reserve’s discontinuation of quantitative easing has cut off a major flow of funds to emerging markets. Because of this change, emerging market demand for oil has dropped. This has happened partly because of the lower investment funds available, and partly because the value of emerging market currencies relative to the dollar has fallen. Again, a decrease in oil price is not likely to fix this problem to a significant extent.

Europe and Japan are having difficulty being competitive in today’s world. A drop in oil prices will help a bit, but their problems will mostly remain because to a significant extent they relate to high wages, taxes, and electricity prices compared to other producers. The reduction in oil prices will not fix these issues, unless it leads to lower wages (ouch). The reduction in oil prices is instead likely to lead to a different problem–deflation–that is hard to deal with. Deflation may indirectly lead to debt defaults and a further drop in oil demand and oil prices.

Thus, oil prices are likely to continue their slide for some time, until real damage is done, perhaps to several economies simultaneously.

The United States’ Role in the Oil Over-Production / Under-Demand Clash 


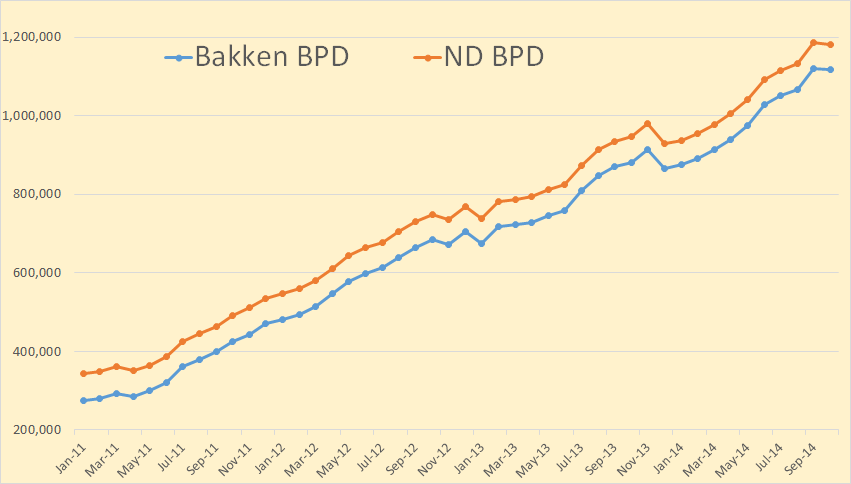
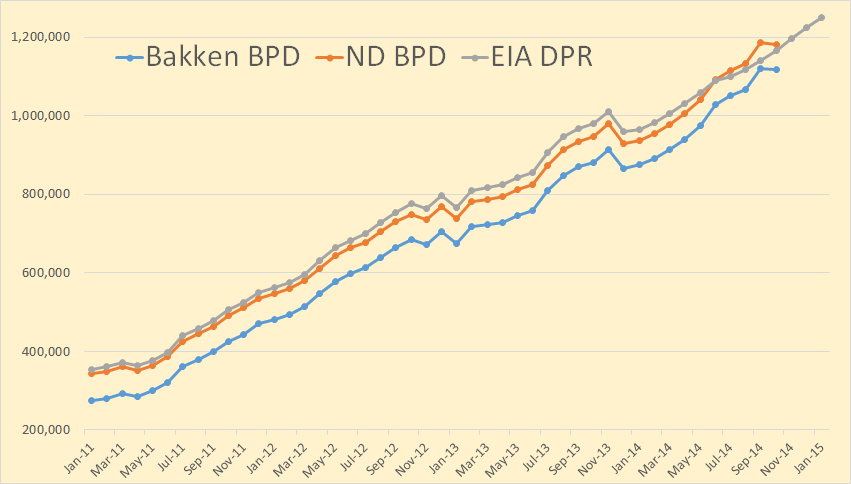
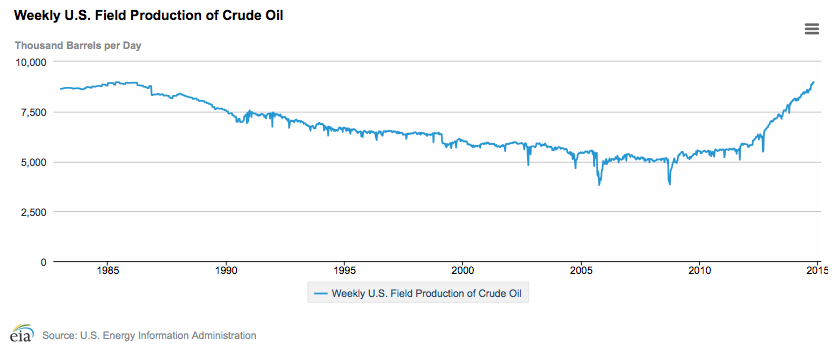
The United States is the country with the single largest increase in oil production in the past year. This growth in oil production seems not to have stopped, in recent weeks.

Figure 1. US Weekly Crude Oil Production through Oct 24. Chart by EIA.

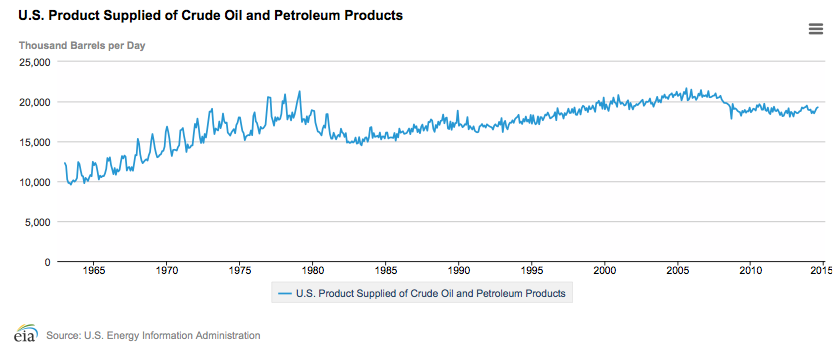
At the same time, the US’ own consumption of oil has not increased (Figure 2).

Figure 2. US oil consumption (called "Product Supplied"). Chart by EIA.

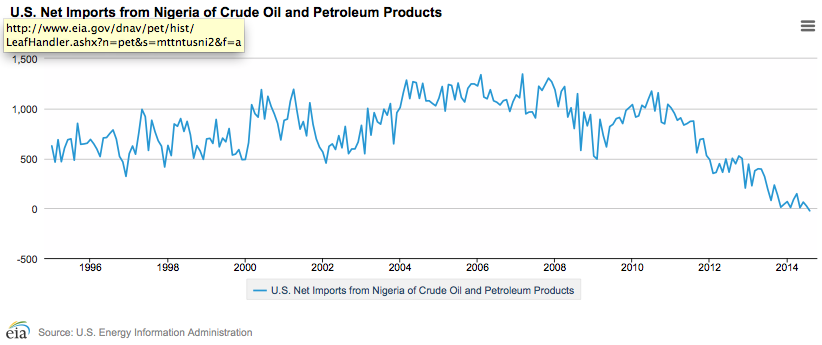
The result is a drop in needed imports. A number of oil exporters have been hit by the US drop in imports. Nigeria extracts a very light oil that competes for refinery space with oil from shale formations. Our imports of Nigerian oil have been reduced to zero (Figure 3). (The amounts I am showing on this and several other charts are “net imports.” These reflect transactions in both directions. Often the US imports crude oil and exports oil products, sometimes to the same country. In such a case, we are selling refinery services.)

Figure 3. US Net Petroleum Imports from Nigeria. Chart by EIA.

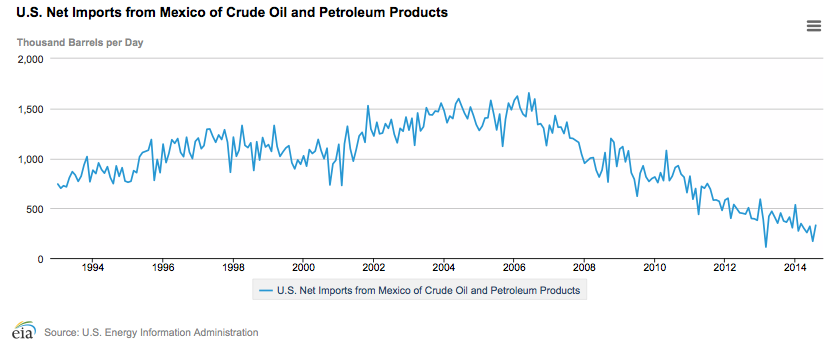
Our imports of oil from Mexico are way down as well (Figure 4), in part because their oil production has been falling.

Figure 4. US Net Imports of Petroleum from Mexico. Chart by EIA.

It is only in the past few months that US imports from Saudi Arabia have started to be significantly affected (Figure 5).

Figure 5. US net oil imports from Saudi Arabia. Chart by EIA.

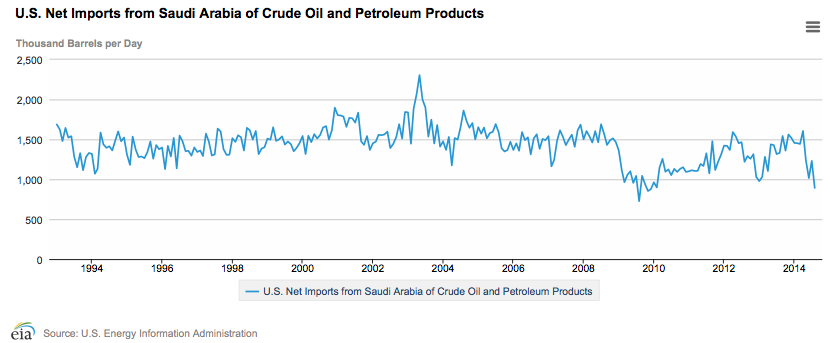
Saudi Arabia, like other oil exporters, depends on the sale of oil revenue to provide tax revenue for its budget. While it has a reserve fund for rainy days, over the long term it, too, depends on revenue from oil exports. If Saudi Arabia’s exports to the United States decrease, Saudi Arabia needs to find someone else to sell these would-be exports to, or revenues to fund its budget will drop.

Alternatively, it can reduce the price it charges to US refineries, to influence purchasing decisions–something it has just done. Lowering its price to US refineries tends to push the world price for oil down.

Of course, the US also talks about allowing an increasing amount of crude oil exports, as its oil from shale formations rises. This increase would make the surplus of oil on the market worse, and world prices lower, if oil demand does not pick up.

Depending on Saudi Arabia and OPEC

In the West, we have been led to believe that OPEC in general and Saudi Arabia in particular exert great control over oil prices. We have been told that several OPEC countries have spare capacity. Several of the Middle Eastern countries claim that they have very high reserves, and we have been led to believe that they can ramp up their production if they invest more money to do so. We have also been told that these countries will reduce oil production, if needed, to hold up oil prices.

A very significant part of what we have been led to believe is exaggerated. Saudi Arabia’s oil exports were much higher back in the late 1970s than they are now (Figure 6). When they cut oil production and exports in the 1980s, they likely did have spare capacity.

Figure 6. Saudi oil production, consumption and exports based on EIA data.

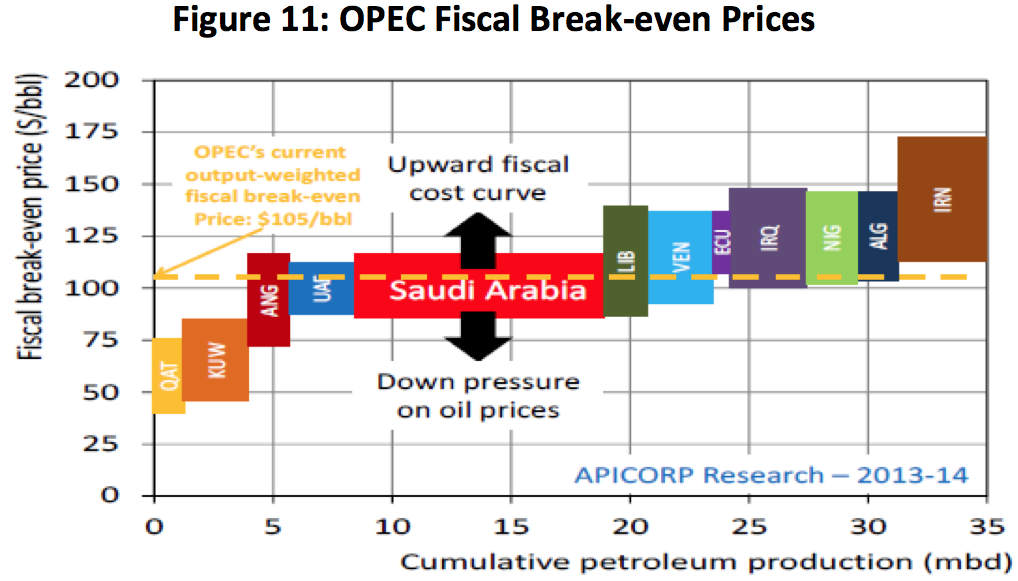
But where we are now, the situation has changed greatly. The population of the Middle Eastern oil producers has risen. So has their own use of the oil they extract. Their budgets have risen, and the countries need increasing revenue from oil taxes to meet their budgets. Some countries, including Venezuela, Nigeria, and Iran, require oil prices well over $100 per barrel to support their budgets (Figure 7).

Figure 7. Estimate of OPEC break-even oil prices, including tax requirements by parent countries, from APICORP.

If oil prices are too low, subsidies for food and oil will need to be cut, as will spending on programs to provide jobs and new infrastructure such as desalination plants. If the cuts are too great, there is the possibility of revolution and rapid decline of oil production. Virtually none of the OPEC countries can get along with oil prices in the $80 per barrel range (Figure 7).

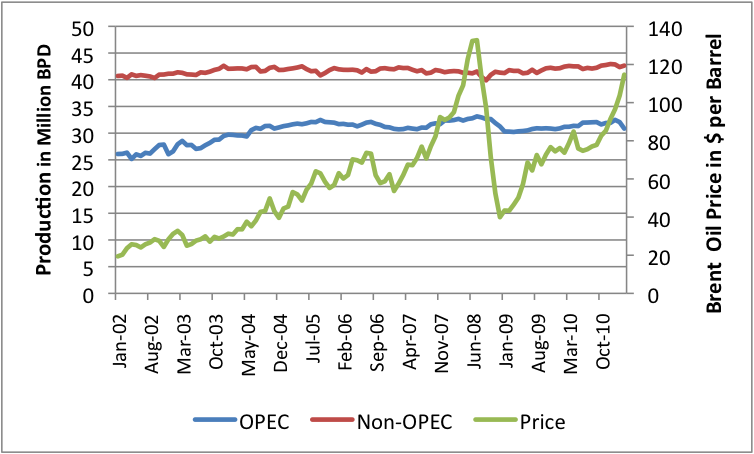
Most of OPEC’s actions in recent years have looked like actions a person would expect if OPEC countries were not all that different from other oil producers–their oil supplies were subject to limits and they tended to act in their own self interest. When oil prices were rising rapidly in the 2007-2008 period, they ramped up production, but not by very much and not very quickly (Figure 8). When oil prices dropped, they dropped their production back to where it had been, before the big ramp up in prices.

Figure 7. OPEC and Non-OPEC Oil Production, Compared to Oil Price. (Production is Crude and Condensate from EIA.)

Another situation occurred when Libya’s production declined in 2011. Saudi Arabia said it would increase its own supply to offset, but it could only produce extra very heavy crude when light oil was what was needed. In fact, even the increase in heavy oil is somewhat in doubt.

Furthermore, the dynamics of OPEC have been changed considerably in the last few years. Part of the problem relates to fact that both oil prices and the quantity of oil exports have been approximately flat in the period between 2011 and mid-2014.  In such a situation, revenue from oil exports tends to be flat. OPEC members have found this to be a problem because their populations continued to grow and their need for water and imported food has continued to rise. These countries need ever-more tax revenue, but oil revenue is not providing it. At a minimum, OPEC countries have a strong “need” to maintain their current level of oil exports.

The other part of changing OPEC dynamics relates to increased oil production volatility. The bombing of Libya and sanctions against Iran have both produced unstable situations. Oil exports from both of these countries are lower than in the past, but can suddenly rise as their problems are “fixed,” adding to downward price pressures.

Another issue is the significant attempt to raise Iraq’s oil production in recent years. If Iraq’s oil production (plus US shale production) is too much to satisfy world demand for oil, should the rest of OPEC be the ones to try to “fix” the problem?

Figure 9. US net imports from Iraq. Exhibit by EIA.

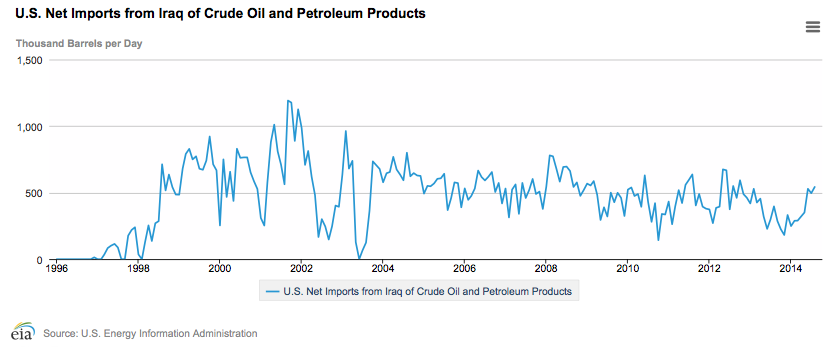
Figure 9 seems to indicate that US imports from Iraq have increased in recent months. Of course, if we import more from Iraq, we will likely need to cut back on imports elsewhere. This doesn’t create good feelings among OPEC exporters.

Shouldn’t the United States Take Some Responsibility for Fixing the Problem?

One might ask whether the United States should be cutting back in its oil production, in response to low prices. Of course, as indicated above, US oil majors (like Shell, Chevron, and Exxon) are cutting back on investment in new fields, and this is eventually likely to lead to lower production. The question is whether this will be a sufficient change, quickly enough.

It is less likely that shale drillers will intentionally cut back quickly. The shale drillers have taken on leases on huge acreage and are reluctant to step back now. For one thing, part of their costs has already been paid, reducing their costs going forward on acreage already under development. They also have debt that needs to be repaid and many contractual arrangements with respect to drilling rigs, pipelines, and other services. Some may have futures contracts in place that will soften the impact of the oil price drop, at least for a while. Because of all of these factors, there is a tendency to continue business as usual, for as long as possible.

Whether or not shale drillers intentionally plan to cut back on oil production, some of them may be forced to, whether or not they believe that the production is likely to be profitable over the long run. The problem is likely to be falling cash flow because of lower oil prices, if the price drop is not mitigated by futures contracts. Because of this, some companies may be forced to cut back on drilling quite soon. Another alternative might be to ramp up borrowing, but lenders may not be very happy with such an arrangement.

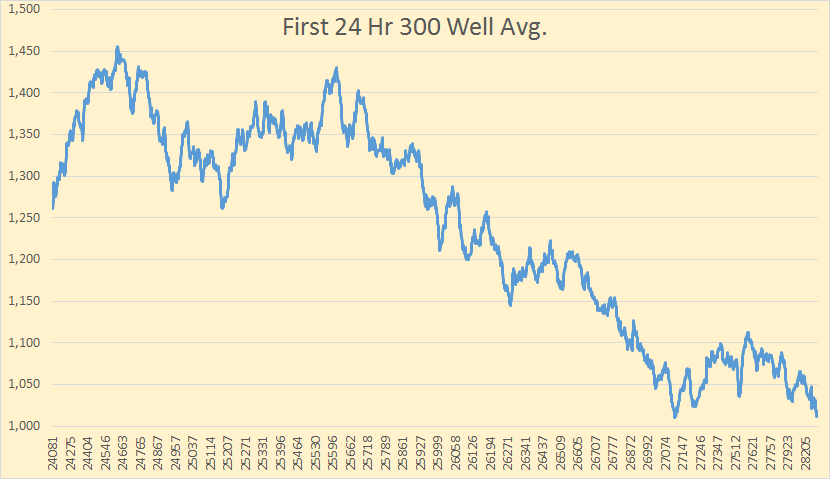
We notice that some companies are already in very cash flow negative situations–in other words, in situations where they need to keep adding more debt. For example, Capital Resources, the largest operator in the Bakken, shows rapidly growing outstanding debt through 6/30/2014, without seeming to take on significant new acreage (Figure 10).

Figure 10. Selected figures from SEC filings by Continental Resources.

When companies are already in such cash flow negative situation, there may be more problems than otherwise.

If Lower Oil Prices “Hang Around” for Months to Years, What Could this Mean?

We are in uncharted territory, in such a situation.

One of the big issues is potential deflation. The issue seems to be not only lower oil prices, but lower prices for many other commodities, as well. The concern is that wages will drop, as will government receipts. Lower wages already seem to be happening in Spain. Unless governments figure out a way to “fix” the situation, this situation will make debt repayment very difficult. Lower debt will tend to reinforce the low prices of oil and other commodities.

If low prices become the norm for many kinds of commodities, we can expect major cutbacks in production of these commodities. This would be the situation of the 1930s all over again. Ben Bernanke has said he would send helicopters of money to prevent such a situation. The question is whether this can really be arranged, given that the United States  (and several other countries) have already been “printing money” since 2008. At some point, it would seem like the arsenals of central banks will get used up.

If there is a cut back in debt and cutback in production of commodities, many goods we have come to expect in the market place will disappear, as will many jobs. There are likely to be breaks in supply chains, leading to more cutbacks in production.

With all of the debt problems, there is a question of how well international trade will hold up. Will would-be explorers trust buyers who have recently defaulted on their debt, and don’t look likely to be able to earn enough to pay for the goods that they currently are ordering?

The discussion has been mostly with respect to oil, but liquefied natural gas (LNG) is likely to be affected by low prices as well. Reuters is reporting that likelihood of US exports of LNG to Asia is down, for a number of reasons, including the discovery that costs would be higher than originally expected and the regulatory process less smooth. Another reason LNG exports are likely to be low is the fact that Asian prices dropped from a high of $20.50/mmBtu in February to a low of $10.60/mmBtu in August. Without sustained high LNG prices, it is hard to support the huge infrastructure investment needed for LNG exports.

Can Oil Prices Bounce Back?

If we could somehow fix the world’s debt problems, a rise in the price of oil would seem to be much more likely than it looks right now. As long as the drop in demand is related to declining debt, and the potential feedbacks seem to be in the direction of deflation and the possibility of making defaults ever more likely, we have a problem. The only direction for oil prices to go would seem to be downward.

I know that we have very creative central banks. But the issue at hand is really diminishing returns. Prior to diminishing returns becoming a problem, it was possible to extract and refine oil cheaply. With cheap oil, it was possible to create an economy with low-priced oil, inexpensive infrastructure built with that low-priced oil, and factories built with low-priced oil. Workers seemed to be very productive in such a setting, in part because low-priced oil allowed increased mechanization of production and allowed cheap transport of goods.

Once diminishing returns set in, oil became increasingly expensive to extract, because we needed to use more resources to obtain oil that was very deep, or in shale formations, or that required desalination plants to support the population. Once we needed to allocate resources for these endeavors, fewer resources were available for more general uses. With fewer resources for general activities, economic growth has become inhibited. This has tended to lead to fewer jobs, especially good-paying jobs. It also makes debt harder to repay. History shows that many economies have collapsed because of diminishing returns.

Most people assume that of course, oil prices will rise. That is what they learned from supply and demand discussions in Economics 101. I think that what we learned in Econ 101 is wrong because the supply and demand model most economists use ignores important feedback loops. (See my post Why Standard Economic Models Don’t Work–Our Economy is a Network.)

We often hear that if there is not enough oil at a given price, the situation will lead to substitution or to demand destruction. Because of the networked nature of the economy, this demand destruction comes about in a different way than most economists expect–it comes from fewer people having jobs with good wages. With lower wages, it also comes from less debt being available. We end up with a disparity between what consumers can afford to pay for oil, and the amount that it costs to extract the oil. This is the problem we are facing today, and it is a very difficult issue.

We have been hearing for so long that the problem of “peak oil” will be inadequate supply and high prices that we cannot adjust our thinking to the real situation. In fact, the two major problems of oil limits are likely to be shrinking debt and shrinking wages. The reason that oil supply will drop is likely to be because customers cannot afford to pay for it; they don’t have jobs that pay well and they can’t get loans.

In some ways, the oil prices situation reminds me of driving down a road where we have been warned to look carefully toward the left for potential problems. In fact, the potential problem is in precisely in the opposite direction–to the right. The problem gets overlooked for a very long time, because most of us have been looking out the wrong window.

For more on this subject, read my last two posts:

WSJ Gets it Wrong on “Why Peak Oil Predictions Haven’t Come True”

Eight Pieces of Our Oil Price Predicament

19 US Shale Areas That Are Suddenly Endangered, “The Shale Revolution Doesn’t Work At $80”

Enjoy the sub $3.00 gas prices while they last. The Saudis know what they are doing. Oil was $25 per barrel and gas prices were below $2.00 when the Saudis took down the twin towers. Know your enemy.

Tyler Durden's picture

STICK A FORK IN THE HOUSING RECOVERY MEME

Did you ever notice that government reports are only revised lower in future months after the initial reports are used to support the government’s contention that the economy is improving? Did you ever notice that Wall Street and the MSM mouthpieces go bonkers over the initial reports and then don’t report the dramatically lower revisions? Did you ever notice that your keepers are fucking you over?

Make sure you notice that last chart with the median new home sales price. That will not be revised higher.

The Housing Recovery Has Been Canceled Due To Data Revisions

Tyler Durden's picture

Last month, when, with great amusement, we reported that “New Home Sales Explode Higher Thanks To… Record High Average New Home Prices?”, we mocked the latest batch of bullshit data released by the US department of truth as follows:

New Home Sales rose a magnificent (seasonally-adjusted annualized rate) 18% in August – the biggest monthly rise since January 1992 albeit with a 16.3 90% confidence interval, meaning the final number may well be +1.7%. At 504k, new home sales are back at May 2008 levels (though obviously massively below the 1.4 million homes sold at the peak in 2005). As a reminder, May’s 504K new home sales print was later revised later to 458K. But even more stunning, new home sales in The West rose a mind-numbing 50% in August (and up 84.4% YoY – nearly double). 

Well, it is now a month later, and here come the revisions: first, that 50% surge in the West was revised… 30K lower. But to get a sense of just how bad the revision was, here is the old, pre-revision data, and the “data” following the latest revision.

In short: the euphoric, consensus-beating data for every single month since May has been revised lower, by on average 6% and as much as 9%. Perhaps finally people will realize that there is only one number that matters in the Census bureau’s monthly new home sales report: the ±15.7 90% confidence interval. Well, people maybe, but not algos, who only care about one thing: whether the data beat or missed.

Now we wonder: will all those market surges over the past 4 months which were based on erroneous headline data, all be revised lower? Sarcasm off.

Oh, and as for that record new home price reported last month, which magically also resulted in what the US government wanted everyone to believe was a surge in buying… well, see for yourselves:

So to summarize: the latest “housing recovery” has been indefinitely postponed due to data revisions.

THANK ISIS FOR LOWER GAS PRICES

While Obama takes bows for oil prices dropping from $100 per barrel to $93 per barrel due to our shale oil revolution, maybe we should be thanking those dreaded ISIS terrorists. They are evidently dumping Iraqi and Syrian oil into the market at $40 per barrel. The world oil markets adapt to supply and demand through the mechanism of pricing. If these existential threat terrorists really are dumping oil onto the market at $40 per barrel, then prices would be driven downward. Shouldn’t we be thanking them? The other possibility is that the worldwide economy is contracting and demand is slowing dramatically. That couldn’t be the case. My beloved government tells me we are growing like gangbusters.

I have a few of questions about how a few thousand ignorant terrorist ragheaded camel fuckers can somehow successfully run oil refineries, pipelines and oil wells and sell 80,000 barrels of oil per day. 

How do they manage to do this without the U.S. knowing who is buying the oil?

Who is buying this oil?

Are they getting paid in cash?

Are banks involved in these transactions?

Where are they depositing the $97 million per month?

We keep introducing sanctions against Russia, but our Empire can’t stop a bunch of terrorists from selling 80,000 barrels of oil per day?

So, these terrible terrorists are using our military equipment that we gave them to fight our enemies Assad and Iran, and they are lowering our gas prices by selling oil really cheap to our allies (maybe even ourselves), but we need to eliminate them. Now I understand. It’s as logical as Bush telling us to take a 7 year loan and buy a $50,000 GM to defeat the terrorists. Or we have to scrap free market capitalism to save free market capitalism. I’m beginning to understand.

http://www.zerohedge.com/sites/default/files/images/user3303/imageroot/2014/09/20140911_isis.png


DEMAND COULDN’T BE CONTRACTING. RIGHT?